ECOLOGY, BEHAVIOR AND BIONOMICS
Tritrophic Analysis of the Coffee (
Coffea arabica
) - Coffee Berry Borer
[
Hypothenemus hampei
(Ferrari)] - Parasitoid System
ANDREW P. GUTIERREZ1, AMADOR VILLACORTA2, JOSE R. CURE3AND C. KEN ELLIS1
1ESPM/Division of Ecosystem Science and the Center for Biological Control,
University of California, Berkeley, CA. 94720, USA.
2Instituto Agronômico do Paraná, Rod. Celso Garcia Cid, Km 375,
86.001-970, Londrina, PR, Brasil.
3Departamento de Biologia, Universidad Militar de Nueva Granada,
Bogota, A.A. 49300, Colombia. An. Soc. Entomol. Brasil 27(3): 357-385 (1998)
Análise Tritrófica do Café (Coffea arabica) - Sistema Broca-do-Café [Hypothenemus hampei (Ferrari)] - Parasitóide
RESUMO – Desenvolveu-se um modelo tritrófico de simulação para o cafeeiro (Coffea arabica var. mundo novo), a broca- do- café [Hypothenemus hampei (Ferrari)] e três de seus parasitóides. O modelo contém a dinâmica da planta estruturada por idade e massa e é influenciado por fatores edáficos e meteorológicos. Dados extensivos de matéria seca de plantas de cafeeiro foram coletados durante três anos e dados de campo sobre a dinâmica da broca foram observados durante um ano. Os trabalhos foram desenvolvidos na sede do IAPAR, Londrina, PR, Brasil. Estes dados foram usados para estimar as relações alométricas e os parâmetros de alocação de matéria mas os parâmetros para a broca e três dos seus parasitóides, foram baseados em dados resumidos da literatura. Níveis iniciais de fatores do solo ( nitrogênio e água ) e dados climáticos foram usados para executar o modelo. Este modelo é independente dos dados de campo, entretanto simula a dinâmica de ramificaçao, frutificação e crescimento da matéria seca das subunidades da planta. Resultados de simulação sugerem que, dos três parasitóides introduzidos para controlar a broca, somente o eulofideo adulto endoparasitóide (Phymastichus coffea La Salle) exibe caracteristicas demográficas para, potencialmente controlar as populações da broca . Os efeitos da colheita, a remoção dos frutos não colhidos (na planta e no solo ), liberações inundativas de parasitóides e o uso de inseticidas com diferentes características de toxidez e persistência sobre a dinâmica da broca, foram avaliados. O modelo é flexível e fornece uma base sólida para incorporar novos conhecimentos, novas variedades e a biologia de novos inimigos naturais a nível mundial.
PALAVRAS-CHAVE: Insecta, broca-do-café, parasitóides, controle biológico, modelo tritrófico.
[Hypothenemus hampei (Ferrari)], borer - three parasitoid system was devel-oped. Three years of extensive plant drymatter data and one year of field data on borer dynamics were collected at Londrina, PR, Brazil. The allometric rela-tionships and parameter for plant drymatter allocation were estimated from the field data, but the parameters for borer and its three parasitoids were summa-rized from the literature. Initial levels of soil factors (e.g., nitrogen and water) and observed weather data were used to drive the model. The model is largely independent of the field data, yet it simulated the dynamics of plant branching, fruiting and drymatter growth of plant subunits. Simulation results suggest that of the three parasitoids commonly introduced to control the borer, only the eulophid adult endo-parasitoid (Phymastichus coffea La Salle) has the demo-graphic characteristics to potentially regulate borer populations. The effects of harvesting, cleanup of abscised berries, inundative releases of parasitoids and pesticides with various toxicity and persistence characteristics on borer dynam-ics were evaluated. The model is very flexible, and may provide a sound foun-dation for incorporating new findings, new varieties, and the biology of new natural enemies worldwide.
KEY WORDS: Insecta, coffee, coffee berry borer, parasitoids, biological con-trol, tritrophic modeling.
The economic value of coffee (Coffea arabica var. mundo novo) worldwide is about 15 billions dollars per year, and the exotic cof-fee berry borer [broca do café , Hypothe-nemus hampei (Ferrari) (Coleoptera: Scolytidae)] threatens it production in many areas. This pest was accidentally introduced to South America (Oliveira Filho 1927, Gallo et al. 1978), and the recent expansion of its range into Colombia, Central America and Mexico presents a vexing problem for bio-logical control specialist (Baker 1984, Klein -Koch et al. 1988, Barrera et al. 1990a,b). At-tempts to control borer using classical bio-logical control and inundative releases have a long history (LePelley 1968, Cenicafe 1990, Orozco & Aristizabal 1996, Aristizabal et al. 1996), and several agencies in affected Latin American countries are currently introducing parasitoids and pathogens to control it (Hoyos & Aristizábal 1996).
In this paper, field data from Brazil on coffee growth and development and borer dy-namics are summarized, and a tritrophic age-structured simulation model of the coffee sys-tem composed of coffee, borer and three
ex-otic parasitoids is presented and used to analyze various scenarios for control of borer. The model simulates the dynamics of the plant, borer, two species of larval - pupal parasitoids (Cephalonomia stephanoderis Betrem and Prorops nasuta Waterston, fam-ily Bethylidae) and an adult endoparasitoid (Phymastichus coffea LaSalle, family Eulophidae). The bethylid parasitoids have been used extensively for inundative releases in many affected regions. A larval parasitoid, Heterospilus coffeicola Schemied (family Braconidae) is known, but it was not included in our analysis because of insufficient bionom-ics data (Toledo & Fonseca 1935). Tritrophic models that include the plant are being in-creasingly used to assess the efficacy of bio-logical control agents (Gutierrez et al. 1988b, 1993, Mills & Gutierrez 1996, Gutierrez 1996), because failure to include it often crip-ples the utility of such models for evaluating pest management strategies.
Materials and Methods
Instituto Agronômico do Paraná (IAPAR) at Londrina, PR, Brazil (23° south latitude). A one-hectare plot of coffee (var. mundo novo) was planted at a density of two seedlings per hill in a 3x2-m grid on November 12, 1982. The seedlings had six pairs of leaves at plant-ing and were grown under natural rainfall during the period March 10, 1983, to June 1, 1986. Three samples consisting of two plants from the same hill were taken at 20-day inter-vals. Each tree was dissected by branch into its component subunits (e.g., leaf, branch wood, mainstem and root and fruit). The tap-root, but not the fibrous roots, was excavated. Fruit drymatter, but not berry numbers, were recorded. The plant material was dried in an oven at 60°C for three days and weighted.
Growth of individual branches continues for several seasons with fruits buds initiated from the prior year’s growth. The current sea-son’s growth is distinguished from that of prior seasons by its green color. During develop-ment, each berry passes through a pre-flower bud period (assumed to be eight weeks) and four post flower growth phases (I-IV, Fig. 1, cf., Salazar et al. 1993) that vary in their rela-tive preference to attack by borer (Cure et al. 1998).
Coffee Berry Borer. The phenology and abundance of borer life stages were estimated from 30 berry collected during the period February 7, 1986, to July 7, 1986. Ten stage III berries in the top, middle and bottom lev-els of the plant were selected at random. The berries were dissected and the number and age structure of borer were recorded. The num-bers of adults killed by the pathogen Beauveria bassiana (Bals.) Vuill. were also recorded.
Initial Conditions of the Model. The initial conditions of the model include estimates of plant mass, age structure of all subunits and initial levels of animal populations and their age structure. Rough estimates of root zone volume, initial inorganic nitrogen and organic matter as well as soil water holding capacity and current content. The parameters of all
animal species were summarized from the lit-erature (see Tables 1and 2).
Daily weather data recorded at IAPAR included max-min temperatures (°C), mm rainfall, solar radiation in watts/m2/day (see
Fig. 2) and average km of wind per day were used to drive the model. Time and age in the model are in physiological time units (degree-days, dd) above the developmental threshold for each species. Non-linear developmental rate models can be used but data to character-ize them are insufficient. A five-year simula-tion of the coffee system requires 15s on a 233 MHz microcomputer.
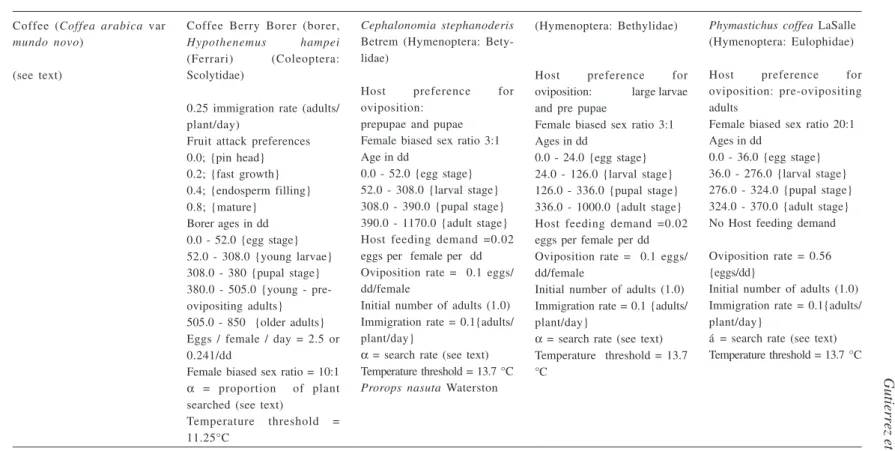
Phenology of Coffee Growth and Develop-ment. The plant drymatter data are plotted on physiological time (dd > 11.25°C, Fig. 3). The lines through the data were eye fit to emphasize trends. Comparisons with simula-tion results are presented in a later secsimula-tion.
Flower drymatter was first observed at about 5700 dd with a second flowering oc-curring at about 11000 dd (Fig. 3a). Plant vegetative growth (i.e., green wood and leaves) (3c,d)) slowed shortly after flowering began and coincided with the period of rapid phase II and III berry growth (Figs. 1, 3b). This slowing is seen as plateaus and later de-clines in leaf and green stem mass. Slowing of vegetative growth occurs because growing berries are stronger competitive sinks for photosynthate. As berries mature (phase IV), a second cycle of vegetative growth occurs followed by a larger second flowering (Fig. 3a). The field studies were terminated before the full effects of the second fruiting cycle could be observed.
Branching (Fig. 3e), mainstem node num-bers, plant height and stem diameter (Fig. 4) slowed as vegetative dry matter growth slowed. Mainstem nodes were produced at a rate of one per 300 dd before time 6000 dd, but the rate slowed to one per 430 dd thereaf-ter (a 43% decrease). Two lathereaf-teral branches are produced at each mainstem node, and their rate of production similarly slowed.
con-Gutierrez et al.
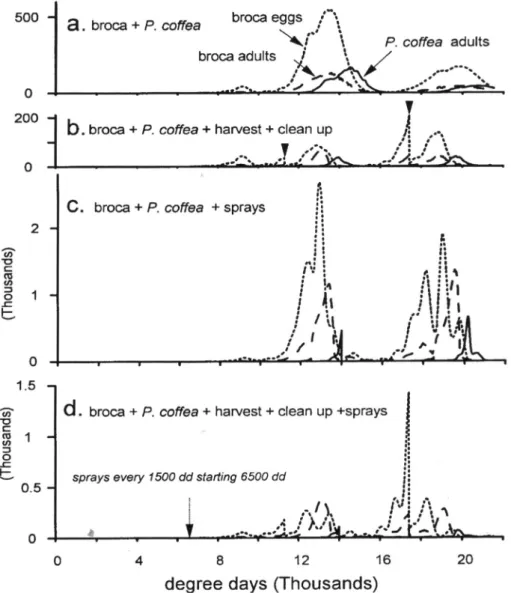
Table 1. Some parameters for tritrophic coffee systems model.
Coffee (Coffea arabica var
mundo novo)
(see text)
Coffee Berry Borer (borer,
Hypothenemus hampei
(Ferrari) (Coleoptera: Scolytidae)
0.25 immigration rate (adults/ plant/day)
Fruit attack preferences 0.0; {pin head} 0.2; {fast growth} 0.4; {endosperm filling} 0.8; {mature}
Borer ages in dd 0.0 - 52.0 {egg stage} 52.0 - 308.0 {young larvae} 308.0 - 380 {pupal stage} 380.0 - 505.0 {young - pre-ovipositing adults} 505.0 - 850 {older adults} Eggs / female / day = 2.5 or 0.241/dd
Female biased sex ratio = 10:1
α = proportion of plant
searched (see text)
Temperature threshold = 11.25°C
Cephalonomia stephanoderis
Betrem (Hymenoptera: Bety-lidae)
Host preference for oviposition:
prepupae and pupae Female biased sex ratio 3:1 Age in dd
0.0 - 52.0 {egg stage} 52.0 - 308.0 {larval stage} 308.0 - 390.0 {pupal stage} 390.0 - 1170.0 {adult stage} Host feeding demand =0.02 eggs per female per dd Oviposition rate = 0.1 eggs/ dd/female
Initial number of adults (1.0) Immigration rate = 0.1{adults/ plant/day}
α = search rate (see text) Temperature threshold = 13.7 °C
Prorops nasuta Waterston
(Hymenoptera: Bethylidae)
Host preference for oviposition: large larvae and pre pupae
Female biased sex ratio 3:1 Ages in dd
0.0 - 24.0 {egg stage} 24.0 - 126.0 {larval stage} 126.0 - 336.0 {pupal stage} 336.0 - 1000.0 {adult stage} Host feeding demand =0.02 eggs per female per dd Oviposition rate = 0.1 eggs/ dd/female
Initial number of adults (1.0) Immigration rate = 0.1 {adults/ plant/day}
α = search rate (see text) Temperature threshold = 13.7 °C
Phymastichus coffea LaSalle (Hymenoptera: Eulophidae)
Host preference for oviposition: pre-ovipositing adults
Female biased sex ratio 20:1 Ages in dd
0.0 - 36.0 {egg stage} 36.0 - 276.0 {larval stage} 276.0 - 324.0 {pupal stage} 324.0 - 370.0 {adult stage} No Host feeding demand
Oviposition rate = 0.56 {eggs/dd}
Initial number of adults (1.0) Immigration rate = 0.1{adults/ plant/day}
Immature
Developmental time 25-27 days 22.4 (Abraham et al.,1990) 23.20 (Abraham et al.,1990) 29.7 (Feldhege 1992) Maximum number per 30 3.7 in mass rearing (Portilla & 3.2 in mass rearing (Portilla
berry Bustillo, 1995) & Bustillo, 1995)
Notes: A parasitoids stays in a fruit until the As in P. nasuta, adults feed 2 to 11 Once a host is attacked it leaves brood matures. If no susceptible borer days before eggs mature. Adults the fruit to seek new hosts. stages at time of attack, parasitoid stays require 2 eggs or larvae, or two
and feed on borer eggs and young larvae adults per day to survive preserving older stages for future (Koch, 1973). parasitization.
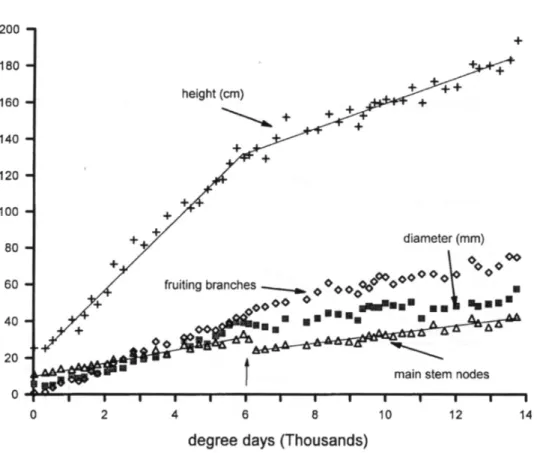
firming the internal consistency of the data. Among the relationships are: the ratios of leaf area to leaf mass (Fig. 5a, 3.7dm2: g); leaf mass
to green branch mass (Fig. 5b, 3.06 g: g); plant height to stem diameter (Fig. 5c, 1cm: 0.315 cm); root mass to stem mass (Fig. 5d, 0.375 g: g); and branch mass to stem volume (Fig. 5e, g: cm3). The strong relationship of fruit
mass to brown branch mass (1.1g: g, not shown) suggests that roughly two 0.55g ber-ries mature per g brown branch mass provid-ing a rough estimate of the fruit initiation rate. No significant relationship was found between fruit mass and leaf mass, leaf mass and total branch mass, or green branch and brown branch mass. This occurred because when one is growing the other is not, and/ or subunits such as leaves abscise. Last, we note that the
volume of stem increased monotonically with physiological time (Fig. 5f) with the slowing effects of fruit growth seen in the data. These allometric relationships provided important information to formulate the plant model.
not left to seek hosts. The number of old adults and the few killed by the fungal pathogen Beauveria bassiana (Bals.) Vuill. are shown in Fig. 6c.
The phenologies of borer life stages are shown in Fig. 7. Egg density increased to roughly 4.5 per berries (Fig. 7a) with the ob-served pattern being the net of eggs laid and losses due to mortality and hatching during the period between samples (see below). Most new adult borer leave the fruit on which they were reared, and this is verified by compar-ing their small numbers in the samples (<0.3 per berry, Fig. 7c) to the larger numbers of larval stages (Fig. 7b,c). A strong rela-tionship of old females (y) per berry to total females per berry (x) was found (y = -21.74 + 0.83x, r=0.95, n=59), but
only a weak relationship was found between new and old females (r=0.26).
In the absence of mortality, the number of egg (E) oviposited (Δe) in thirty berries dur-ing physiological time Δ t(t) at day t may be estimated as
DELeggs is the developmental time (dd) of the egg stage. The cumulative eggs laid is E(t) =E(t-Δ t) + Δ e(t). Similar methods can be used for the other life stages, but we caution that this simple estimation procedure is use-ful only when the mortality rate is small. Dis-tributed maturation time models with attrition are more appropriate for field studies (Fouque & Baumgärtner 1996).
A Systems Model for Coffee. Models of agri-cultural and other systems that have applica-tions to field problems have been classed as
engineering or demographic (Baumgärtner & Gutierrez 1989). Our model for coffee is a demographic model, and while it is far from a
one to one description of nature, it is biologi-cally rich. The early work of De Wit & Goudriaan (1978) and colleagues gave impe-tus to physiologically based modeling of crop growth and development, and indirectly in-fluenced our work and its extension to higher trophic levels (Gutierrez and Wang 1977).
The conceptual paradigm used assumes that all organisms are consumers (predators) in a general sense and all have the same prob-lems of resource acquisition and allocation. Across all species and trophic levels, similar type II functional response models are used for resource acquisition, while the metabolic
pool model is used to allocate resources to growth and reproduction (i.e., the numerical response). These models are described below. To avoid excessive citations, interested read-ers are referred to Gutierrez (1996) for a re-view of this approach applied to tritrophic systems.
Briefly, leaves seek light, roots seek nu-trients and water, and animals seek prey and other resources. All organism allocate re-sources in priority order to respiration, con-version costs of various kinds, reproduction if the organism is old enough and last to growth and reserves if resources remain after
satisfying all higher priority demands. A key element of the paradigm is that the ratio of the resource acquired (i.e., supply) to the maximum genetic assimilation rate (demand) (i.e., S/D) scales all growth birth death -aging rates from the maximum to the observed in all trophic levels. Shedding of excess fruit in plants and emigration rates in animals are related to the shortfall (1-S/D). The interplay of supply and demand is used at various lev-els (e.g., whole plant, branch and between competing sinks within a level). Computations of the S/D ratio are reviewed below.
The model simulates the dynamics of the whole plant, or with a simple Boolean instruc-tion the dynamics of each branch. Here the greater detail of branch level dynamics is de-veloped to accommodate future findings. The dynamics models for leaf, stem and root tissues are massage structured, while mass -number - age structured models are used for fruit (cf., Gutierrez & Wang 1977). Distrib-uted maturation time age-structured popula-tion dynamics models (Vansickle 1977) are used to describe the time varying mass - age dynamics of all species. DiCola et al. (1998) reviews these and other related models. All branching levels utilize the same code to up-date subunit dynamics. With minor modifica-tion, the same code is used to model animal population dynamics.
Modeling the Coffee Plant. Key determinants of branch photosynthetic rate are its leaf mass and position in the canopy. Branches in the upper levels have a greater chance of inter-cepting light energy (ϕ(t) = cal cm-2 day-1) than those lower down. The proportion of light captured by a branch (i) depends on its leaf area index (LAIi) defined as the ratio of leaf area to the area for plant growth (A =300 dm2). [2]
The constant c (=3.7 dm2g-1) converts leaf
mass ((Li(t)) to dm2 of leaf area.
To compute the proportion (ái(t)) of light reaching level i that is intercepted, we use Beers Law.
αi (t) = (1 - e-0.805 LaI(t)) [3]
The constant 0.805 is the efficiency of light interception. Light not intercepted by higher branches filters in decreasing quantities to lower branches with some striking the ground. If we assume there are n branch levels, then the LAI for the whole plant is
[4]
with the amount of light reaching the bot-Table 3. Regressions of six plant averages of different variables in the coffee data (n=56). ________________________________________________________________________ Leaf area (dm2) on leaf mass (grams)
leaf area = 3.75 leaf mass Leaf mass (g) on green wood mass (g)
leaf mass λ - 7.78 + 3.065 green branch mass r2 =0.964
Plant height (cm) on stem diameter (cm)
height = -4.17 + 0.315 diameter, r2 = -0.989
Root mass (g) on previous years stem mass (i.e., brown stem, g)
root mass = -29.37 +.375 stem mass r2 = -0.966
Main stem node numbers on plant height (cm)
nodes = -11.96 + 4.05 height r2 = -0.992
Fruit mass (g) on brown wood mass (g)
fruit mass = -61.11 + 1.104 brown wood mass r2 = -0.878
_______________________________________________________________________
LAI = cL (t)/ A
i i0 <
LAI = c
tot(
L t) / A
i( )
< 4.5
.i=1
tom or nth level ( ) being
From predation theory, this is the prob-ability of an initial quantity of light (prey)
escaping interception (predation) from a ries of branches (predators) acting in se-quence. Graf et al. (1990) used a similar ap-proach to compute the photosynthetic rate of rice in the face of competition from weeds of varying height.
Figure 5. Allometric plant growth relationships: (a.) leaf area to leaf mass, (b.) leaf mass to green wood, (c.) plant height to stem diameter, (d.) root mass to stem mass, (e.) branch mass to stem mass and (f.) stem volume on physiological time.
ϕ
nt
*
( )
= ϕ (t) ∏ [5]n-1 i=1
e-0.805LAIi(t ).
ϕ
nt
*
The amount of carbon fixed (Si= supply) at time t by the ith branch level, assuming all other factors are non limiting (see below), is computed using a variant of Watt’s (1959) functional response model
)
(
))
(
(
1
( ()) ()) ( )
( *
t
L
t
T
D
e
(t)
S
D T t L t i it c t
i
i i
i i
)
(
ϕ
α −
−
=
.[6] Light energy (
ϕ
i*( )
t
) reaching the top ofthe ith level (see [5]) is converted to g of
are additional costs that have a high priority and are met at the expense of vegetative growth (see below and Gutierrez 1996). In simpler notation, we write [6] as
Si(t)=hi (ui)Di(T(t))Li(t) [7] Rearranging terms,
is probability that branch level i obtains
resource demand level
D
i(
T
(
t
))
L
i(
t
)
. Shortfalls of other factors such as nitro-gen and water affect the photosynthetic rate, and their acquisition are modeled using an analogous form of [6] (see Gutierrez et al. 1988a, 1996). The root area index replaces total LAI and the plant area for growth is replaced by the root zone volume (6m3). Thedemand for nitrogen is proportional to the demand for carbon. A balance model follows Figure 7. The phenology of borer immature stages: (a.) eggs and old adult females, (b.) first and second stage larvae, and (c.) pupae and young adult females.
the uptake and depletion rates of inorganic soil nitrogen, the decomposition of organic matter to absorbable nitrates, fertilizer appli-cations and leeching. Reallocation of nitro-gen is assumed to occur from old leaves be-fore they are shed. Greater detail could be included but it was not necessary for our pur-poses.
The potential evapo-transpiration rate per plant (ET(t)) estimates the maximum demand for water at time t, and may be computed us-ing a biophysical model (e.g., Ritchie 1972 or other model). The water balance model budgets all inflows (rainfall) and outflows including transpiration, evaporation from the soil surface, and flow-through and runoff.
The compounding effects of nitrogen ((S/D)N) and water ((S/D)W) shortfalls are included at the whole plant level as the product of their supply-demand ratios (i.e.,
(Guti-errez et al. 1993), and applied at the branch level as follows:
S i
*(t) = ø(t)h
i(ui)Di(T(t))Li(t)
The ratio now in-cludes the effect nitrogen and water short-falls. Similar methods have proposed to in-corporate the shortfall effects of other essential resources in photosynthesis for plants and resource acquisition in animals (Gutierrez 1996).
Drymatter Allocation. In practice, resource acquisition and allocation occur simultane-ously, but for simplicity and clarity the model is presented here in discrete form. If is the photosynthetic rate of canopy level i at time t ([8]), it is allocated ([9]) in priority order to respiration , fruit growth (Ri) and last to vegetative growth (Gi) and re-serves (Vi).
ri(T(t) ) is the temperature dependent per unit mass metabolic cost rate by all non-woody tissues (Mi), and includes the Q10 rule for
res-piration as well as conversion and other costs. In general, when fruit demands are positive, fruit growth occurs at the expense of vegeta-tive growth. Some translocation of nutrients occurs between branching levels, hence S* includes a portion (5%) of available reserves. Allocation of nutrients to competing demands occurs as follows.
If fruit demands (DF) are larger than the supply minus respiration (0 > SF= S* - rM<D
F ), reserve accumulation and vegetative growth including the production of new flower buds, mainstem nodes and branches cease, and fruit grow at 0<SF/DF <1 times the maximum rate. In addition, fruit buds in which little invest-ment has been made, are aborted at a rate (1-S
F/DF <1). In coffee, buds are aborted early, but some shedding of older buds and berries may also occur (see Cure et al. 1998).
If, S
F >DF, then SF/DF =1 and maximum fruit growth occurs and the maximum vegeta-tive growth (see above) is scaled by 0<(Sv / Dv) = (SF -DF)/Dv<1).
This simple discrete model captures the essence of the branch level allocation proc-esses and in the aggregate the overall plant dynamics (Gutierrez & Wang 1977). The branch level S/D effects on fruit bud initia-tion rates and whole plant S/D effects on mainstem node and branch initiation are il-lustrated below.
Branch Fruiting Dynamics. Annually, flower buds (F) are initiated from the last year’s fruit wood (Wi, i.e., brown wood of age ca. 3000-8,000 dd) (Mestre and Ospina 1994). The realized bud initiation rate (
Δ
F
i(
W
i,
t
)
) at the ith mainstem node level at day t is0
(
011
.
0
=
))
(
(
⋅
⋅
Δ
⋅
≥
Δ
F
W
it
W
i(t)
t
S
v,i(t)/D
v,i(t))
.Buds are initiated at a rate 0.01 Wi dd-1
scaled by the time varying branch level veg-etative supply demand ratio (
S (t)/D (t)
v,i v,i ) over a 200 dd period. Branch reserves no doubt influences the budding rate, but data were not available, hence we used WI(t) as a surrogate.[8]
[9]
[10]
0< (t)=(S/D)n.(S/D) <1,)w
S
.i* ( )/ ( ( )) ( )
t D T t L t
i iS.i* ( )t
( ( ( ))r.i T t M.i)
R t G
.i( )+
.i( )+ ( )= ( )- ( ( ))
t V t S t r T t M
.i .i .i .iBranch Initiation. All branches are assumed to contribute to mainstem growth, hence the whole plant S/D ratio is used to scale the rate of new mainstem node and branch initiation. This ratio is computed from the sums of the components of the branch level vegetative S/ D ratios and is denotes by the subscript v out-side of the bracket ((S(t)/D(t))v). Under non-limiting conditions, new mainstem nodes (n) are initiated at the rate of one per 300 dd and branches (B) at one per 150dd . These values were observed before the first flowering cy-cle (see Fig. 3e). The effects of nutrient short-falls on mainstem node (
Δ
n
(
t
)
) and branch-ing ( ) rates at time t dur-ing Δ t(t) are modeled as follows..
In discrete form, the total number of mainstem nodes and branches time t+1 are
n(t + 1) = n(t) + n(t) - Xn(tx) B(t + 1) = B(t) + 2.0 . Δn(t) - XB(tx)
where Xn(tx) and XB(tx) are the number of nodes and branches lost at pruning at times specified by t=tx.
Some Additional Notes on S/D Effects. As plants become large, the S/D ratios of lower branches get progressively smaller causing branch growth and fruiting to slow. If the res-piration rate exceeds the photosynthetic rate, the branch is assumed to die. This is a natural outcome of the model and readily accounts for the observed decreasing fruitfulness of lower branches and of whole plants (Mestre & Ospina 1994).
Biotic and abiotic factors affect either the supply or the demand side of the S/D ratios, and influence plant phenology and growth. Defoliators affect leaf area and cause wound healing losses that affect the supply side of the ratio. Feeding on older leaves may reduce respiration relative to the reduction in
photosynthate production it causes. Feeding that opens up the canopy may result in a net increase in photosynthesis as light penetra-tion is increased. Increases in temperature in-crease the respiration rate affecting the demand, but low levels of solar radiation, water or soil nutrients decrease the supply. Factors that reduce fruit numbers reduce the demand side of the ratio and may increase vegetative growth. Similar supply-demand relations are used to model the interactions of higher trophic levels with their resources (Gutierrez & Wang 1977, Wang et al. 1977, Gutierrez 1996). Coffee berry borer is a pest of the standing crop, and does not decrease the de-mand or reduce the supply.
Modeling Coffee Berry Borer and Its Parasitoids. Biology of the Coffee Berry Borer. The borer may be viewed as a parasitoid seeking fruit (hosts) under condi-tions of time varying fruit abundance and pref-erence (Cure et al. 1998). A borer female at-tacks a single berry during its life time by bur-rowing into the calyx end (Montoya & Cárdenas. 1994, Fig. 1). Females may pen-etrate younger fruit, but gallery formation and oviposition are delayed until the seed coat begins to harden (late phase II or older ber-ries). Females may also attack non-preferred phase I fruit, but the fruit may be shed (Cure et al. 1998). Older fruit may be shed provid-ing an important refuge for borer between fruiting cycles.
At 22°C, the borer females produce two to three eggs day-1 for an average of 74.1 eggs
(range 31-111) over a 20 day oviposition pe-riod (Bergamin 1943). The preoviposition period is 5-10 days and the duration of the egg, larval and pupal stages are 8.6, 15.9 and 7.6 days respectively (Bergamin 1943). The average life span is 156.6 days (82-282 day range). Mating of new females normally oc-curs with a sibling male in the same fruit within 2-3 days of eclosion. The ratio of female to male progeny is roughly 10:1. Both females and males are diploid but males are function-ally haploid (pseudo-arrhenotokous, see Borsa & Kjellberg 1996). The lower threshold for
[12] [11]
[13]
S t B t
b( )= ( ) 1-
(
e
)
N t ab( , )(1-es .b
- ( ) ( )a t B t
,
B t( )
development is 11.25°C (Costa & Villacorta 1989). These data are summarized in Table 1.
The Borer Fruit Attack Model. The total number of uninfested berry (B) weighted for preference is
.
[14] The preference function 0<
ϑ
(a)≤1 is right skewed on fruit age (Cure et al. 1998, see Fig. 1). The number of previously attacked berries (subscript a) is
[15] The Fraser and Gilbert (1976) functional response model is used to estimate the number of uninfested fruit (Sb(t), [16]) attacked. This model is the integrated parasitoid form of Ivlev’s (1961) model that accounts for super-parasitism (it is related to Watt’s model, see Gutierrez 1996).
.
[16] Because a female attacks only one berry during its lifetime, the population demand rate equals the number of seeking females
...of physiological age as. The param-eter αb is the Nicholson & Bailey (1935) per capita search rate parameter. The attacks are allocated among the fruit age classes in a manner that reflects their abundance and pref-erence.
The dynamics model keeps track of both infested and uninfested berries. Infested ber-ries and the borer they host age physiologi-cally over time, but the rate of maturation of adult borers in very young fruits slow dramati-cally until the seed coat begins to form. To accommodate this biology, borer females that attack fruits enter cells of a two dimensional distributed maturation time model corre-sponding to the age of berry attacked (row) and their own age (column). New eggs enter the first cell of borer age (column) in the row (age) of fruit inhabited by the female. Borer
females and their progeny age along diagonal paths that depend on temperature and berry age (Stone & Gutierrez 1986, Gutierrez 1996). The model enables us to determine when infested fruits are sufficiently ripe for oviposition to occur, and to track borer ag-ing, reproduction and population age- and mass-structure in all age fruit on the tree or those that shed on the ground. This model provides a convenient structure for linking berry-borer-parasitoid(s) dynamics (see be-low).
The Biology of Coffee Berry Borer Parasitoids. The biologies of the bethylid parasitoids (Cephalonomia stephanoderis Betrem and Prorops nasuta Waterstam) are very similar (Orozco & Aristizábal 1996, see Tables 1, 2 for details). Both must first find fruit having borer infestations. The adult bethylid females are thought to attack borer in only one berry during their life time. Once a parasitoid female finds a fruit and enters it, it host feeds on eggs and young larvae and oviposits externally on large larvae and/or pupae. The parasitoid may also kill the adult borer. P. nasuta prefers to oviposit on large larvae and prepupae and C. stephanoderis prefers late larvae, pre-pupae and pupae. Both species have a female biased sex ratio (3:1). The developmental time of C. stephanoderis is 23.2 days and that of P. nasuta is 22.4. The lower thermal threshold of C. stephanoderis is 13.8°C and the upper one is below 37°C restricting it development in very hot regions. The same threshold is assumed for P. nasuta, but incorporating the correct one when it be-comes available is easy.
Feldhege (1992) and Infante et al. (1994) reviewed the biology of the eulophid adult-endoparasitoid (Phymastichus coffea La Salle). The parasitoid attacks borer adults in fruits before they have begun to oviposit. Average oviposition in the laboratory is 17 eggs over a two-day adult life span, but it is unlikely that this reproductive potential is met in the field. Two eggs are usually deposited per host, hence a female can potentially at-tack 8-9 borer adults in different berries
dur-B t
( )= ( ) ( , )
ò
J
a
B t
a
d
a
0.max
a
B t
( )=
ò
B t
( , )
a
d
a
0
.max
a
a a
ing its life. The egg to adult period is rela-tively long (29.7 days), but the female has no discernible preoviposition period. A thermal threshold for development of 13.8°C was also assumed for this species, and is an important missing parameter. A female biased sex ratio of 20:1was observed in the field (Feldhege 1992), but a 3:1 ratio has been reported from laboratory experiments (Feldhege 1992, In-fante et al. 1994). The consequences of both sex ratios were explored with the model.
The Parasitoid Attack Models. Parasitism is a two-stage process: Parasitoids must first find infested berries and only then can they attack borer life stages in them. The functional response models for the kth , (k= P.n., C.s., P.c.) parasitoid species finding borer in in-fested berries (Ba,k) of varying fruit and borer age preference are variants of [16].
[17] The search rates for C. stephanoderis and P. nasuta females (e.g., ) were as-sumed 0.6 and that for P. coffea is 0.15.
D
kis the per capita demand for berries by species k (see above). Information on borer density and age structure in each age class of fruit is read-ily available from the borer dynamics model, and provides estimates of parasitoid specific values for Ba,k in [17]. This is important ca-pacity as bethylid females enter an infested berry only after a gallery has been formed (late phase II and all phase III and IV and older fruit on the tree or on the ground) and in which borer reproduction is in full swing. In con-trast, the eulophid P. coffea attacks borer adults in berries before the beetles have made an extensive gallery or are waiting for the host berry to ripen sufficiently for oviposition to begin.After correcting for multiple parasitism, infested berries entered by each bethylid parasitoid are transferred to corresponding cells of similar parasitoid specific two-dimen-sional arrays where borer and parasitoid
ag-ing, reproduction as well as parasitoid host feeding are followed. Similar models are used for borer adults attacked by P. coffea and the parasitoids themselves. The age-structure of all species is easily estimated by the model. Competition between the bethylid parasitoids is symmetrical, but the inclusion of asymmetri-cal competition where one species is the con-sistent winner in cases of superparasitism is not difficult to compute using this system (Mills & Gutierrez 1996). Competition of the bethylids with the eulophid is indirect as the latter seeks only pre-ovipositing adult borer females.
Simulating the Plant Field Data. The plant model reproduced the observed drymatter data reasonably well (Fig. 8). The dry matter and number dynamics are regulated by the S/D ratios that respond not only to current weather conditions, but also to plant state variables, especially fruit growth dynamics The first brief period of flowering occurs at roughly 5500 dd (Fig. 3a, 8b). After flowering, each berry grow at a rate of 0.00003 g dd-1 for 1200
dd and then the rate increases 15 fold (0.0005 g dd-1) for a further 1400 dd (calculated from
Salazar et al. 1994). Although coffee berries are small they are numerous and their aggre-gate demand causes a shortfall in pho-tosynthate. When this stress occurred, allo-cation switched from vegetative growth to fruit growth (see below). Figure 8c depicts the whole plant vegetative and fruit S/D ra-tios. The similarity in pattern and magnitude of the two ratios occurs because some branches have a heavy fruit load and other a small one. The S/D ratios rise and fall as in-ternal allocation switching occurs. The number of fruit initiated is determined from the prior season’s branch growth scaled by the vegetative S/D ratio (see Fig. 8b, equation [10]). Fruit size is determined by the branch level S/D ratio. On average, berries achieve a mass of 0.55 g drymatter.
The effect of fruit induced stress is also seen in the slowing of branch production (Fig. 8c). The rate was approximately linear dur-ing the first 6000 dd, but declined as the whole
S (t =B
k)
a,k( )(1-
t
e
)
-ak( )t Ba,k( )t Dk
plant vegetative supply-demand ratio declined (Fig. 8c). As the first crop of berries matured, the branching rate and other forms of vegeta-tive growth increased until slowed by the sec-ond fruiting cycle at time 10,500. The time between the two cycles is roughly 5200 dd (see also Fig. 3). The predicted second cycle
of flowering is much larger than the first am-ply illustrating how vegetative growth in the prior season affects the number of flowers in the current season.
lation studies were made, but for brevity only the more important ones are illustrated. The conclusions of others are reported without supporting graphics or tables. In our study, coffee berries were not harvested and re-mained on the tree until shed. This is not the normal situation. Cleanup of berries remain-ing on the tree after harvest and on the ground is also practiced to increase the yield and to reduce an important breeding resource for borer between fruiting cycles.
Borer Alone. The simulations covered a five-year period yielding three distinct peaks for borer that correspond with a lag to three fruit-ing cycles (Fig. 9). A high immigration rate (0.5 borer adults per day per plant) assured an early high infestation.
The Effects of Parasitoids. The bethylid spe-cies singly (Fig. 10a) or in combination (Fig. 10b) had little impact on simulated borer populations despite high parasitoid immigra-tion rates relative to borer (0.25 parasitoids per plant per day versus 0.5 for borer), and high search rates (αC. s. = α P. n. =0.6). In com-bination, the patterns remained the same but borer egg numbers increased slightly due to interspecific competition. Poor control oc-curs because these species have a low numeri-cal response and each female attack borer in only one berry. Control of borer was little af-fected if the bethylid parasitoids were assumed to kill the borer female because its death lim-ited future parasitoid numerical response. In-creasing the immigration rate of the bethylid parasitoids was helpful, but control was not
achieved except at very high rates.
In contrast, simulations with the adult endoparasitoid P. coffea indicated marked
reductions of borer densities (Fig. 10c). This occurred despite a low search rate (αP.c. = 0.06) and an immigration rate a fifth that of the
bethylids. The predicted differences are dra-matic and likely accrued because P. coffea attacks borer early in the season, it kills the adult borer female before it reproduces, it has a very high female biased sex ratio, and it can attack several fruits per day. Predicted borer densities were reduced and percentage berry infestation rates were low in the first fruiting cycle, increased to 50 percent in the second cycle (Fig. 11) and decreased in the third cy-cle (not shown). Control of borer improved when C. stephanoderis and/or P. nasuta were combined with P. coffea (Fig. 10d,e)
Percentage Infested Berries. In the absence of harvesting, cleanup and parasitism, borer quickly infested most berries (Fig. 11). The addition of the parasitoid P. coffea to the sys-tem suppressed infestation levels in the first
fruiting cycle, but an outbreak to 45% oc-curred in the second cycle. An augmentative release of P. coffea per fruiting cycle proved disruptive and increased the percentage of infested berries (Fig.11).
C. stephanoderis is commonly used for inundative releases, hence the effects of two releases of 100 adult per plant 1000 dd apart during each fruiting cycle were evaluated.
In the absence of P. coffea, releases of C. stephanoderis reduced borer populations im-perceptibly as the benefits were quickly swamped by borer’s larger numerical response (not shown). The benefits of such releases would be greater at low borer densities be-cause of a higher prasitoid to host ratio. Re-leases of bethylids were most useful in com-bination with P. coffea as a decline in berry infestation was especially dramatic in the
ond fruiting cycle (Fig. 11).
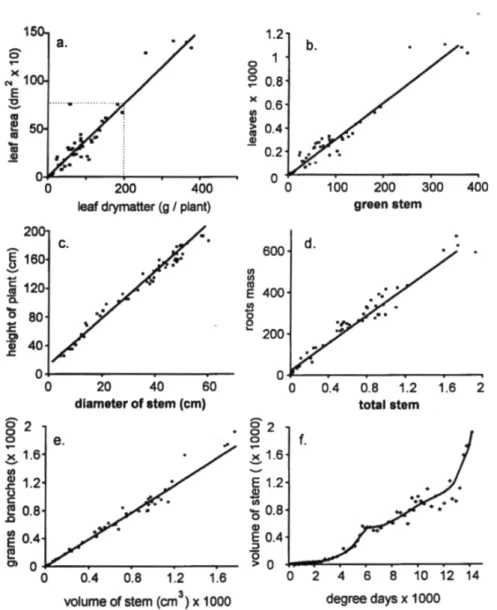
Agronomic Practices. Among the agronomic practices used to control borer are harvest-ing, cleanup of berries and pesticide use. The effects of these practices on the interaction of borer - P. coffea are reviewed below (Fig. 12). The interaction of borer and P. coffea will be
the standard treatment (Fig. 12a) to which the addition of agronomic factors will be com-pared.
Harvesting and cleanup occur at about the same time and in our simulation study are as-sumed to be 95% efficiency. In the absence of parasitism, harvesting and cleanup have little impact on high borer populations (not
shown) because: at harvest most berries are infested; the borer in them are near the end of their reproductive life; most adult progeny have emerged to seek uninfested berries; the remaining infested berries provide a large in-oculum for the next fruiting cycle.
In the presence of P. coffea, the added ef-fects of harvesting reduces peak borer populations at time 13,000 in Fig. 12a by ap-proximately 40 percent (not shown) but the population doubles in the second peak at time 20,000 (not shown). This occurs because har-vesting disrupts the parasitoid more than the borer. Borer populations, but not P. coffea, continue to build in shed fruit. Cleanup added to the effects of P. coffea lowers all borer peaks about 10% (not shown). This occurs because cleanup removes borer but has little impact on P. coffea. Combining harvesting and cleanup with P. coffea results in a substantial reduction of borer (Fig. 12a vs. 12b). The two agronomic practices complement each other by reducing borer numbers generally and eliminating most of the borer refuge in shed fruit.
An insecticide with a weak fumigant ac-tion is assumed to kill all free flying adults of all species. In addition, borer adults and the P. coffea life stages attacking them in shallow burrows are assumed killed. Borer sheltered deep within berries (and the bethylid parasitoids that attack them there) are assumed unaffected. In the absence of harvesting and cleanup, sprays applied at 1500dd intervals disrupt the regulatory power of P. coffea (Fig.12a vs. 12c) causing pest resurgence. Resurgence would be greater without the as-sumed background parasitoid immigration rate (not shown).
When a weak pesticide is combined with harvest, cleanup and P. coffea, the benefits of the cultural practices disappear (Fig. 12c vs. 12d). Insecticides having a strong systemic or fumigating action would increase control of borer (not shown), but may lead to pest resurgence, resistance and outbreaks of sec-ondary pests (van den Bosch 1978). These ef-fects are well known but are difficult to in-corporate reliably in our model because the
details of that biology are obscure.
Discussion
Despite considerable progress in develop-ing sound biologically rich tritrophic models, models are not meant to be a one to one de-scriptions of nature. Furthermore, simulation models are not predictive instruments, their strength is heuristic and are most useful when they help identify important issues not easily amenable to experimentation and when they identify important data gaps (see text). Simu-lation models are not suitable for developing optimal strategies because they require brute-force enumeration methods to obtain the so-lution (Gutierrez 1996, appendix 3). However, simulation is useful for exploring interrela-tions of factors and the potential efficacy of different control tactics. This is the approach taken in this study wherein some strategic pre-dictions arose.
In developing our coffee systems model, we used the metabolic pool paradigm that describes the processes of resource acquisi-tion and allocaacquisi-tion in all species cast in a mass-age-structured population context. The model captured the dynamics of coffee’s vegetative growth and fruiting dynamics under condi-tions of south central Brazil, but the model can be easily extended to other coffee grow-ing regions.
adults that have not formed deep galleries; it has a very high female biased sex ratio; it does not host feed; its progeny are produced in many fruits; and host adults are sterilized be-fore reproduction. We assumed that this parasitoid does not attack borer in shed ber-ries and it has a very low search rate com-pared to the bethylids. Despite this, P. coffea was potentially the superior parasitoid even when its female biased sex ratio was reduced from the 20:1 observed in the field to 3:1 ob-served in the laboratory.
Mitigating factors restricting the effective-ness of the bethylid parasitoids are: the adults can begin their activity only after borer infes-tations develop in ripening fruits; each female attacks borer in only one fruit; they must host feed on eggs and young larvae to produce eggs reducing their potential future numerical re-sponse; and they are ectoparasitoids of older life stages. The activity of the bethylid parasitoids begins fairly late in the fruiting cycle, and borer’s reproductive capacity and higher female biased sex ratio (10:1) easily overwhelm the parasitoids capacity to con-trol them. Bethylid females are thought to kill the adult beetle, but when does this occur and do some borer continue to reproduce? Simu-lation suggests that it does not matter all that much to the efficacy of the bethylid parasitoids.
Coffee berry quality would appear to suf-fer less when the borer are attacked by P. coffea compared to those attacked by the bethylid. In the first case, the beetles may not have formed deep galleries before being killed, and the berries may not be greatly af-fected. In contrast, bethylids usually attack thriving colonies of borer that have made ex-tensive galleries in berries, and hence berry quality must be lower and concerns about fun-gal toxins raised if these berries are processed. Inundative and augmentative releases of C. stephanoderis are widely promoted, but simulation results suggest that this strategy is appropriate for low level borer infestations. This tactic needs to be explored further in the field, and its efficacy compared to the cost of parasitoid production.
Harvest and cleanup of remaining berries on the plant and ground remove large num-bers of borer and parasitoids from the field creating a host free period that resets all populations at a much lower levels. In such cases, inoculative releases of parasitoids, es-pecially of P. coffea early in the fruiting cycle may prove profitable. Poor cleanup may leave a large inoculum of borer in shed fruits that results in high levels of infestation of fruits in the next fruiting cycle.
Insecticides that do not have a strong fu-migating or systemic action are likely not to be effective as they kill only adult borer and adult parasitoids seeking hosts. Such pesti-cides especially disrupt borer - P. coffea dy-namics because all life stages are relatively susceptible. In contrast, bethylid adults and immature stages sheltered within fruit are tively immune, but the parasitoids are rela-tively ineffective. Systemic or fumigant types of pesticides would be more effective in con-trolling borer but they could also adversely affect the action of the parasitoids resulting in pest resurgence, secondary outbreaks of other pests, and possibly resistance (van den Bosch 1978).
The use of pheromones was not explored fully, but pheromones for mating disruption would not be useful as borer is pseudo-arrhenotokous (the females mate with sibling male within the host fruit before emergence, Borsa & Kjellberg 1996). Pheromones that mask oviposition sites for borer or attract them to traps are a possibility that might profitably be explored.
is easily parameterized to simulate other vari-eties and species of pests and natural enemies. Weather and levels of edaphic factors drive the biological processes in the plant model making it independent of time and place. Similar time and place remarks apply to the models of the other species in the system. Together, these attributes make the model applicable to other coffee growing regions and other combinations of species throughout Latin America and elsewhere.
Acknowledgments
We wish to thank Drs. Peter Baker of CABI and L.T. Wilson of Texas A&M Uni-versity for useful comments. We extend spe-cially thank the field assistants of IAPAR, principally Ing. Agronomo Marcos Zorzenon Alteia, without whom this work could not have been accomplished. This field work was sup-ported by Instituto Agronômico do Paraná, Londrina, PR, Brasil via support to A. Villacorta. Model development and analysis was supported by the Center for Biological Control, University of California at Berkeley via funding to A. P. Gutierrez.
Literature Cited
Abraham, Y. J., D. Moore & G. Godwin. 1990. Rearing and aspects of biology of Cephalonomia stephanoderis and Prorops nasuta (Hymenoptera: Bethylidae) parasitoids of the coffee berry borer, Hypothenemus hampei (Coleoptera: Scolytidae). Bull. Ent. Res. 80 :121-128.
Aristizabal, A. L. F., P. S. Baker & J. H. Orozco. 1996. Liberacion, Dispersion y Parasitismo de Cephalonomia stephanoderis en condiciones de campo. Avances Técnicos. Cenicafé, Colombia, 224, 4 p.
Arcila, P. J., A.R. Jaramillo, R.V. Baldion & A.E.B. Pardey. 1993. La floracion del cafe y su relacion con el control de la
borer. Avances Técnicos. Cenicafé, Colombia, 193, 3 p.
Baker, P. S. 1984. Some aspects of the behaviour of the coffee berry borer in relation to its control in southern Mexico. ( Col. Scolytidae ). Folia Entomol. Mex. 61:9-24.
Barrera, J. F., P. S. Baker, A. Schwarz & J. Valenzuela. 1990a. Introduccion de dos species de parasitoides Africanos a Mexico para el control biologico de la broca del cafeto Hypothenemus hampei (Ferr.) (Coleoptera: Scolytidae ). Folia Entomol. Mexicana 79: 245-247.
Barrera, J. F., F. Infante, M. Vega, O. Gonzalez, E. Cabrillo, O. Campos, R. Munoz, A. Serrano, J. J. Osorto, B. Decazy & D. Moore. 1990b.
Introduccion de Cephalonomia stepha-noderus (Hymenoptera: Bethylidae) a Centroamerica para el control biologico de la broca del cafeto, Hypothenemus hampei (Coleoptera: Scolytidae). Turri-alba 40:570-574.
Barrera, J. F., J. Gomez, F. Infante, A. Castillo & W. de la Rosa. 1989. Biologie de Cephalonomia stephanoderus Betrem (Hymenoptera: Bethylidae) en labora-toire. I. Cycle biologique, capacité d’oviposition et emergence du fruit du caféier. Café-Cacao-The 33: 101-108.
Baumgärtner, J. U. & A. P. Gutierrez. 1989.
Simulation techniques applied to crop and pest models. Parasitis, Omni Expo, Barcelona, Spain.
Bergamin, J. 1943. Contribuição para o conhecimento da biologia da broca do café Hypothenmus hampei (Ferrari, 1867) (Col.: Ipidae). Arch. Inst. Biol. 14: 32-72.
pseudo-arrhenotokous insect, Hypothenemus hampei (Coleoptera: Scolytidae). Comptes Rendus de l’Academie des Sciences Serie III Sciences de la Vie 319: 1159-1166.
Cenicafe. 1990. Manual de capacitación en control biológico. Chinchiná. Cenicafé-CAB,. 174p.
Costa, T. C. S. & A. Villacorta. 1989.
Modelo acumulativo para Hypothenemus hampei ((Ferrari, 1867) (Coleoptera Scolytidae) com base em suas exigencias termicas. An. Soc. Entomol. Brasil 18: 90-97.
Cure, J. R., R. H. S. Santos, J. C. Moraes, E. F. Vilela & A. P. Gutierrez. 1998.
Fenologia e dinamica populacional da broca do cafeeiro Hypothenemus hampei Ferrari relacionada às fases de desen-volvimento do fruto. An. Soc. Entomol. Brasil, 27: 325-335.
DiCola, G., G. Gilioli & J. Baumgärtner. 1998. Age structure dynamics and models. In Ecological entomology, C.B. Huffaker & A.P. Gutierrez (ed.). John Wiley & Sons, New York (in press).
Feldhege, M. R. 1992. Rearing techniques and aspects of biology of Phymastichus coffea ( Hymenoptera: Eulophidae), a recently described endoparasitoid of the coffee berry borer, Hypothenemus hampei (Coleoptera: Scolytidae ). Café -Cacao -The 36: 45-54.
Fouque, F. & J. Baumgärtner, J. 1996.
Simulating development and survival of Aedes vexans (Diptera: Culicidae) preimaginal stages under field conditions. J. Med. Entomol. 33: 32-38.
Frazer, B.D. & N. Gilbert. 1976.
Coccinellids and aphids: a quantitative study of the impact of adult ladybirds (Coleoptera: Coccinellidae) preying on
field populations of pea aphids (Homoptera: Aphididae). J. Entomol. Soc. Brit. Colombia 73:33-56.
Gallo, D., O. Nakano, S. Silveira Neto, R. P. L. Carvalho, G. C. de Batista, E. Berti Filho. J. R. P. Parra, R. A. Zucchi & S. B. Alves. 1978. Manual de entomologia agricola. 2ed. Sao Paulo, Ed. Agronomica Ceres. 531 p.
Graf, B., A. P. Gutierrez, O. Rakotobe, P. Zahner & V. Delucchi. 1990. A simulation model for the dynamics of rice growth and development. II. Competition with weeds for nitrogen and light. Agric. Sys. 32: 367-392.
Gutierrez, A. P. 1996. Applied population ecology: A supply-demand approach. John Wiley and Sons. 300 p.
Gutierrez, A. P., P. Neuenschwander & J. J. M. van Alphen. 1993. Factors affecting biological control of cassava mealybug by exotic parasitoids: a ratio-dependent supply-demand driven model. J. Appl. Ecol. 30: 706-721.
Gutierrez, A. P., P. Neuenschwander, F. Schultess, H. R. Herren, J. U. Baumgärtner, B. Wermelinger, B. Löhr, & C.K. Ellis. 1988a. Analysis of the biological control of cassava pests in Africa. II. Cassava mealybug Phenacoccus manihoti. J. Appl. Ecol. 25: 921-940.
Gutierrez, A. P., B. Wermelinger, F. Schulthess, J. U. Baumgärtner, H. R. Herren, C. K. Ellis & J. S. Yaninek. 1988b. Analysis of biological control of cassava pests in Africa: I. Simulation of carbon nitrogen and water dynamics in cassava. J. Appl. Ecol. 25: 901-920.
Gutierrez, A. P. & Y. H. Wang. 1977.
Norton and C.S. Holling (eds.): Pest management, Pergamon Press, Oxford: International Institute for Applied Systems Analysis Proceedings Series.
Hempel, A. 1934. A Prorops nasuta Wa-terston no Brasil. Arq. Inst. Biol. São Paulo 5 :197-212.
Infante F., J. H. Luis, J. F. Barrera, J . Go-mez & A. Castillo. 1992. Thermal constants for preimaginal development of the parasitoid Cephalonomia stephano-deris Betrem (Hymenoptera: Bethylidae). Can. Entomol. 124: 935-941.
Infante, F. & J. H. Luis. 1993. Estadisticos demograficos de Cephalonomia ste-phanoderis Betrem (Hymentoptera: Bethylidae) a temperaturas constantes. Folia Entomol. Mex. 87:61-72.
Infante, F., S.T. Murphy, J. F. Barrera, J. W. de la Rosa Gomez & A. Damon. 1994. Cria de Phymastichus coffea parasitoide de la broca del cafe, y algunas notas sobre su historia de vida. South-western Entomol. 19:313-315.
Ivlev, V. S. 1961. Experimental ecology of the feeding of fishes. New Haven, Yale University Press.
Koch, V. J. M. 1973. Abondance de Hypote-nemus hampei Ferr. scolyte des graines de café en fonction da sa plante hote et de son parasite Cephalonomia stephano-deris Betrem en Cote d’Ivoire. Mede-dlingen Lanbouwhogeschool Wagening 73(16), 85 p.
Klein-Koch, C., O. Spinosa, A. Tandazo, P. Cisneros & D. Delgado. 1988. Fac-tores naturales de regulacion y controle biologico de la broca del cafe (Hypothe-nemus hampei Ferr.). San. Veg. 3:5-50.
Le Pelley, R. H. 1968. Pests of coffee. London, Longman, 590 p.
Loomis, R. S. & Williams, W. A. 1963.
Maximum crop productivity: an estimate. Crop Science 3, 67-72.
Mestre, M. A. & H. F. O. Ospina. 1994.
Estabilizacion de la produccion en las fincas cafeteras. Cenicafe Colombia 200: 2p.
Mills, N. J. & A. P. Gutierrez. 1996.
Prospective modeling in biological control: an analysis of the dynamics of heteronomous hyperparasitism in a cotton-whitefly-parasitoid system. J. Appl. Ecol. 33: 1379-1394.
Montoya, S. A. & M. R. Cárdenas. 1994.
Biologia de Hypothenemus hampei (Ferrari) en frutos de cafe de diferentes edades. Cenicafe Colombia 45: 5-13.
Nicholson, A. J. & V. A. Bailey. 1935. The balance of animal populations. Part 1. Proc. Zool. Soc. London 3: 551-598.
Oliveira Filho, M. L. de. 1927. Contribuição para o conhecimento de la broca do café Stephanoderes hampei (Ferrari, 1867). São Paulo, Sec. Agric. Com. Obr. Publ. 20, 9 p.
Orozco, H. J. & L. F. A. Aristizabal. 1996.
Parasitoides de origen Africano para el control de la broca del café. Cenicafe 223: 3p.
Portilla, M. & A. Bustillo. 1995. Nuevas investigaciones en la cría masiva de Hypothenemus hampei y de sus parasitoides Cephalonomia stephano-deris y Proprops nasuta. Rev. Colomb. Entomol. 21: 25-33.
Ritchie, J. T. 1972. Model for predicting evaporation from a row crop with incomplete cover. Water Resources Res. 8: 1204-1213.
Riano, P. J. Arcila & R. A. Jaramillo. 1994. Crecimiento del fruto de café Coffea arabica L. var. Colombia. Cenicafe 45:41-50.
Salazar, G. M. R., J. A. Pulgarin, N. M. R. Herrera & A. E. P. Bustillo. 1993.
Crecimiento y desarrollo del fruto de café y su relacion con la broca. Cenicafe 194. 2 p.
Stone, N. D. & A. P. Gutierrez. 1986. I. A field oriented simulation of pink bollworm in southwestern desert cotton. Hilgardia 54: 1-24.
Toledo, A. A. 1942. Notas sobre a biologia da vespa de Uganda Prorops nasuta Waterst (Hym.: Bethylidae.) no estado de São Paulo, Brasil. Arq. Inst. Biol. São Paulo 13: 233-260.
Toledo, A. A. S. Piza Jr. & E. J. P. da Fonseca. 1935. Heterospillus coffeicola Schemied parasita da “Broca do cafe”, Stephanoderis hampei (Ferr.). Arq. Inst.Biol. São Paulo 6:179-199.
Vansickle, J. 1977. Attrition in distributed delay models. IEEE Trans. Syst. Man Cyber. 7: 635-638.
van den Bosch, R. 1978. The Pesticide Conspiracy. Doubleday, New York.
Wang, Y., A. P. Gutierrez, G. Oster & R. Daxl. 1977. General population model for plant growth and development: coupling cotton-herbivore interactions. Can. Entomol. 109: 1359-1374.
Watt, K. E. F. 1959. A mathematical model for the effects of density of attacked and attacking species on the number attacked. Can. Entomol. 91: 129-144.
Wit, C.T. & J. Goudriaan. 1978. Simulation of ecological processes. (2nd ed. revised and extended). ISBN 90-220-0652-2. PRODOC Publishers, 183 pp.