ECOLOGY, BEHAVIOR AND BIONOMICS
The Importance of Beta Diversity in Local Gall-Inducing Arthropod
Distribution
ENRIQUE MEDIANERO
1, ALICIA IBÁÑEZ
2, JOSÉ L NIEVES-ALDREY
31Programa Centroamericano de Maestría en Entomología, Vicerrectoría de Investigación y Postgrado,
Univ de Panama, Panama; [email protected]; [email protected]
2Smithsonian Tropical Research Institute, Balboa, Republic of Panama, Panama; [email protected]
3Museo Nacional de Ciencias Naturales (CSIC), Depto Biodiversidad. C/José Gutiérrez Abascal 2, 28006 Madrid,
Spain; [email protected] Edited by Stephen Lapointe – USDA Neotropical Entomology 39(3):365-370 (2010)
ABSTRACT - Many studies over the past twenty years have documented the richness of arthropod galling species around the world, and some have proposed hypotheses to explain local and global patterns of galling species richness. However, few studies have been directed toward understanding how the gall-inducing species are locally distributed. The aim of this study was to determine the distribution of gall-inducing arthropods species at Coiba National Park, a tropical habitat on the Pacifi c coast of Panama. Our results suggest that more gall-inducing species had an aggregated distribution, and gall-inducing arthropod diversity shows a strong beta diversity component. Geographic distance was not correlated with similarity in gall-inducing species composition between the studied sites. This fact has important implications when trying to estimate gall-inducing arthropod richness and general patterns, and could cause contradictory results for hypotheses that attempt to explain the local and global patterns of galling species richness.
KEY WORDS: Coiba Island, geographic distribution, Panama, plant community
The induction of plant gall is the result of a complex association between insects and plants (Shorthouse et al 2005). Galls represent a complex series of interactions between the tissues of a plant and another living organism, more frequently an insect. The understanding of these interactions involves studies in many scientifi c fi elds, from systematics to ecology, but also morphology, physiology, biological control, evolutionary biology or agricultural and forest entomology (Mani 1964, Raman et al 2005). Gall-inducing species are excellent models for ecological studies due to their abundance, diversity and sessile habit, which make them easier to census than free-feeding herbivores and thus allowing species diversity comparisons among different habitats (Fernandes & Price 1988).
During the past twenty years, many studies have documented galling insect lists and galling species richness around the world (see Veldtman & McGeoch 2003, Raman et al 2005). There are also data regarding factors that affect local and regional gall richness and thus infer global patterns in local number of insect galling species (Raman et al 2005). However, few studies have been directed toward understanding how the gall-inducing species are locally distributed. Understanding spatial patterns of species distribution is a crucial topic in ecology and conservation biology; for instance, when predicting species richness from local to regional scales (Gering & Crist 2002).
The main proposed hypotheses explaining factors that affect local gall-inducing species richness involve hygrothermal stress, low soil fertility, host plant richness, structural complexity of host plants, host plant families and genus size and their range of distribution (for a complete discussion of each hypothesis see Veldtman & McGeoch 2003). However, most of the above hypotheses have caused controversy because many recent studies provide evidence against a given hypothesis while others support it (Wright & Samways 1998, Blanche 2000, Yukawa et al 2001, Veldtman & McGeoch 2003, Hanson & Goméz-Laurito 2005, Nieves-Aldrey et al 2008).
diversity (the variation in species composition amongsites in a geographic region) might have an important role in the regional diversity of species pools from large geographic areas (Gama diversity).
Beta diversity is an important property of ecosystems because it provides information about the partitioning of habitats by species and constitutes an empirical and theoretical link between Alpha (the local diversity of a community) and Gama diversity (Cornell & Lawton 1992). It captures a fundamental aspect of the spatial pattern of diversity, and its study is fundamental to understanding the geographic patterns of species richness (Whittaker 1972, Koleff 2005). Factors infl uencing species turnover among local fauna are usually a combination of environmental and geographical variables (i.e. geographic distance) (Borcard et al 1992), and determining their relative weighting is crucial for understanding the shaping of biogeographic patterns (Duivenvoorden et al 2002).
The aim of our study was to determine the distribution of gall-inducing arthropods species at Coiba National Park, a tropical island off the Pacifi c coast of Panama. Secondarily, we aimed to investigate the effect of geographic distance on species similarity between communities. In particular, the study addresses the following question: Is the beta component an important factor in gall-inducing species diversity?
Material and Methods
Study area. The research was performed at Coiba National Park (World Heritage Site), as part of the Joint Hispanic-Panamanian Program for National Parks. Coiba National Park comprises several islands in the Panamanian Pacifi c Ocean (7º 39´-7º 18´ N & 81º 53´-81º 35´W), 22 km from the mainland, and includes an area of 270,125 ha (53 582 ha are insular and 216,543 are marine). The insular area is composed of Coiba (50,314 ha), the largest island in tropical Pacifi c America, eight other minor islands and 30 islets. The maximum altitude in the Park is 420 m, found on Coiba Island, and the annual rainfall is 3,483 mm. The annual
average humidity is 80% with annual average temperature of 25oC. The area is characterized by an intense dry season
(December to April) and a rainy season (May to November). The original vegetation is well conserved, with about 80% forest coverage. An untouched tropical, moist and wet forest occupies 60% of the Park (Castroviejo 1997).
Sampling protocol. Field data were obtained from samplings between August 1997 and September 1999, during one study of seven plots (1 ha each one) of the vegetation of Coiba island (see Ibañez 2001), with three more intensive samplings (two-week long = 21 sampling) in August 1997, July 1998 and August 1999, with part of a preliminary census of fauna and fl ora of Coiba island (Castroviejo 1997). Seven sites representing the main terrestrial habitats and vegetation types on Coiba Island were surveyed: Cerro de la Equis, Estación Biológica, Isla Ranchería, Manglar de Santa Cruz, Manila, Playa Hermosa-Cerro de la Torre and Playa Blanca-Cativales (Table 1).
The sampling method used – 60 min census –, is one of the two methods used in the literature to estimate the local number of insect galling species in the world (see Price et al 1998). At each site, during no less than 1h, census was taken by carefully examining all plants while moving slowly through an area. Trails were commonly used as census routes because foliage was lower in the canopy at their edges, and they provided access through dense vegetation. Disturbance of vegetation, including trimming, increases the chances of
fi nding galls because many species attack rapidly growing shoots (Price et al 1998). Therefore, use of trails no doubt increased the rate of discovery of galling species, although the total species richness in a locale would be little affected because all species should be usually discovered well within the 1h sample time (Price et al 1998). According to Price et al (1998), this method is similar to sample a 10m-wide transect, wherein all plants are examined for gall above ground until 1,000 herbs, 100 shrubs, and 45 trees. Plants with galls were collected and photographed. Specimens of galled plants were dried and put into a herbarium collection, where plants were identifi ed at species level. Samples of the galls
Table 1 Geographic characteristics and habitat type of sampling sites at Coiba Nacional Park.
Sites Latitude Longitude Altitude Habitat Gall richness
(deg. N) (deg. W) (m) (morphotype number)
Cerro de la Equis 7º 37’ 14.27” 81º 44’ 27.91” 100-200 Mature forest 19
Playa Hermosa-Cerro de la
Torre 7º 31’ 59.88” 81º 47’ 59.99” 0-400 Mature forest 12
Manglar de Santa Cruz 7º 37’ 07.36” 81º 45’ 29.04” 0 Mature and secondary
forest 12
Manila 7º 22’ 08.96” 81º 45’ 01.44” 0 Mature forest and
coastal vegetation 9
Isla Ranchería 7º 38’ 18.56” 81º 42’ 10.89” 0-100 Mature, secondary forest
and coastal vegetation 5
Playa Blanca-Cativales 7º 22’ 09.85” 81º 40’ 02.33” 0 Secondary forest 4
Estación Biológica 7º 37’ 34.18” 81º43’ 43.50” 40 Secondary forest and
were also stored in 70% ethanol to allow further dissection and identifi cation. Altitude and geographic position were measured in the fi eld (Table 1). The galls were dissected in the laboratory for adult and larval identifi cation at the family level. The gall inducer species were sorted to morphotype based on external morphology of the galls, the larvae and the host plant. In accordance with Fernandes & Price (1988), we assumed that each morphotype of gall is unique for each gall-inducing species.
Data analysis. To verify sampling efficiency, we built rarefaction curves and a species distribution test was made with BioDiversity Professional Ver. 2 (McAleece 1997). In order to determine differences in gall-inducing arthropod species number for the seven sites and the distribution of each species, a Chi-square test for Goodness of fi t was made. The expected frequencies are those that we would hope to fi nd if the null hypothesis (Ho = 0) is true, given the total number of observations (Zar 1999).
The level of similarity between the seven sites sampled, based on presence of galls, was calculated using a multiple-site similarity measure (range = 0-1), according with Diserud & Ødegaard (2007):
Where aiis the number of species in site Ai, i = 1, …., T; aij is the number of species shared by sites A
i and Aj and aikjis the number of species shared by the sites Ai, A jand Ak, etc. Multiple-site similarity measures provide a more relevant index for a species’ spatial distribution. Instead of calculating the average over a set of dependent pairwise similarities, we use the information on the identity of species shared across more than two sites. For a given number of sites T, CT
Sdecreases with increasing number of “rare” species (i.e., species observed in only one or a few sites). Conversely, CT
S
increases with the increasing number of species observed in several sites (Diserud & Ødegaard 2007).
The Jaccard’s index was used in a cluster analysis to illustrate similarity patterns at the seven sites. We used a single link procedure, because in the algorithm, single linkage selects the shortest distance between sites.
A Mantel test was used to determine the correlation between the matrix of dissimilarity of the sites based on gall-inducing species presence and a matrix of geographic distance between the sites (10000 permutations). The Mantel test can be considered a “distance approach” because the input data are in the form of distance matrices, based on the raw data, and it has been extensively used throughout the ecological literature (Tuomisto & Ruokolainen 2006). We used the software XL-STAT (Addinsoft 2007) for this test.
Results
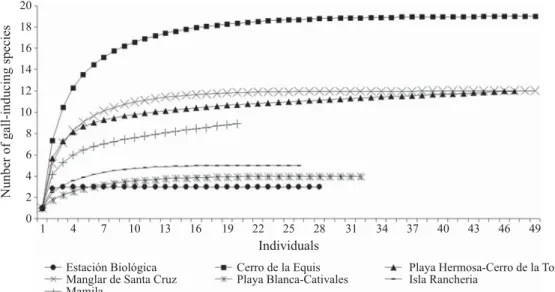
A total of 3,046 galls of 48 morphotypes (39 insects and nine mites), associated with 39 species of plants from 29 genera and 24 botanical families were collected at the seven sites. Most of the galls (62%) were induced by species of the family Cecidomyiidae (Diptera) and by Eriophyidae (Acari) (19%). The plant species with the greatest diversity of galls was Calophyllum longifolium (Clusiaceae) with three, seven species were found with two galls (Online Supplementary Material). Detailed information on the faunistic components of the gall-inducing arthropods of Coiba Island is given in Nieves-Aldrey et al (2008). Gall species richness per collecting site varied between three (at Estación Biológica) and 19 (at Cerro Equis; Table 1). Rarefaction curves suggest that all species were collected in fi ve out of the seven sites sampled (Fig 1).The distribution of the gall-inducing species was mainly (90%) aggregated at Coiba National Park (Online Supplementary Material). Estimates of gall-inducing arthropod species richness (Table 1), was significantly different among sites (χ2 = 21, 87, df = 6, P < 0.05).
Fig 1 Comparison of gall-inducing species richness (individual-based rarefaction curves) of the seven sampled sites. Curves suggest than in fi ve out of the seven sites sampled all gall-inducing arthropods were collected.
Nunber of gall-inducing species
Individuals
Estación Biológica Cerro de la Equis Playa Hermosa-Cerro de la Torre Manglar de Santa Cruz Playa Blanca-Cativales Isla Rancheria
Mamila 20
14
8 18
12
6
2 16
10
4
0
The multiple-similarity measures indicated that similarity in gall composition and community between collecting sites was generally low (0.292), even among proximate sites. The higher percentage of similarity (about 18%, Jaccard’s index), was found between the sites of Manglar de Santa Cruz, Cerro de la Equis, and Estación Biológica. The Playa Blanca-Cativales community is the most different from all other localities (Fig 2).
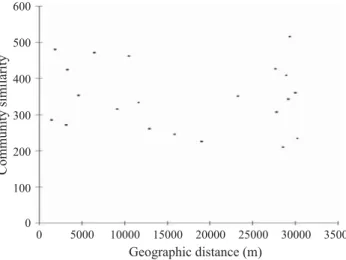
Mantel tests indicated that there are no correlations between the matrix of community dissimilarity and geographic distance (Pearson’s product-moment correlation r = -0.15, P > 0.05) (Fig 3).
Discussion
Patterns of the distribution of species diversity are the result of ecological, physical and historical factors across time and space (Hill & Hill 2001). In this study, the gall-inducing arthropod richness is the result of the complementarity among sites, which is refl ected in the low similarity values of the multiple-similarity index measures (0.292). This pattern is similar to patterns found in other neotropical areas. At four neotropical savannas (12 sampling sites) in Brazil, the highest similarity in gall-inducing insect communities was 0.117, (Gonçalves- Alvin & Fernandes 2001). At seven sampled sites in a tropical rain forest in Mexico, Cuevas-Reyes et al (2003) reported that 62% of the gall-inducing species found had restricted distributions. In mainland Panama, the gall-inducing insect community in two rain forest areas separated by 90 km shared two species (Medianero et al 2003). Turnover of gall-inducing species is also reported for vertical distribution; in a dry forest in Panama, of 50 gall-inducing insects collected, the canopy community shared just three species with the understorey community (separated by 40 m; Medianero et al 2003).
Our results suggest that beta diversity is a very important factor in local gall-inducing arthropod community
composition and that geographic distance is not correlated with similarity in gall-inducing species composition between the studied sites. According to Weis et al (1988), due to the fact that gall-inducing species are highly specialized (even at the level of plant organs) its presence in a site is determined by the presence, abundance, physiological and phenological status of its host plant. In tropical forests the plants species show a strong spatial and temporal pattern in the production of plant organs attacked by the gall-inducing arthropods, varying within the seasons and presenting frequent asynchronies in the phenological state of two individuals of the same plant species, which can be separated by a short distance (van Schaik et al 1993). Plant communities in tropical forests, particularity in Panamanian forests, show high beta diversity (Condit et al 2002, Duivenvoorden et al 2002) and as gall inducers are predominantly monophagous, it is very likely that the same effect will be observed for them. Additionally, the presence of “super hosts” (i.e., plant species that support a high richness of gall-inducing insects) is relatively common (Espírito-Santo & Fernandes 2007, Medianero et al 2007), and this can increase the gall-inducing species richness of a given locality independent of distance between sites.
Our results suggest that gall-inducing arthropod species distribution shows a strong infl uence of the component of beta diversity, so any estimate of gall-inducing species richness of a region should be made by means of intensive samplings, taking into account the spatial distribution of the vegetation and inducers, because geographical distance at the local level is not a determinant factor in their distribution.
Acknowledgments
Special thanks to Dr Santiago Castroviejo who was directly responsible for conceiving and initiating the Coiba Inventory Research Project and to O Diaserud for his help with the multiple-site similarity measure. Thanks to the Panamanian Authority of the Environment (ANAM) for
Fig 2 Cluster similitude (single linkage) of sampling sites for gall community distances. The higher percentage of similarity was found between the sites of Manglar de Santa Cruz, Cerro de la Equis, and Estación Biológica.
Fig 3 Scatter plot of pairwise Jaccard index (vertical axis) plotted against geographic between-site distances. Mantel tests indicate that there are no correlations between the matrix of community dissimilarity and geographic distance.
Estación Biológica
% similatity
0 50 100
Cerro de la Equis Playa Hermosa-Cerro de la Torre Manglar de Santa Cruz Playa Blanca-Cativales Isla Rancheria Mamila 600 300 0
0 5000 10000 15000 20000 25000 30000 35000 500
200 400
100
Community similarity
collecting permits. We thank all the staff of AECI in Panama and ANAM at the Biological Research Station of Coiba, as well as many colleagues from The Natural Sciences Museum and the Royal Botanical Garden in Madrid; their friendly help and support in several ways made this research possible. Enrique Medianero was supported by a scholarship granted by the Republic of Panama (IFARHU-SENACYT). This work was supported by the Spanish Agency of International Cooperation (AECI) and was also partially funded by a grant to JLNA from the research project DGES PB97-1241 of the Spanish Ministry of Education and Culture.
References
Addinsoft (2007) XLSTAT 2007 Data analysis and statistics software for Microsoft Excel. Paris, France.
Blanche K R (2000) Diversity of insect-induced gall along a temperature-rainfall gradient in the tropical savannah region of the Northern Territory, Australia. Austral Ecol 25: 311-318.
Blanche K R, Westoby M (1996) The effect of taxon and geographic range size of host eucalypt species on the species richness of gall-forming insects. Austral Ecol 21: 332-335.
Borcard D, Legendre P, Drapeau P (1992) Partialling out the spatial component of ecological variation. Ecology 73:1045-1055
Castroviejo S (1997) Introducción y consideraciones biogeográfi cas,
p.1-8. In Castroviejo S (ed) Flora y fauna del Parque Nacional Coiba (Panamá). Madrid, 534p.
Condit R, Pitman N, Leigh E G, Chave J, Terborgh J, Foster R B, Núñez P, Aguilar S, Valencia R, Villa G, Muller-Landau H C, Losos E, Hubbell S P (2002) Beta-diversity in tropical forest trees. Science 295: 666-669.
Cornell H V, Lawton J H (1992) Species interactions, local and regional processes, and limits to the richness of ecological communities: a theoretical perspective. J Anim Ecol 61: 1-12.
Cuevas-Reyes P, Siebe C, Martínez-Ramos M, Oyama K (2003) Species richness of gall-forming insects in a tropical rain forest: correlations with plant diversity and soil fertility. Biodivers Conserv 12: 411-422.
Dalbem RV, Mendonça M S (2006) Diversity of galling arthropods and host plants in a subtropical forest of Porto Alegre, Southern Brazil. Neotrop Entomol 35: 616-624.
Diserud O, Ødegaard F (2007) A multiple-site similarity measure. Biol Lett 3: 20-22.
Duivenvoorden J F, Svenning J C, Wright S J (2002) Beta diversity in tropical forests – response. Science 295: 636- 637.
Espírito-Santo M M, Fernandes G W (2007) How many species of gall-inducing insects are there on Earth, and Where are they.
Ann Entomol Soc Am100: 95-99.
Fernandes G W, Price P (1988) Biogeographical gradients in galling species richness: test of hypothesis. Oecologia 76: 161-167.
Gering J C, Crist T O (2002) The alpha-beta-regional relationship: providing new insight into local-regional patterns of species
richness and scale dependence of diversity components. Ecol Lett 5: 433-444.
Gonçalves-Alvim S J, Fernandes G W (2001) Biodiversity of galling insect: historical, community and habitat effects in four neotropical savannas. Biodivers Conserv 10: 79-98.
Hanson P E, Gomez-Laurito J (2005) Diversity of gall-inducing arthropods of Costa Rica, p.673-692. In Raman A, Schaefer C, Withers T (eds) Biology, ecology, and evolution of gall-inducing
Arthropods. India,Science Publishers, 817p.
Hill J L, Hill R A (2001) Why are tropical rainforests so species rich? Classifying, reviewing, and evaluating theories. Progr Phys Geogr 25: 326-354.
Ibáñez A (2001) Estudio de la composición fl orística y ecología del
bosque tropical de las isla de Coiba. Tesis Doctoral, Universidad de Salamanca, Salamanca, 230p.
Koleff P (2005) Conceptos y medidas de la diversidad beta, p.19-40.
In Halffer G, Soberón J, Koleff P, Melic A. (eds) El signifi cado
de las diversidades alfa, beta y gama. Zaragoza, Sociedad Entomológica Aragonesa, 242p.
Mani M S (1964) The ecology of plant galls. Dr. W. Junk Publishers, The Hague, 434p.
McAleece N (1997)Biodiversity Professional.Beta. Version 2.0.
The Natural History Museum and The Scottish Association For Marine Science.
Medianero E, Valderrama A, Barrios H (2003) Diversidad de insectos minadores de hojas y formadores de agallas en el dosel y sotobosque del bosque tropical. Acta Zool Mex Nueva Ser 89, 153: 168.
Medianero E, Parra L, Sánchez I, Nieves-Aldrey J L (2007) Agallas
inducidas por insectos en especies de Artemisia (Asteraceae)
en España, con especial referencia a la Comunidad de Madrid. Boln S E A 41: 291-302.
Nieves-Aldrey J L, Ibañez A, Medianero E (2008) Richness and composition of gall-inducing arthropods at Coiba National Park, Panama. Rev Biol Trop 56: 1269-1286.
Price P, Fernandes G W, Lara A C F, Brawn J, Barrios H, Wright M G, Ribeiro S, Rothcliff N (1998) Global patterns in local number of insects galling species. J Biogeogr 25: 581-591.
Raman A, Schaefer C W, Withers T M (2005) Galls and gall-inducing arthropods: an overview of their biology, ecology and evolution, p.1-33. In Raman A, Schaefer C, Withers T (eds) Biology, ecology, and evolution of gall-inducing Arthropods. India, Science Publishers, 817p.
Shorthouse J D, Wool D, Raman A (2005) Gall-inducing insects-
Nature’ most sophisticated herbivores. Basic Appl Ecol 6:
407-411.
Tuomisto H, Ruokolainen K (2006) Analyzing or explaing beta diversity? Understanding the targets of different methods of analysis. Ecology 87: 2697-2708.
van Schaik C P, Terborgh J, Wright S J (1993) The phenology
of tropical forest: adaptive signifi cance and consequences for
Veldtman R, McGeoch M A (2003) Gall-forming insect species richness along a non-scleromorphic vegetation rainfall gradient in South Africa: the importance of plant community composition. Austral Ecol 28: 1-13.
Weis A E, Walton R, Crego C L (1988) Reactive plant tissue sites
and population biology of gall makers. Annu Rev Entomol33:
467-486.
Whittaker R H (1972) Evolution and measurement of species
diversity. Taxon21: 213-251.
Wright M G, Samways M J (1998) Insect species richness tracking
plant species richness in a diverse fl ora: gall-insects in the Cape
Floristc Region, South Africa. Oecologia115: 427-433.
Yukawa J, Tokuda M, Uechi N, Sato S (2001) Species richness of galling arthropods in Manaus Amazon and the surroundings of the Iguassu Falls. Esakia 41: 11-15.
Zar J (1999) Biostatistical analysis. New Jersey, Prentice-Hall, 663p.
Entomol 39(3): 365-370.
Distribution type and host plant species of each gall-inducing species found in seven sites at Coiba National Park (d. f. = 6).
Continue
Gall-inducing Host plant species Chi-square Probability Distribution
Cecidomyiidae sp. 1 Amphitecna latifolia 66.00 0.00 Aggregated
Cecidomyiidae sp. 2 Licania hypoleuca 456.00 0.00 Aggregated
Cecidomyiidae sp. 3 Terminalia amazonia 450.00 0.00 Aggregated
Cecidomyiidae sp. 4 Croton schiedeanus 204.00 0.00 Aggregated
Cecidomyiidae sp. 5 Manihot esculenta 108.00 0.00 Aggregated
Cecidomyiidae sp. 6 Casearia commersoniana 48.00 0.00 Aggregated
Cecidomyiidae sp. 7 Casearia commersoniana 12.00 0.06 Random
Cecidomyiidae sp. 8 Calophyllum longifolium 313.67 0.00 Aggregated
Cecidomyiidae sp. 9 Calophyllum longifolium 786.00 0.00 Aggregated
Cecidomyiidae sp. 10 Lacistema aggregatum 168.00 0.00 Aggregated
Cecidomyiidae sp. 11 Lacistema aggregatum 24.00 0.00 Aggregated
Cecidomyiidae sp. 12 Inga multijuga 540.00 0.00 Aggregated
Cecidomyiidae sp. 13 Prioria copaifera 1758.00 0.00 Aggregated
Cecidomyiidae sp. 14 Cydista aequinoctialis 211.41 0.00 Aggregated
Cecidomyiidae sp. 15 Ficus popenoei 234.00 0.00 Aggregated
Cecidomyiidae sp. 16 Virola sp. 708.00 0.00 Aggregated
Cecidomyiidae sp. 17 Ardisia sp. 102.00 0.00 Aggregated
Cecidomyiidae sp. 18 Myrtaceae sp. 1 126.00 0.00 Aggregated
Cecidomyiidae sp. 19 Mansoa sp. 60.00 0.00 Aggregated
Cecidomyiidae sp. 20 Myrtaceae sp. 2 6.00 0.42 Random
Cecidomyiidae sp. 21 Myrtaceae sp. 3 6.00 0.42 Random
Cecidomyiidae sp. 22 Neea sp. 152.10 0.00 Aggregated
Cecidomyiidae sp. 23 Ouratea lucens 69.33 0.00 Aggregated
Cecidomyiidae sp. 24 Cassipourea elliptica 78.00 0.00 Aggregated
Cecidomyiidae sp. 25 Mansoa sp. 42.00 0.00 Aggregated
Cecidomyiidae sp. 26 Faramea occidentalis 42.71 0.00 Aggregated
Cecidomyiidae sp. 27 Psychotria horizontalis 293.50 0.00 Aggregated
Cecidomyiidae sp. 28 Pouteria cf. foveolata 396.07 0.00 Aggregated
Cecidomyiidae sp. 29 Pouteria cf. foveolata 181.75 0.00 Aggregated
Cecidomyiidae sp. 30 Maytenus schippi 120.00 0.00 Aggregated
Coccidae sp. 1 Amphitecna latifolia 60.00 0.00 Aggregated
Coccidae sp. 2 Myrtaceae sp. 4 486.00 0.00 Aggregated
Coccidae sp. 3 Pelliciera rhizophorae 2310.00 0.00 Aggregated
Coccidae sp. 4 Cassipourea elliptica 138.00 0.00 Aggregated
Eriophyidae sp. 1 Acalypha diversifolia 6.00 0.42 Random
Eriophyidae sp. 2 Acalypha diversifolia 461.45 0.00 Aggregated
Eriophyidae sp. 3 Calophyllum longifolium 216.00 0.00 Aggregated
Eriophyidae sp. 4 Clidemia discolor 120.00 0.00 Aggregated
Eriophyidae sp. 6 Miconia lacera 132.00 0.00 Aggregated
Eriophyidae sp. 7 Miconia minutiflora 500.00 0.00 Aggregated
Eriophyidae sp. 8 Myrtaceae sp. 5 804.00 0.00 Aggregated
Eriophyidae sp. 9 Cissus microcarpa 144.00 0.00 Aggregated
Phlaeotripidae sp. 1 Asteraceae sp. 1 114.00 0.00 Aggregated
Phlaeotripidae sp. 2 Myrtaceae sp. 6 6.00 0.42 Random
Psyllidae sp. 1 Cinnamomum triplinerve 845.49 0.00 Aggregated
Psyllidae sp. 2 Tetragastris panamensis 186.00 0.00 Aggregated