Expansion of morbidity: trends in healthy life expectancy of the
elderly population
ALESSANDRO GONÇALVES CAMPOLINA1*, FERNANDO ADAMI2, JAIR LICIO FERREIRA SANTOS3, MARIA LUCIA LEBRÃO4
1Center for Translational Research in Oncology, Institute of Cancer of São Paulo, Faculty of Medicine, University of São Paulo (FMUSP), Brazil.
2Department of Collective Health. ABC Medical School. Santo André, SP, Brazil.
3Department of Social Medicine. Medicine School of Ribeirão Preto, University of São Paulo, Ribeirão Preto, SP, Brazil.
4Department of Epidemiology. Faculty of Public Health, University of São Paulo, São Paulo, SP, Brazil.
SUMMARY
Study conducted at the Faculty of Public Health, University of São Paulo, São Paulo, SP, Brazil
Article received: 11/20/2013
Accepted for publication: 1/30/2014
*Correspondence:
Address: Av. Dr. Arnaldo, 251, 8o andar
Cerqueira César Postal Code: 01246-000 São Paulo, SP – Brazil Phone: +55 11 3893-3550 Fax: +55 11 3893-3024 [email protected]
http://dx.doi.org/10.1590/1806-9282.60.05.011
Conflict of interest: none
Objective: to analyze the changes in life expectancy (LE) and disability-free life expectancy (DFLE) in São Paulo’s elderly population to assess the occurrence of compression or expansion of morbidity, between 2000 and 2010.
Methods: cross-sectional and population survey, based on official data for the city of São Paulo, Brazil, and data obtained from the Health, Well-Being and Aging Survey (SABE). Functional disability was defined as difficulty in perfor-ming at least one basic activity of daily living. The Sullivan method was used to calculate LE and DFLE for the years 2000 to 2010.
Results: from 2000 to 2010, there was an increase in disabled life expectancy (DLE) in all age groups and both sexes. The proportion of years of life free of di-sability, at 60 years of age, decreased from 57.94% to 46.23% in women, and from 75.34% to 63.65% in men. At 75 years of age, this ratio decreased from 47.55% to 34.54% in women, and from 61.31% to 56.01% in men.
Conclusion: the expansion of morbidity is an ongoing process in the elderly po-pulation of the municipality of São Paulo, in the period of 2000-2010. These re-sults can contribute to the development of preventive strategies and planning of adequate health services to future generations of seniors.
Keywords: life expectancy, active life expectancy, life tables, morbidity, elderly.
I
NTRODUCTIONBrazil is a country that has had one of the fastest popu-lation aging processes in recent times. The proportion of elderly (aged ≥ 60 years) increased from 4.6% in 1950 to 8.7% in 2010.1 In 2050, Brazil will be one of six countries with the highest proportion of elderly individuals (ap-proximately 60 million).1
As aging is associated with increased prevalence of chronic diseases, it is essential to investigate under what conditions the years gained with increased life expectancy of the Brazilian population will be lived, in order to con-tribute to the knowledge of the needs of the elderly and provide data for the allocation of health resources and planning of public policies.2
Therefore, three hypotheses were formulated in order to discuss the effect of changing patterns of morbidity and mortality in the health status of the populations.3,4
The first hypothesis is known as the compression of morbidity, and suggests that life expectancy has reached adult biological limits. As a result, if the incidence of
di-sabling diseases can be extended, morbidity will then be compressed to a shorter period of time.5,6
The second hypothesis proposes that the decline in mortality derives from a reduction in the case fatality ra-tes of diseases and not from reductions in their inciden-ce or progression. Thus, the decline in mortality is accom-panied by an increase in the number of people with chronic disease and disability.7
The third hypothesis states that the decline in mor-tality is partly due to the decline in disease lethality, but at the same time the incidence and progression of chro-nic diseases should fall, leading to a dynamic equilibrium. According to this idea, the years with severe morbidity
and disability remain relatively constant, since medical interventions and changes in lifestyle reduce the rate of progression of chronic diseases.8
can expect to live healthy11 and can be used to assess the occurrence of compression of morbidity in a population.12 Indicators of healthy life expectancy, such as disability--free life expectancy (DFLE), can provide information not only on the prevalence of functional disability, but also on the potential duration of disability and the time du-ring which a given population will need health care.13
In Brazil, a few studies have evaluated the healthy life expectancy of the general population and the elderly po-pulation. In 2005, Romero and colleagues evaluated the healthy life expectancy of the population, based on infor-mation obtained from the database of the Brazilian Cen-sus Bureau (IBGE), using two approaches: one from the self-assessment of health status and the other based on the self-assessment of limitations in activities of daily li-ving. The authors showed that both approaches showed very similar estimates, particularly in populations with older age and the proportion of lost years of healthy life is more important in women.14
Also in 2005, Camargo and colleagues used a databa-se of 2000 belonging to the Health, Well-Being and Aging (SABE) survey and, by assessing the life expectancy with functional disability in elderly individuals in São Paulo, they showed that, although older women in this city pre-sented higher life expectancy compared to men, the pro-portion of years lived free of disability was lower.15
In 2009, Camargos and colleagues, using the self-per-ception of health status, categorized into good or bad, as a measure of health status in older individuals using in-formation obtained from the National Survey by Hou-sehold Sampling (PNAD) of 2003, estimated a healthy life expectancy for the Brazilian population aged 60 years and older. The estimates also revealed that women live longer, but the number of years they live with a perception of poor health is greater than the estimate for older men.16
In 2011, another study based on the SABE survey and which used longitudinal data reinforced the stronger im-pact of disability in females, evidenced by the higher life expectancy of women with disabilities.17
Given that in the Brazilian context the time trends of healthy life expectancy in the elderly population haven’t been evaluated yet, indicators such as disability-free life expectancy (DFLE) may provide key information for the planning of health care in this population.
The aim of this study is to analyze the changes in life expectancy and disability-free life expectancy in elderly individuals living in São Paulo, from 2000 to 2010, ba-sed on the SABE survey, in order to evaluate the occur-rence of compression or expansion morbidity in this po-pulation.
M
ETHODSStudy design and sampling
Repeated cross-sectional study using data from SABE sur-vey - Health, Well-Being and Aging, which constitutes a population-based survey aimed to assess the living con-ditions of the elderly in seven cities of Latin America and the Caribbean (Argentina, Barbados, Brazil, Chile, Cuba, Mexico and Uruguay).18
In Brazil, the SABE survey was initiated in 2000 in São Paulo’s metropolitan area, including 2143 elderly individuals aged 60 years or older of both genders. The sampling was random and representative of the elderly population in São Paulo in 1996, which totaled 836,223.19 The sample was initially composed of 1568 individuals, being extended to 2143 in order to increase the number of male seniors aged 75 years or older, due to the higher mortality rate in this age group and gender.20 To obtain the desired number of elderly individuals, we defined the minimum number of 5882 households to be ran-d o m l y s e l e c t e ran-d a c c o r ran-d i n g t o t h e e x p r e s s i o n [d=(1500*10/3)/0.85], where d is the lowest number of households being selected; 1500, the lowest number of elderly individuals to enable the desired analyses; the 10/3 ration being 3 elderly for every 10 households; and 0.85, the expected rate of success for locating and inter-viewing in the selected households.20
For the random selection of households, we used a two-staged cluster sampling, selected by a criterion of dis-tribution proportional to size:
• First stage – for sampling this stage, the permanent re-cords of 72 census segments in the National Survey by Household Sampling (PNAD) of 1995 were used, cal-culated as f1=(72*Di)/D, where f1 is the sampling frac-tion of this stage, Di is the number of households in each segment; and D is the total number of households in the city of São Paulo.
• Second stage – to sample this stage, the number of households to be randomly selected was calculated, according to the number of census segments (5882/72=81.69, approximate value used is 90), de-fined by f2=90/Di, based on the use of addresses, ac-cording to the PNAD of 1998.
The probability of a household belonging to the selected sample was defined as f=f1*f2. In the selected households, 1852 eligible elderly were identified, of whom 1568 agreed
to participate in the study (84.67%).
the selected areas or, at most, within the boundaries of the districts of the selected areas.
To adjust the distribution of the sample to the com-position of the population, weights were calculated for each sex and age group. To compensate for unequal pro-babilities of random selection in the second stage due to updating address lists for the 1998 PNAD, weights were calculated for each census segment.
A detailed description of the methods employed in the SABE survey can be found in the book O Projeto SABE no Município de São Paulo: uma abordagem inicial [available from http://www.fsp.usp.br/sabe].
In 2010, a new sample for the SABE survey was per-formed including 907 individuals of both genders, aged ≥ 60 years. The details of the methods employed are des-cribed in other publications.17, 18
Data collection
Data were collected through a questionnaire prepared by a regional committee, composed of leading researchers from each participating country and experts in specific research topics. The instrument consists of eleven sections covering aspects of daily life of the elderly: personal data, cognitive assessment, health status, functional status, medications, use of and access to services, network of family and social support, employment history and income sources, housing characteristics, anthropometry, flexibility and mobility.
The interviews were conducted at home, in the years 2000 and 2001 (the 2000 cohort) and in the years 2010, 2011 and 2012 (the 2010 cohort). Where there was dif-ficulty or impossibility of the elderly to respond (due to physical or cognitive problems), the participation of so-meone close was requested.17,21
Selected variables
Among the sociodemographic variables, the following were considered: age, gender, living arrangements, mari-tal status, ethnicity, education and income, based on re-levant scientific literature.22, 23
Age was measured continuously, and categorized as 60-64 years, 65-69 years, 70-74 years, 75-79 years and 80 years and older. The family arrangement was classified as living alone or not living alone. With regard to education, information was collected and categorized as: no formal education, primary school, high school, or undergradua-te/graduate education. Marital status was categorized into: single, married/common-law partner, widowed, or divorced/separated. The employment status was classi-fied as currently employed or unemployed.
Functional disability was defined as difficulty in per-forming one or more activities of daily living, including:
getting dressed, eating, bathing, toileting, walking around, fecal and/or urinary incontinence, based on a validated questionnaire already used in other publications.15,17, 24
Statistical Analysis and Ethical Aspects
Abridged life tables for the interval beginning with 60 years of age were calculated for the years 2000 and 2010 based on mortality and morbidity information10 and fol-lowing steps described in demographics manuals,25 ac-cording to the Sullivan method.10
The information required for the application of the Sullivan method is: specific mortality rates for a given po-pulation to allow the construction of a life table and the prevalence of health states (disability) according to age.14
To calculate the disability-free life expectancy (DFLE), the following applied:
The acronyms used were in accordance with the interna-tional notation, meaning:
lx = number of survivors at age x in the hypothetical cohort of the table; YWD = number of years lived without disability; DFLEx = sum of years lived without disability for ages x and over, divided by lx.
The elderly population estimated for mid-year 2000 and mid-2010 was obtained from the censuses of 2000 and 2010, as well as information on deaths in the elderly po-pulation, gathered from Fundação Sistema Estadual de Análise de Dados.26
In analyzes involving inference from the sample, the information from each individual were weighted by the inverse of the sampling fraction, with corrections for stra-tification and non-response.
The weights resulting from the sample design, i.e. the inverse of the sampling fractions, were adjusted in order to represent the population of the municipality by post--stratification. The weight of each individual indicates how many inhabitants in the city it represents, and thus the estimates of means and proportions are weighted to represent population estimates.
4. Absolute expansion and relative expansion of mor-bidity: there is an increase in disabled life expectancy (DLE) and a decrease in percentage of disability-free life expectancy (DFLE) in the overall life expectancy (LE).
R
ESULTSIn 2000, we evaluated 2,143 elderly (response rate 84.6%), 58.6% being female. In 2010, 907 individuals (response rate 91.6%) were assessed, 64.6% being female.
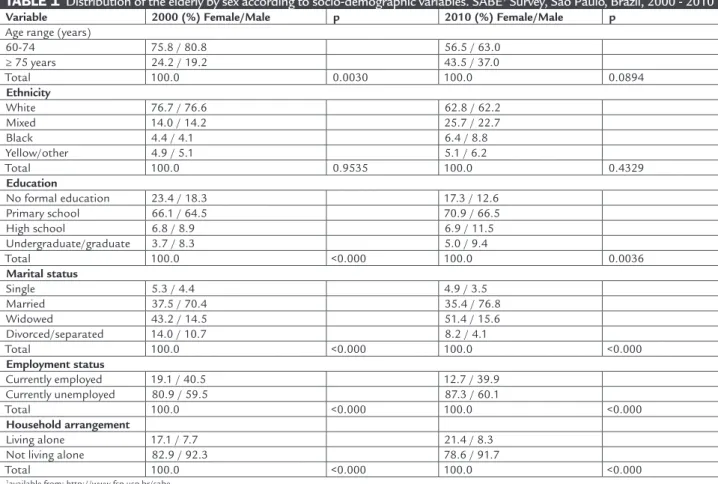
According to Table 1, in 2000, the percentage of wo-men in the age group of 75 years or more was higher than that of men. In 2010, however, the difference in the distribution of the elderly by gender was not signi-ficant. Regarding ethnicity, there was a higher percen-tage of whites, both among men and women. In terms of education, a higher percentage of men had gradua-ted from high school and college, in 2000 and 2010. Wi-dowhood was more prevalent among women than men, also with a higher percentage of single women. We found a higher percentage of men working at the time of the study and women who lived alone, both in 2000 and 2010 (Table 1).
The research project was submitted to the respective ethics committees of the countries involved. In Brazil, the project was approved by the Ethics Committee on Hu-man Research of the Faculty of Public Health, University of São Paulo (COEP Notice 67/99 and COEP Notice 83/06 – Research Protocol no. 1345).
Data interpretation
Changes in expectations of healthy life were classified into four possible situations:12
1. Absolute compression and relative compression of mor-bidity: there is a decrease in disabled life expectancy (DLE) and an increase in percentage of disability-free life expectancy (DFLE) in the overall life expectancy (LE).
2. Absolute compression and relative expansion of mor-bidity: there is a decrease in disabled life expectancy (DLE) and a decrease in percentage of disability-free life expectancy (DFLE) in the overall life expectancy (LE).
3. Absolute expansion and relative compression of mor-bidity: there is an increase in disabled life expectancy (DLE) and an increase in percentage of disability-free life expectancy (DFLE) in the overall life expectancy (LE).
TABLE 1 Distribution of the elderly by sex according to socio-demographic variables. SABE1 Survey, São Paulo, Brazil, 2000 - 2010
Variable 2000 (%) Female/Male p 2010 (%) Female/Male p
Age range (years)
60-74 75.8 / 80.8 56.5 / 63.0
≥ 75 years 24.2 / 19.2 43.5 / 37.0
Total 100.0 0.0030 100.0 0.0894
Ethnicity
White 76.7 / 76.6 62.8 / 62.2
Mixed 14.0 / 14.2 25.7 / 22.7
Black 4.4 / 4.1 6.4 / 8.8
Yellow/other 4.9 / 5.1 5.1 / 6.2
Total 100.0 0.9535 100.0 0.4329
Education
No formal education 23.4 / 18.3 17.3 / 12.6
Primary school 66.1 / 64.5 70.9 / 66.5
High school 6.8 / 8.9 6.9 / 11.5
Undergraduate/graduate 3.7 / 8.3 5.0 / 9.4
Total 100.0 <0.000 100.0 0.0036
Marital status
Single 5.3 / 4.4 4.9 / 3.5
Married 37.5 / 70.4 35.4 / 76.8
Widowed 43.2 / 14.5 51.4 / 15.6
Divorced/separated 14.0 / 10.7 8.2 / 4.1
Total 100.0 <0.000 100.0 <0.000
Employment status
Currently employed 19.1 / 40.5 12.7 / 39.9
Currently unemployed 80.9 / 59.5 87.3 / 60.1
Total 100.0 <0.000 100.0 <0.000
Household arrangement
Living alone 17.1 / 7.7 21.4 / 8.3
Not living alone 82.9 / 92.3 78.6 / 91.7
Total 100.0 <0.000 100.0 <0.000
Table 2 shows the prevalence of disability according to age group. In general, there is a higher prevalence of di-sability with increasing age. The percentages of didi-sability were higher in 2010 (Table 2).
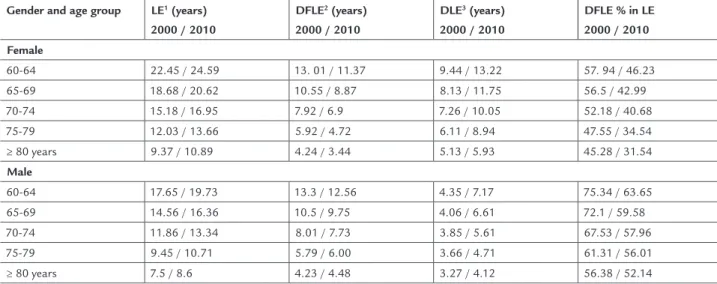
Table 3 presents, among elderly women and men, the values for life expectancy (LE), disability-free life expec-tancy (DFLE), disabled life expecexpec-tancy (DLE) and propor-tion of years to be lived free of disability (DFLE % in LE).
In both genders, we observe an increase in DFLE in all age groups from 2000 to 2010. A decrease in DFLE % is also observed in LE, both among females and males, in all age groups (Table 3).
D
ISCUSSIONThe results showed that variations in disabled life expec-tancy and the proportion of years to be lived free of disa-bility reveal a process of absolute and relative expansion
of morbidity (increase in DLE and decrease in DFLE per-centage in overall LE) in progress among the elderly in the city of São Paulo between 2000 and 2010.
Historically, increased LE is accompanied by impro-vements in the population’s health status. Today, howe-ver, this phenomenon no longer necessarily occurs in terms of overall impact on the morbidity of a population, because chronic diseases progressively replaced acute ill-nesses. Thus, the risk of illness is not only linked to the risk of dying, but also the risk of becoming disabled.27 In this context, the time trends of LE and DFLE, conside-red together, can help to answer questions relating to po-pulation dynamics in terms of morbidity compression, expansion or balance.
Time series based on data from countries with low mortality rates (Western Europe, Nordic Countries, North America, Australia, Japan and New Zealand), covering a
TABLE 2 Prevalence of disability by sex and age group. SABE1 Survey, São Paulo, Brazil, 2000 - 2010
Age range (years)
2000 (%) Male
p 2010 (%)
Female
p Male p Female p
60-64 15.79 36.83 23.65 40.7
65-69 18.01 30.97 36.38 49.48
70-74 22.13 37.44 38.26 43.47
75-79 32.63 48.66 38.33 59.51
≥ 80 years 43.62 54.72 47.86 68.46
Total 21.79 <0.0000 39.02 0.5265 38.9 0.0003 54.33 0.0001
1available from: http://www.fsp.usp.br/sabe.
TABLE 3 Life expectancy, disability-free life expectancy, disabled life expectancy and proportion (%) of years to be lived free of disability, by gender and age group. SABE Survey, São Paulo, Brazil, 2000 - 2010
Gender and age group LE1 (years)
2000 / 2010
DFLE2 (years)
2000 / 2010
DLE3 (years)
2000 / 2010
DFLE % in LE 2000 / 2010
Female
60-64 22.45 / 24.59 13. 01 / 11.37 9.44 / 13.22 57. 94 / 46.23
65-69 18.68 / 20.62 10.55 / 8.87 8.13 / 11.75 56.5 / 42.99
70-74 15.18 / 16.95 7.92 / 6.9 7.26 / 10.05 52.18 / 40.68
75-79 12.03 / 13.66 5.92 / 4.72 6.11 / 8.94 47.55 / 34.54
≥ 80 years 9.37 / 10.89 4.24 / 3.44 5.13 / 5.93 45.28 / 31.54
Male
60-64 17.65 / 19.73 13.3 / 12.56 4.35 / 7.17 75.34 / 63.65
65-69 14.56 / 16.36 10.5 / 9.75 4.06 / 6.61 72.1 / 59.58
70-74 11.86 / 13.34 8.01 / 7.73 3.85 / 5.61 67.53 / 57.96
75-79 9.45 / 10.71 5.79 / 6.00 3.66 / 4.71 61.31 / 56.01
≥ 80 years 7.5 / 8.6 4.23 / 4.48 3.27 / 4.12 56.38 / 52.14
period of 25 years, from 1970 to 1995, showed that the increase in LE at 65 years is universal and constant. The evolution of DFLE, in turn, seems to be stable, leading to the possibility that the years gained in LE may occur at the expense of disabled years.28
In the Global Burden of Disease Study, the analysis of healthy life expectancy for 187 countries over the pe-riod 1990-2010 showed that as life expectancy increases, the number of years of healthy life lost due to disability has also increased in most countries, including Brazil. This trend is consistent with the hypothesis of morbidity
expansion.29
In Europe, however, time series obtained from 14 coun-tries in the period 1995-2004, show important differences in the progression of a measure of healthy life expectancy called “healthy life years.” Some countries show an increa-se in DFLE at 65 years or older (men: Austria, Belgium, Italy, Finland, Germany; women: Belgium, Italy, Sweden), while other countries show stagnation (men: France, Gree-ce, Ireland, Spain; women: Austria, Denmark, UK, Finland, France, Spain) or reduction (men: Denmark, Portugal, Ne-therlands, Sweden, United Kingdom; women: Germany, Greece, Ireland, Netherlands, Portugal).28
In the United States of America (USA) for the last years of the twentieth century, using data from the Me-dicare Current Beneficiary Surveys (MCBS) of 1992-1996, Waidmann & Liu found a consistent decline in disability rates for instrumental activities of daily living, at 65 years of age or older.30
In face of these trend variations for DFLE in different countries, two hypotheses have been raised. First, the de-crease in mortality was accompanied by redistribution of disability levels with, on the one hand, a reduction in the prevalence of the most severe level and, on the other hand, an increase in the prevalence of less severe levels. Thus, years of life in good self-perceived health have generally increased, while the trends in disabled life expectancy have evolved differently depending on the level of disabi-lity severity: with decrease for the most serious and in-crease for milder cases.28
Secondly, the disability that could be attributed to disease and aging would, in fact, be a consequence of li-mited education and training received by older genera-tions. Among the variables that explain the variation in DFLE in different contexts, education has been highligh-ted as one of the most important. Analyzes suggest that future changes in education levels would continue to con-tribute to improving the functionality of the popula-tions.31 A U.S. study showed by calculating DFLE between 1970 and 1990 that the compression of morbidity began
with individuals with more years of education.32 A study from Austria about educational disparity trends showed that, among women, there is a significant increase of the difference in healthy life expectancy between people from middle- and low-education backgrounds.33
Thus, the results presented in this study need to be viewed with caution as the elderly population evaluated presented a lower level of education compared with coun-tries where DFLE time series are available, such as those in Europe and North America. In populations with low educational levels, a tendency to expansion of morbidity would therefore be expected.
Moreover, we must also consider the fact that the di-sability measure used in the present study (basic activi-ties of daily living) reflects a moderate to severe impair-ment of functionality. Unlike other countries where more severe disabilities have not increased over the years, this increase was found in the results presented. Since the most severe disabilities are less affected by education as a means of adaptation, these findings may suggest, in fact, a process of morbidity expansion in the Brazilian elderly population.
The self-reported information may also produce bia-ses to the results. It is noteworthy, however, that studies on healthy life expectancy have worked with self-repor-ted diagnoses.34, 35 Research in Brazil shows the validity of self-reported information to detect the health status. Conditions such as cardiovascular disease and diabetes seem to be properly reported by individuals, by virtue of the universal coverage offered by the Brazilian health sys-tem.36
A study based on the National Survey by Household Sampling (PNAD) from 1998 to 2003 also showed that the use of another respondent does not modify the dis-tribution of self-rated health among the elderly, or the factors associated with it.37
Another aspect to be taken into account involves the non-inclusion of elderly patients treated in institutions, which could also lead to underestimation of the level of disability, to the extent that this elderly population could be experiencing higher prevalence of disability.
As research implications, it is considered that future studies could use longitudinal designs enabling better understanding of the transitions between health states, especially the functional capacity.38 Studies including the institutionalized population could bring more informa-tion about the evoluinforma-tion of disabled life expectancy among the elderly. The use of the Disability-Adjusted Life Expec-tancy (DALE) indicator to compare the differences between genders and sub-populations with different levels of di-sability severity might bring new information about the differences in DFLE in the elderly population. Studies that address the relationship between multimorbidity and functional capacity may contribute to the unders-tanding of the process of morbidity compression in this population.
According to the results of this study, the expansion of morbidity is an ongoing process in the elderly popu-lation in the municipality of São Paulo, for the period 2000-2010. Nevertheless, it has been shown that efforts to promote health in populations of young adults (aged 65 or less) can lead to improvements in health and lon-gevity in the elderly, without increasing health expendi-tures.27 In this sense, the health status seems to depend on public efforts to combat smoking, obesity, low levels of exercise, poor diet and excessive alcohol intake.40
Finally, we assume that a synergistic strategy to prove educational levels, improve nutritional status, im-prove working conditions and imim-prove health behaviors could preventively lead to improved functional capabili-ties and performance in essential activicapabili-ties of daily life, contributing to the healthy life expectancy of future ge-nerations of elderly people.
C
ONCLUSIONVariations in disabled life expectancy and in the propor-tion of years to be lived free of disability showed that the expansion of morbidity is an ongoing process in the el-derly population in the municipality of São Paulo, from 2000 to 2010.
R
ESUMOA expansão da morbidade: tendências da expectativa de vida saudável da população idosa
Objetivo: analisar as mudanças na expectativa de vida (EV) e na expectativa de vida livre de incapacidade (EVLI) dos indivíduos idosos do município de São Paulo, de 2000 a 2010, de modo a avaliar a ocorrência de compressão ou expansão da morbidade nessa população.
Métodos: estudo transversal repetido, de base popula-cional, utilizando dados oficiais secundários para o mu-nicípio de São Paulo e dados obtidos a partir do Estudo Saúde Bem-Estar e Envelhecimento (SABE). A incapaci-dade funcional foi definida como dificulincapaci-dade para a rea-lização de pelo menos uma atividade básica de vida diá-ria. O método de Sullivan foi utilizado para o cálculo de EV e EVLI para os anos de 2000 e 2010.
Resultados: de 2000 a 2010, observou-se um aumento da expectativa de vida com incapacidade (EVCI) em to-das as faixas etárias, em ambos os sexos. A proporção de anos de vida livres de incapacidade, aos 60 anos, decres-ceu de 57,94% para 46,23% em mulheres, e de 75,34% para 63,65% em homens. Já aos 75 anos, esta proporção de-cresceu de 47,55% para 34,54% em mulheres, e de 61,31% para 56,01% em homens.
Conclusão: a expansão da morbidade é um processo em curso na população idosa do município de São Paulo, no período de 2000 a 2010. Os resultados apresentados po-dem colaborar para a elaboração de estratégias preventi-vas e para o planejamento de serviços de saúde adequa-dos às futuras gerações de iadequa-dosos.
Palavras-chave: esperança de vida; expectativa de vida ativa; tábuas de vida; morbidade; idoso.
R
EFERENCES1. Centro Latinoamericano de Demografia (CELADE). Population estimates and projection by calendar years and single ages, both sexes. Santiago: CE LADE, Population Division; 2000. (Demographic Bulletin No. 66).
2. Camarano AA, Kanso S, Leitão e Mello J. Quão além dos 60 poderão viver os idosos brasileiros? In: Camarano AA, organizador. Os novos idosos brasileiros: muito além dos 60? Rio de Janeiro: IPEA; 2004. p.77-105. 3. Omran AR. The epidemiologic transition: a theory of the epidemiology of
population change. Milbank Meml Q. 1971;49(4): 509-38.
4. Omran AR. The epidemiologic transition theory. A preliminary update. J Trop Pediatr. 1983;29(6):305-16.
5. Fries JF. Aging, natural death and the compression of morbidity. N Engl J Med. 1980;303(3):130-5.
6. Fries JF. Strategies for reduction of morbidity. Am J Clin Nutr. 1992;55:1257S-62S. 7. Gruemberg EM. The failure of success. Milbank Meml Q. 1977;55 (1): 3-24. 8. Kramer M. The rising pandemic of mental disorders and associated chronic diseases and disabilities. Acta Psychiatr Scand. 1980;62(Suppl 285):382-97. 9. Manton KG. Changing concepts of morbidity and mortality in the elderly
population. Milbank Meml Q Health Soc. 1982;60(2):183-244.
10. Sanders BS. Measuring community health levels. Am J Public Health. 1964;54(7):1063-70.
11. Sullivan DF. A single index of mortality and morbidity. HSMHA Health Reports 1971;86(4):347-54.
12. Bone MR. International efforts to measure health expectancy. J Epidemiol Community Health. 1992;46(6):555-8.
13. Nusselder WJ. Compression of morbidity. In: Robine JM, Jagger C, Mathers CD, Crimmins EM, Suzman RM, editors. Determining health expectancies. England: John Wiley & Sons; 2003. p.35-58.
14. Agree EM. The influence of personal care and assistive devices on the measurement of disability. Soc Sci Med. 1999;48(4):427-43.
16. Camargos MCS, Perpetuo IHO, Machado CJ. Expectativa de vida com incapacidade funcional em idosos em São Paulo, Brasil. Rev Panam Salud Publica. 2005;17(5/6):379-86.
17. Camargos MCS, Rodrigues RN, Machado CJ. Expectativa de vida saudável para idosos brasileiros, 2003. Ciênc Saúde Coletiva. 2009;14(5):1903-9. 18. Andrade FCD, Guevara PE, Lebrão ML, Duarte YAO, Santos JLF. Gender
differences in life expectancy and disability-free life expectancy among older adults in São Paulo, Brazil. Women’s Health Issues. 2011;21(1):64-70. 19. Lebrão ML, Laurenti R. Saúde, bem-estar e envelhecimento: o estudo SABE
no município de São Paulo. Rev Bras Epidemiol. 2005;8(2):127-41. 20. Instituto Brasileiro de Geografia e Estatística (IBGE). Censo demográfico:
2000. Rio de Janeiro: IBGE; 2001.
21. Instituto Brasileiro de Geografia e Estatística (IBGE). Pesquisa Nacional por Amostra de Domicílios. Rio de Janeiro: IBGE; 1995.
22. Albala C, Lebrão ML, León Díaz EM, Ham-Chande R, Hennis AJ, Palloni A, et al. Encuesta Salud, Bienestar y Envejecimiento (SABE): metodologia de la encuesta y perfil de la población estudiada. Rev Panam Salud Pública 2005;17(5/6):307-22.
23. Gutiérrez-Fisac JL, Gispert R, Sola J. Factors explaining the geographical differences in disability-free life expectancy in Spain. J Epidemiol Community Health. 2000;54(6):451-5.
24. Mathews RJ, Jagger C, Hancock RM. Does socio-economic advantage lead to a longer, healthier old age? Soc Sci Med. 2006;62(10): 2489-99. 25. Deeg DJH, Verbrugge LM, Jagger C. Disability Measurement. In: Robine JM,
Jagger C, Mathers CD, Crimins EM, Suzman RM, editors. Determining health expectancies. England: John Wiley & Sons; 2003. p.203-19. 26. Jagger C, Cox B, Le Roy S, EHEMU. Health expectancy calculation by the
Sullivan method. 3rd ed. Montpellier: EHEMU; 2007. (EHEMU Technical
Report 2006, 3).
27. Brasil. Ministério da Saúde. DATASUS. Mortalidade–Brasil. [cited on March 22, 2012]. Available from: http://tabnet.datasus.gov.br/cgi/tabcgi.exe?sim/ cnv/obtuf.def.
28. Riley JC. The risk of being sick: morbidity trends in four countries. Popul Develop Rev. 1990;16(3):403-32.
29. Robine JM, Romieu I, Michel JP. Trends in health. In: Robine JM, Jagger C, Mathers CD, Crimins EM, Suzman RM, editors. Determining health expectancies. England: John Wiley & Sons; 2003. p.75-101.
30. Salomon JA, Wang H, Freeman MK, Vos T, Flaxman AD, Lopez AD, et al. Healty life expectancy for 187 countries, 1990-2010: a systematic analysis for the Global Burden Disease Study 2010. Lancet. 2012;380(9859):2144-62. 31. Waidmann TA, Liu K. Disability trends among elderly persons and
implications for the future. J Gerontol Soc Sci. 2000;55B(Suppl 5):S298-S307. 32. Freedman VA, Martin LG. The role of education in explaining and forecasting trends in functional limitations among older Americans. Demography. 1999;36(4):461-73.
33. Crimmins EM, Saito Y. Trends in healty life expectancy in the United States 1970-1990: gender, racial and educational differences. Soc Sci Med. 2001;52(11):1629-41.
34. Klotz J. Convergence or divergence of educational disparities in mortality and morbidity? The evolution of life expectancy and health expectancy by educational attainment in Austria in 1981-2006. Vienna Yearb Popul Res. 2010;(8):139-74.
35. Nusselder WJ, Van der Velden K, Van Sonsbeek JLA, Lenior M, Van den Bos GAM. The elimination of selected chronic diseases in a population: the compression and expansion of morbidity. Am J Public Health. 1996;86(2):187-94. 36. Jagger C, Matthews R, Melzer D, Matthews F, Brayne C. Educational
differences in the dynamics of disability incidence, recovery and mortality: Findings from the MRC Cognitive Function and Ageing Study (MRC CFAS). Int J Epidemiol. 2007;36(2):365-7.
37. Barreto SM, Figueiredo RC. Chronic diseases, self-perceived health status and health risk behaviors: gender differences. Rev Saúde Pública. 2009;43(Supl 2):1-9.
38. Lima-Costa MF, Loyola Filho AI, Matos DL. Tendências nas condições de saúde e uso de serviços de saúde entre idosos brasileiros: um estudo baseado na Pesquisa Nacional por Amostra de Domicílios (1998, 2003). Cad Saúde Pública. 2007;23(10):2467-78.
39. Barendregt JJ. Incidence and prevalence-based SMPH: Making the Twain Meet. In: Murray CJL, Salomon JA, Mathers CD, Lopez AD, editors. Summary measures of population health: concepts, ethics, measurement and applications. Geneva: World Health Organization; 2002. p. 221-31. 40. Imai K, Soneji S. On the estimation of disability-free life expectancy: Sullivan’s
method and its extension. J Am Stat Assoc. 2007;102(480):1199-211. 41. Christensen K, Doblhammer G, Rau R, Vaupel JW. Ageing population: the