Revista
de
Administração
http://rausp.usp.br/ RevistadeAdministração52(2017)304–316
Strategy
and
Business
Economics
Another
driver
of
the
Brazilian
fuel
ethanol
supply
chain:
the
consumers’
preferences
Influenciando
a
Cadeia
Brasileira
de
Abastecimento
de
Etanol:
As
Preferências
dos
Consumidores
Influencia
de
las
preferencias
de
los
consumidores
en
la
cadena
de
suministro
de
etanol
en
Brasil
Giuliana
Isabella
a,b,∗,
Abraham
Sin
Oih
Yu
b,c,
Adriano
Manic¸oba
da
Silva
d,
Ana
Lucia
Pegetti
eaInsper–InstitutodeEduca¸cãoePesquisa,SãoPaulo,SP,Brazil bUniversidadedeSãoPaulo,SãoPaulo,SP,Brazil cInstitutodePesquisaTecnológica,SãoPaulo,SP,Brazil
dInstitutoFederaldeSãoPaulo,Suzano,SP,Brazil eUniversidadeCatólicadeSantos,Santos,SP,Brazil
Received22December2015;accepted27September2016 Availableonline13May2017
ScientificEditor:PaulaSaritaBigioSchnaider
Abstract
ManyfactorshavebeendiscussedintheliteratureasthecausesforsetbacksintheBrazilianethanolsupplychain,suchasthelowpriceofpetroleum andthehighpriceofsugarinthefinancialcrisisin2008.However,thereisanimportantgapthatwasnotexploredyet,howdodriverschoose torefueltheircars?Dothesupplychainmanagersknowtheirconsumers?Basedonthat,thispaperaimstodemonstratehowtheethanolsupply chainstakeholdersperceiveconsumers’preferencesandcomparethemtothefactorsthataretakenintoconsiderationbyBrazilianflexible-fuel vehiclesdriverswhenchoosingtypesoffuelgasolineorethanol.Forthat,weillustratedthecasebyusingasampleofannouncementscollected fromBraziliannewsmediafeaturingthesupplychainmanagers’viewandthesurveytakenbydriverstounderstandtheconsumer’sactions.Our resultsindicatethatthereisasignificantdifferencebetweentheactualpreferencesoffuelconsumersandtheperceivedconsumers’preferencesby thestakeholders.Thisdisparityisprobablythe(oroneofthe)maincauseofthesecondsetbackintheBraziliansupplychain(2009–2012).Based ontheseresultswepointoutthestrategicimplicationsinmanagingthissupplychainandalsotheroleofpublicpolicyinimprovingthediffusion ofethanolinBrazil.
©2017PublishedbyElsevierEditoraLtda.onbehalfofDepartamentodeAdministrac¸˜ao,FaculdadedeEconomia,Administrac¸˜aoe
ContabilidadedaUniversidadedeS˜aoPaulo–FEA/USP.ThisisanopenaccessarticleundertheCCBYlicense(http://creativecommons.org/ licenses/by/4.0/).
Keywords: Choice;Consumerbehavior;Energy;Ethanol;Gasoline;Supplychain
Resumo
Muitosfatorestêmsidodiscutidosnaliteraturasobreascausasdeobstáculosnacadeiadesuprimentodoetanolbrasileiro,comoporexemplo,o baixoprec¸odopetróleoeoprec¸oelevadodoac¸úcarduranteacrisefinanceirade2008.Noentanto,háumimportantefatorquepodetambémserum obstáculo,masquenãofoiexploradoatéomomento,oconsumidor.Comomotoristasescolhemreabastecerseuscarros?Seráqueapontainicial dacadeiaconheceosseusconsumidores?Nestetrabalhotem-secomoobjetivodemonstrarcomoosintervenientesdacadeiadefornecimento deetanolpercebemaspreferênciasdosconsumidores,ecompará-lasaosfatoresqueosmotoristasdeveículosflexbrasileirosapontamcomo
∗Correspondingauthorat:RuaQuatá,300,CEP04546-042,SãoPaulo,SP,Brazil.
E-mail:[email protected](G.Isabella).
PeerReviewundertheresponsibilityofDepartamentodeAdministrac¸ão,FaculdadedeEconomia,Administrac¸ãoeContabilidadedaUniversidade deSãoPaulo–FEA/USP.
http://dx.doi.org/10.1016/j.rausp.2017.05.003
relevantesnaescolhadoscombustíveis.Paraisso,utilizou-seumaamostradeanúnciosrecolhidosapartirdemeiosdecomunicac¸õesbrasileiros quecaracterizamaspercepc¸õesdosgestoresdacadeiadefornecimentoeumaamostracommotoristasparaentenderasac¸õesdoconsumidor. Comoresultado,observou-sequeháumadiferenc¸aconsiderávelentreaspreferênciasatuaisdosconsumidoresdecombustíveleaspreferências doconsumidorpercebidaspelaspartesdacadeiadesuprimentodeetanol.Adisparidadeéprovavelmentemaisumadascausasdosegundorevés nacadeiadeabastecimentodoBrasil(2009-2012).Combasenestesresultadosdestacam-seasimplicac¸õesestratégicasnagestãodestacadeiade suprimentosetambémopapeldaspolíticaspúblicasnamelhoriadadifusãodeetanolnoBrasil.
©2017PublicadoporElsevierEditoraLtda.emnomedeDepartamentodeAdministrac¸˜ao,FaculdadedeEconomia,Administrac¸˜aoe ContabilidadedaUniversidadedeS˜aoPaulo–FEA/USP.Este ´eumartigoOpenAccesssobumalicenc¸aCCBY(http://creativecommons.org/ licenses/by/4.0/).
Palavras-chave:Escolha;Comportamentodoconsumidor;Energia;Etanol;Gasolina;Cadeiadesuprimentos
Resumen
Muchosehadiscutidoenlaliteraturasobrelosfactoresqueproducenobstáculosenlacadena desuministrodeletanolenBrasil,comopor ejemplo,elbajopreciodelpetróleoyelaltopreciodelazúcardurantelacrisefinancierade2008.Sinembargo,existeunimportante factor quetambién puedeconstituirunobstáculo,peroqueno hasidoexploradohastaelmomento,elconsumidor.¿Cómolosconductoreseligen recargarcombustible?¿Seráqueelpuntoinicialdelacadenaconoceasusconsumidores?Enestetrabajoelobjetivoesdemostrarcómolos actoresdelacadenadesuministrodeetanolpercibenlaspreferenciasdelosconsumidoresycompararlasconlosfactoresquelosconductores devehículosflex brasile˜nosse˜nalancomo relevantesenlaeleccióndeloscombustibles.Paraeso, sehautilizadouna muestradeanuncios recogidosapartirdemediosdecomunicaciónbrasile˜nosquecaracterizanlaspercepcionesdelosgestoresdelacadenadesuministroyuna muestradeconductorespara entender lasacciones del consumidor. Comoresultado,se verifica que existeuna diferencianotableentre las preferenciasactualesdelosconsumidoresdecombustibleylaspreferenciasdelconsumidorpercibidasporlosactoresdelacadenadesuministro deetanol.Taldisparidades,probablemente,unacausamásdelsegundorevésenlacadenadesuministrodeBrasil(2009-1012).Sedestacan lasimplicacionesestratégicasenlagestióndeestacadenayelpapeldelaspolíticaspúblicasrespectoalamejoradeladifusióndeletanolen Brasil.
©2017PublicadoporElsevierEditoraLtda.ennombredeDepartamentodeAdministrac¸˜ao,FaculdadedeEconomia,Administrac¸˜aoe ContabilidadedaUniversidadedeS˜aoPaulo–FEA/USP.Esteesunart´ıculoOpenAccessbajolalicenciaCCBY(http://creativecommons.org/ licenses/by/4.0/).
Palabrasclave: Opción;Comportamientodelconsumidor;Energía;Etanol;Gasolina;Cadenadesuministro
Introduction
Brazilhasbeenthepioneerandleaderinthedeploymentof renewableenergy,specificallysugarcane-basedethanol.
Large-scale diffusion of biofuel in Brazil started forty years ago.
The Brazilian government had a decisive role in the launch
of the process and provided incentives by implementing the
hugeproduction,distributionandretailinginfrastructureinthis
continentalcountry. Manyincrementalinnovationshavebeen
introducedintheethanolsupplychainandtheconsequencehas beenasteadyincreaseintheethanolproductivity(Goldemberg,
Coelho,Nastari,&Lucon,2004;VandenWallBake,Junginger,
Faaij, Poot, & Walter, 2009). The automotive industry
con-tributedwithinnovationssuchastheethanol-onlyenginesand, lateron,the flex-fuel engines(Furtado, Scandiffio,&Cortez, 2011).Thesearewhatwecallethanolfueltechnologies.Butthe diffusionprocessinthisperiodhashaditsupsanddowns.The firstboomstartedwiththeintroductionofethanol-onlyengine
in1979,andaround1985almost90% ofnewcarssoldwere
equippedwiththeseengines.Butbytheendof80sthesalesof
thesecarshadadramaticdownturnduetowidespreadethanol
shortage.Wecallthisthefirstsetbackinethanoldiffusion.The lastboomperiodwasin2003–2010asaresultoftheastounding successoftheflex-fuelvehicles(FFV).However,since2010,the salesofethanolhavebeenstagnantcomparedtogasoline.This canbeconsideredthesecondsetbackintheprocessofethanol
diffusioninBrazil(Alonso-Pippo,Luengo,Alberteris,Pino,&
DuvoisinJunior,2013;Lucas-dos-Santos,2013;Moreira,Pacca,
&Parente,2014;Salvo&Huse,2011).
Certainly a mix of all factors mentioned above caused
these setbacks. Even though previous studies analyzed
con-sumers’ behavior in the refuel of their cars (Aguilar, Cai,
Mohebalian, & Thompson, 2015; Van der Kroon, Brouwer,
& Van Beukering, 2014) and the viability of the flexible
carsinBrazilinaconsumerperspective (Samanez,da Rocha
Ferreira, doNascimento, de Almeida Costa,& Bisso,2014),
none investigated the behavior of the consumer. We believe
that the consumer behavior preferences can be one of the
factors since the sales of ethanol have been stagnant
com-pared to gasoline in2010 and during thisperiod many FFV
ownershavebeenrefuelingtheircarswithgasolineinsteadof ethanol.
Relatedto ethanol,consumer preferenceswere studied by
Anderson(2012)andSalvoandHuse(2013).Anderson(2012)
developed amodel to understandthe demand for corn-based
ethanol of household preferences as a gasoline substitute.
Accordingtohim,“priceresponsesareconsiderablesmaller”
(p.166),howeversomehouseholdarewillingtopayasizeable
premium for ethanol. The empirical study in how consumer
make choices between gasoline and sugarcane ethanol from
SalvoandHuse(2013)hasshownthattheeffectonthe
In addition,“consumerdemandfor gasolinemayprovetobe sticky”(p.270).
Thus,thisstudyseekstocontributetothisdebateby exam-iningthefollowingquestions:howdodriverschoosetorefuel
their cars?Is the perception of supplychain managers about
theirconsumerscorrect?Weaimtoinvestigatewhetherthereis
adifferencebetweentheactualpreferencesoffuelconsumers
andtheperceivedconsumers’preferencesbykeystakeholders
ofthe ethanolsupplychain.Thefocusof thispaperisonthe
managementoftheethanolsupplychaininthesecondsetback,
morespecificallyontherole oftheBrazilianfuelconsumers’ preferences.Withthatinmind,weproposestrategiesin manag-ingthissupplychainandexplorepublicpolicyimplicationsof it.
Basedon a review on the literature of energy technology
diffusion and supply chain management, complemented by
a sample of pronouncements collected inthe Braziliannews
media,andonasurveycarriedoutin2012,withBrazilianfuel
consumers, we present the different perceptions betweenthe
supplychain’s keydecisionmakersandfuelconsumers.This
disparitymaybeanimportantreasonofthesecondsetback. Thisstudycontributestotheimprovementofethanolsupply
chainmanagementthroughabetterunderstandingoffuel
con-sumerbehavior.Theanalysisofconsumers’preferenceswhen
choosingbetweenethanolandgasolineinBrazilhasnotbeen
exploredinthebusinessliteratureyet.Thestudiesonconsumer preferenceswherefocusonpriceorchangingprice(Anderson,
2012;Salvo&Huse,2013).And,themainbusinessresearches
inethanolarerelatedtogovernancestructureandgasoline distri-bution(Soares&Saes,2015),projectionofconsumptionbased in technology or sustainable habits (Silva, Spers, Wright, &
Costa,2013),productdistribution(Lopes,daSilva,&Conejero,
2010) and analysis of political strategies (Silva, Caldeira, &
Bandeira-de-Mello,2014).Inaddition,themajorityof papers
aboutethanolhasbeenfocusingonitsengineering,economics
orenvironmentalaspects,byexploringtopicssuchas alterna-tivebiomasses(Wit,Junginger,Lensink,Londo,&Faaij,2010), publicpolicies(Gonzalez,Berna,&Wetzstein,2012), ecologi-calimpact(Hodbod&Adger,2014)andfinancialimpacts(Salvo
&Huse,2011).
Thefollowingsectionpresentsthetheoreticalbasisforthe
study, the third describesthe method of the two studies, the
fourthpresentstheresultsanddiscussionandthefifthstatesthe
mainconclusions.
Theoreticalframework
This section presents the literature review of the context describedintheintroduction:thedescriptiontothesecond set-backintheethanoldiffusionandtheperceptionofconsumer’s preferencebyethanolsupplychainstakeholders.
Thesecondsetback:narrativeandperspectives
The developmentand introduction of flex-fuel engines by
companies such as Magneti-Marelli, Bosch and Delphi
re-ignitedtheBrazilianethanol supplychainin2003.The main
feature of a flex-fuel engine is the ability to identify the
proportion of gasoline or ethanol burned in the
combus-tion chamber, and automatically adjusts the engine’s setting
accordingly(Nascimentoetal.,2009).Thisfeatureshiftedthe consumer’sdecisionfromwhichtypeofenginestochoose,when
buying acar,towhichfueltypetobuywhen refuelingacar.
Therefore,intherefuelingmoment,itisnecessarynotonlyto choosewhichgasstationtogo,butalsowhattypeoffueltobuy.
Governmentcollaboratedbygrantingflex-fuelvehicles(FFVs)
the same tax breaksas ethanol-only cars.The sales of FFVs
skyrocketed, by2007(four yearsafter itsintroduction), 85%
of newcar purchases byBrazilianswere equippedwith
flex-fuel engines (Salvo&Huse, 2011). Thisrate of diffusion of
FFVswashighertothatofethanol-onlycarmorethantwenty
yearsearlier.ButFFV’sdiffusionwasbenefitedbyotherfactors:
theearly2000swasaperiodinwhichthepetroleumpricewas
rising; the worldsugarpricereceded comparedtothat of the
90s;andtheextensiveinfrastructureofethanoldistributionand retailnetwork,builtinthe80s,wasstilloperational(Hira&De
Oliveira,2009).ThefleetofFFVs,in2012,representedabout
54%ofthetotallicensedlightcommercialvehiclesinBrazil.In
absolutenumbers,therewereapproximately30millionFFVs,
thelargestfleetofthistypeintheworld(MinistériodeMinas
eEnergias,2013).Thisboomalsoattractedasignificantinflow
offoreigncapitalinBraziliansugarcaneindustry,andasa
con-sequencetheindustrywentthroughafreneticcycleofmerges
andacquisitionsbefore2008.
Duetoproblemsrelatedtoclimaticconditionsandthe
rem-nants of the 2008economic crisis, therewere strong ethanol
pricefluctuationsin2009duetotightsupply.Toomuchrain dur-ingharvestingloweredthesaccharosecontent,thuslessethanol per tonofsugarcane. The2008financialcrisiscreated opera-tionaldifficultiesforsugarcanemills.Manyofthemhadliquidity problemtofinancetheiroperations.Inordertosavecash, numer-ousplantationsdelayedthereform(replant)ofsugarcaneplants andthereforejeopardizedfutureethanolproductivity.The
eco-nomiccrisisalsodeceleratedmanyplannedethanolproduction
capacityexpansions.In2010theethanolsalessuffereditsfirst
declineinsevenyears.Thenumbers worsenedin2011,when
pricespikesbroughtdownthesaleofethanol(Lucas-dos-Santos, 2013).AccordingtotheBraziliangovernment,in2011,the con-sumptionofethanolreduced7.7%,whilethegasolineincreased
17.4%inthesameyear(MinesandEnergyMinistry,2012).It
was clear that eventhough the numberof Brazilian flex-fuel
car wasincreasing,thesecarownerswereoptingforgasoline
inrefuelingtimes.Theturmoilintheethanolmarketprompted Braziliangovernmenttointervenein2011:thepresident
Rouss-efforderedtheANP(NationalAgencyforPetroleum,Natural
GasandBiofuel)tomonitorandoverseetheethanolproduction anddistributionnetwork.However,themarketreactionhadbeen
sluggish,theethanolconsumptionof2012and2013werestill
belowthatof2011(Lucas-dos-Santos,2013).
The abovebriefdescription capturesthe mainevents lead-ingtothesecondsetback.However,inordertounderstandthese
events,weneedaconceptualframework.Weproposetwo
frame-works toshed lightsfor thispaper. Theyare complementary;
transition. Thisis along-termview onthe process of
adopt-ing a new energy technology (Fouquet, 2010). The second
framework is that of supplychain management. This
frame-worktakesamore operational viewof achievingthe desired
performanceofasupplychain.
The literature on diffusionof newenergy technologies or
energytransitionhascontributedtoourunderstandingof barri-erstotheadoptionoftheseinnovations.Thesenewtechnologies, evenafterfirstsuccessfulcommercialapplication,canfacemany barrierssuch as operationalinefficiency, infrastructureneeds,
informationandfinancingconstrainstoachieveawidespread
diffusion.Thecomplexityinvolvedinthesetransitionshasalso beenpointedoutasoneimportantbarrier.Inordertosurmount thesebarriers,aneffectivestrategyoflearning-by-doingis
crit-ical(Markard&Truffer,2008;Sagar&VanderZwaan,2006).
The deployment of a newset of technology usually
encoun-ters unexpected obstacles, thus the ability of learning from
setbacksis crucialfor thesuccessof diffusion.Learning
pro-videsfeedbacks toimprove the performances of new energy
technologiesthroughcostreduction,operationalproficiency,as wellasinstitutionalmutationssoastofacilitateadoption(Sagar
&VanderZwaan,2006).ThediffusionoffuelethanolinBrazil,
objectof thisstudy, oneof the first large scale implementa-tionof biofuelinthe World,hadbenefitted significantlywith
incremental innovations and improved coordination, through
mostlylearning-by-doing,duringthesefortyyearsofdiffusion
(Goldembergetal.,2004;VandenWallBakeetal.,2009).
Inamoregeneral discussionabout managingtransition in
largetechnicalsystems,suchasthetransportationsystem,Geels
(2004)alsoobservedtheimportanceinunderstandingthe
diffu-sionanduseoftechnology.Hearguesthatpolicymakersmust
payattentiontobothinnovationprocessanduserssothatwecan
bettermanage transitions.Inadoptinganewtechnology,such
as the FFV,consumers havetoincorporate it into their dairy
routines which, depending on the characteristics of the new
technology,mayinvolvesignificant learningandadjustments.
Throughlearning-by-adopting,consumerscanbetterarticulate
their own preferences anddiscover newfunctionalities. This
articulationofnewconsumers’preferencemaytakeyears,since “itoccursinsmallincrementalsteps,andofteninvolves exper-imentsandsetbacks”(Geels,2004,p.908).Ontheotherside,
for thosefirms that introduced newtechnologies inthe
mar-ketplace, thechallenges aretounderstand, first,whoare the
consumers,andsecond,tomonitor their changingpreference
duringdiffusion.Mismatchbetweenconsumers’preferenceand
theperceptionofit bytheproducerscanleadtotensionsand retardthediffusionofthenewtechnology(Geels,2004).
Thesecondframeworkisbasedonthesupplychain
manage-mentliterature.ChopraandMeindl(2013)definedthatasupply chainconsistsofallstagesinvolved,directlyorindirectly,in ful-fillingacustomerrequest.IntheBrazilianethanolsupplychain themainstagesare:sugarcaneplantations,mills,storagesites, transportsystems,gasstationsandrespectivesuppliers.In fulfill-ingcustomers’requests,atypicalsupplychain’sperformances
canbecharacterizedbytwomajordimensions:efficiencyand
responsiveness.Toimprovetheseperformancemeasuresa
sup-plychain hastomake betterdecisionsinfour basicstrategic
areas:transport,inventory,facility(ethanolmills)and informa-tion.Allthesedecisionsinvolvetrade-offsbetweenefficiency (costs)andresponsiveness.Transportbyshipislowincostbut slowinresponsiveness.Higherethanolstockpilecostsmorebut
canimprove responsiveness.Largecentralizedinventory
pro-videsscaleeconomybutmayresultinlongerlead-time.Most
important of allis the abilitytocoordinate actions of supply
chainpartnersthrough information.Abettercoordinated
sup-ply chaincanavoidexcessof someproducts andshortageof
othersbyimprovingtheabilitytopredictdemand.Moreover,a
wellsynchronizedsupplychaincanavoiddamaging
instabili-tiessuchasthe bull-whipeffect(Croson,Donohue,Katok,&
Sterman,2014).
Inordertoboostasupplychain’sperformance,theliterature
suggests that the fundamental first step isa thorough
under-standingofthenatureofdemand(Fisher,1997).Inthecaseofa productwithastableandpredictabledemand,amoreefficient supplychain,withlowerproduction,transportationandstorage costs,shouldbeadopted.Inthecaseofaninnovativeproduct,
such as the FFV, both demand andsupplyof ethanolcan be
uncertainanddifficultytopredict,thereforeamoreresponsive (fastandflexible)supplychainiscalledfor(Lee,2004).
Wenowemploythesetwoframeworkstoanalyzethesetbacks describedabove.Fromtheperspectiveofenergytechnology dif-fusionandtransitionliteraturethesesetbackswerenotabnormal
phenomenon. Many barriers, technical, economic andsocial,
arescatteredontheroadoftransitionordiffusion.Ouranalysis of thesesetbacksshowsthat themainbarrierintheBrazilian
transition hadbeen the periodicmismatchesbetween ethanol
supplyanddemand,whichcausedpriceoscillationsorshortage.
Besidesthenatural variationofsupplybetweenthesugarcane
harvest season andoff-season (in the BrazilianCenter-South
RegionharvestgoesfromApriltoDecember),therehadbeen
other causes: higher international sugar prices decreased the
amount of sugarcane devoted for ethanol production; lower
pricesof petroleumsqueezedthe profit of ethanolproducers,
sinceethanolpriceshouldbe30%lessduetoitslowerenergy
density;demandsurgeswiththesuccessofinnovationsuchas
FFVs; andrelative longlead timetoexpand ethanol
produc-tioncapacity.Theseandothereventscombinedhadproduced
mismatchesbetweensupplyanddemand,generatedprice
oscil-lationssuchasthatof2009withnegativeimpactsonthesaleof ethanolafterwards.
Brazilian supply chain key stakeholders, including policy
makers and company executives, have taken many measures
totamethesemismatchesintheseyears.Exampleswere
gov-ernment’srestrictionsonethanolexportsinseveralepisodesof
strongdomesticdemandandtightsupply;introductionofmany
incremental innovations in every stages of the supply chain
withsignificantethanolcostreduction;and,after government deregulationsatthesecondhalfof90s,producersofsugarcane, sugarandethanolestablishedtheSugarcane,SugarandEthanol
Producers’Council(CONSECANA)inordertocoordinatethe
supplychain.
Thesemeasuresweretakenasattemptstoimprovetheethanol
supplychainperformance(preventfurthermismatches).
toavoidthesecondsetback.Inthispaper,insteadofdiscussing
the challengesinmanaging thesemismatches,we propose to
explore a couple more fundamental questions (based on the
recommendations of two frameworks previously discussed):
first, what had been the presumed consumers’ preference
espousedbykeystakeholders(policymakersandothersrelevant
decisionmakers)inBrazilianethanolsupplychain?Secondly,
whatweretheBrazilianfuelconsumers’actualpreferences?The firstquestionisrelevantbecausethedecisionmaker’sframeof mindstronglyinfluencestheselectionofsupplychainstrategy.
Differences betweenthepresumedandthe actualconsumers’
preferenceswouldindicateaprobleminmanagingethanol
sup-plychain:notfulfillingcustomers’demand.Theimportanceof
thesecondquestionhasbeenemphasizedbybothenergy
tech-nologydiffusionandsupplychainmanagement literatures. A
betterunderstandingofthedemandandthecustomers’
prefer-enceshoulddeterminethesupplychainstrategy.Inotherwords,
the customers’preferences shouldsteer a supplychain tobe
morecostefficientortobemoreresponsive.Asamatteroffact, attheheartofbothsetbackswastheconsumers’decisionnotto purchasetheethanol-onlycars(inthe90s)orethanolfortheir
FFVs(from2010onward).Thefleeingofconsumersawayfrom
ethanolsuggestedthattheethanolsupplychainwasnotfulfilling customers’requests.
Thefirstquestionisdiscussedbelow,thesecondquestionis thetopicforanempiricalstudypresentedinthethirdsection,and
resulting consequences for governmentalpolicy andstrategic
managementofethanolsupplychainarediscussedinfourthand fifthsections.
Presumedconsumers’preferencesespousedbypolicy makers
Asmentionedintheprevioussection,indiscussingthefirst
question,whathadbeenthe presumedconsumers’preference
espousedbykeystakeholders, wepresentpronouncementsof
key stakeholders, including government officials and supply
chainexecutives,since2005(rightafterthesurgeofFFVsales).
OurdatacomefromasurveyofBraziliansmagazinesand
news-papers from 2005 to 2012. We collected around 30 articles
thatillustratekeystakeholdersviewofconsumers’preferences.
Weopted to describeselected statements that reflect the key
stakeholders’ mindset, and these influences in the
decision-making.
Thefirstsetoftheselectedstatementspraises theworking
ofthemarket.ForexampletheDirectorof theDepartmentof
Sugarcane and Bioenergy, Agricultural Ministry, said during
the initial surge of FFV sales in 2005: “...(with FFV) con-sumerswouldadjustthepriceofethanolbychoosingthetypeof fuel...”.
Astherepresentativeofethanolproducers,thepresidentof BrazilianSugarcaneIndustryAssociation(Unica)madethe fol-lowingremarksin2006:“Price(ofethanol)isdefinedbythe market;it“saquestionofsupplyanddemand”.
In 2010, when the ethanol sales suffered its first decline
inseven years, the newpresident of Unica, an economist by
training, made the following comment: “...we can say that
today’s ethanolmarket is anexample ofthe correctworking ofthemarketforces.Themarketadjuststheethanolprice.FFV istheenablingtechnologywhichpermitstheconsumertochoose thefueldependingontherelativeprices.”
Based on this kind of statements, we can infer that the
mind-set ofBraziliangovernmentandethanolindustrial
deci-sionmakerswerebasedontheeconomictheoryofdemandand
supply.Inotherwords,intheperiodafter2003whentheFFV
became widely available, theyhave implicitly presumed that
thepreferenceofBrazilianconsumersisonlyforalowerfuel price:theywillbuyethanolifitiseconomicallytodoso.Their rationaleisthatBrazilianconsumerswouldnotcareaboutthe
priceoscillation ofethanol,sincewiththeFFV theconsumer
cantakeadvantageoftheseoscillations.Putitinanotherway,
they regardedBrazilian flex-fuel vehicleowners as
economi-cally rationaldecisionmakers (Salvo&Huse, 2011).Indeed, studieshaveshownthat atrulyrationalBrazilianflex-fuelcar
owner, a practitioner of real options, can gain significantly
withthesepriceoscillations(Camargoetal.,2011).Therefore,
it isexpected that these stakeholderswould push for amore
efficient supply chain strategy instead of a more responsive
one.
In 2009 the symptom of a crisiswas already apparent to
many insidersintheethanolsupplychain. Thiswas reflected
ina2009reportbytheagencyoftheAgriculturalMinistrythat
regulates farmproductionanddistribution(CONAB)alerting
that:“...Brazilianethanolconsumersarenotusedtoitsprice oscillations,comparedwiththestablepricesofgasoline (con-trolled bytheGovernment)...and theseoscillationscanturn consumersagainstethanol...”.
So,consumers werecomparing pricedynamics of ethanol
against that ofgasoline. Alocalnewspaperinterviewed
com-mon peopleon thestreet in 2011andreportedthe following
sentimentsofethanolconsumers:“Thereisnojustificationfor thesepriceincreases...Thisisarobbery”.
Inthesameyear,evenadirectorofUnicaacknowledgedthe negative reactions of consumer andstated that:“...(ethanol) consumersareirritatedbythesepriceoscillations”.
Thesestatementsshowthat,startingaround2009,therehave
been voiceswarningthat theethanol industryshouldbe
con-cernedwiththeresponsivenessof ethanolsupplychain. They
havenotedthat consumershavenotbeensotolerantwiththe
large price oscillations. Producers began to understand that
the biofuel market is different from the sugar market (Balat
& Balat,2009). In thesugar market the priceoscillations do
notbother somuchtheconsumers(Anderson,2012;Salvo&
Huse,2013),butsincethecostsoffuelareasignificantfraction
ofaverageconsumers’income,suddenethanolpricehikesare
not welcomed andcanstain theimageof biofuel inthelong
run.
The above statements bykey stakeholdersand newspaper
reports suggesttheexistenceofagapbetweentheactual
con-sumers’ preferences and the presumed preferences, by these
key stakeholders, withregard toethanol.Becauseof that, we
conductedanempiricalstudyofBrazilianFFVowners’actual
Understandingconsumerspreference–empirical studies
Weconductedtwoempiricalstudies.Thefirstonewas quali-tativewhichsoughttoexploreatopicanddiscoverandidentify patterns,includingexceptionstotherulesrelatedtohow
individ-uals(Malhotra,2011),whohaveFFVs,choosethetypeoffuel.
Forthat,interviewswhichallowstogatherrichdatafrom
con-sumersandfocusonthesubject(Myers,2013)wasemployed.
Thus,thisfirststudywasaveryexploratoryresearch.The
sec-ond studycomplementsthe first.Using informationfromthe
first study, a survey was created. A structured questionnaire
allowsresearcherstodescribethecharacteristicsoftherelevant group,suchasconsumers.Also,itallowsstatisticalinferences andminimizesampleerrors(Malhotra,2011).Sincetheaimof thispaperwastobetterunderstandthefueldemand,the quan-titativeresearchpermitsbyanumericalrepresentationdescribe andexplain(Malhotra,2011)thefactorsthataffecthow con-sumerschoosethefuel.Inaddition,thesurveyenablesnotonly todescribethedriversfor choosingthefuel,butalsotomake
comparisonbetweengroups,observingconsumer’ssegments.
Studyone:Qualitativeresearch
Toperformthequalitativeresearch,weconductedfourteen
in-depthinterviews,all of them done inSão Paulostate. All
intervieweeshadtohaveaflex-fuelvehicleandhadtobe
respon-sible for it.The script was done withthe idea of understand
how consumers choose the energy. So, first, the respondents
statedthelasttimetheyfueledtheircars,explaininghowthey chosethegasstationandfueltype,andtheirreasonsfortheir choice.Weoptedtoaskintervieweeshowtheychosetheirfuel
lasttimetoensuremoredetailed informationandavoidfalse
memories.Then,specificquestionswereaddedtoimprovethe
informationofconsumer’spreferences.Forinstance,attheend oftheinterview,theparticipantsshowedhowtheirbeliefonhow otherindividualsmakethesedecisions.Thesemi-structure
ques-tionguidewasdefinedbasedonSalvoandHuse(2011)study
andtheywerereviewedbytwoexpertsintheareaof decision-making.Thestructuredquestionsusedinthestudyispresented
onAppendixA.
Studyone:Analysisandresults
Weinterviewed14peoplefromSãoPaulostatewhohadflex cars.Allofthemwererecordedandtranscribed.Onaverage,the interviewslasted25min.
Toanalyzethedata,weusedcontentanalysis.Thistechnique iswidelyused inqualitative research,andhelpresearchers to
summarizecontent/text(e.g.documents,oralcommunication).
Theconventionalcontentanalysispermitsareplicableandvalid inferencesbyinterpretingthetextualmaterial.Soforthisstudy,
wecodedthedata,usingsentencesthat couldlabelsentences
orparagraph.Then,we identifythemestryingtoorganizethe
information.Thethirdstepwastoidentifythemes,conceptsor behaviorthatlinked eachother(Myers,2013).Afterthat,we
identified fourmaincategories: purposesfor using car, when
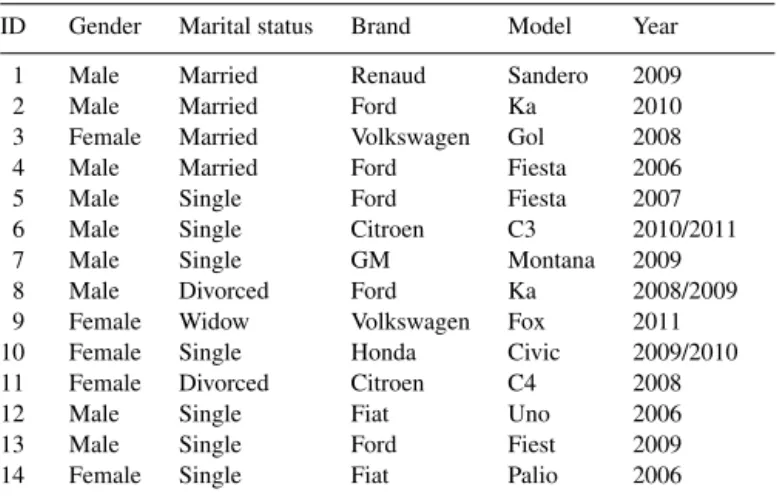
Table1 Interviewees.
ID Gender Maritalstatus Brand Model Year
1 Male Married Renaud Sandero 2009
2 Male Married Ford Ka 2010
3 Female Married Volkswagen Gol 2008
4 Male Married Ford Fiesta 2006
5 Male Single Ford Fiesta 2007
6 Male Single Citroen C3 2010/2011
7 Male Single GM Montana 2009
8 Male Divorced Ford Ka 2008/2009
9 Female Widow Volkswagen Fox 2011
10 Female Single Honda Civic 2009/2010
11 Female Divorced Citroen C4 2008
12 Male Single Fiat Uno 2006
13 Male Single Ford Fiest 2009
14 Female Single Fiat Palio 2006
torefuel,choosingfuel,andchoosinggasstation.Ourfocusis on thefourthcategory, butthe otherthreeprovide contextto understandconsumers’behavior,sotheyarealsodescribed.
Table1presentstheintervieweesdescriptions.
Following,wedescribetheresultsaddingsomecitationsfrom ourinterviews.
Purposesforusingcar–Driversusetheircarsfordifferent reasons.Someusethemonlytotransportthemselvesfromtheir homestoworkorschool:“Iuseittogotomyofficeandschool”, “Totransportmyselftoworkanduniversity”.Othersworkwith thecar:“SometimesIuseittovisitcustomersandbring some-thingtothem”.Athirdgroupusedthemmostlyduringweekends orfor traveling:“Forleisure,orwhenIhavetodosomething farfrommyhome,mostofthetimethecarstaysatgarage.Iam optingforpublictransportation”;“TwiceaweekIuseittogoto work,butnowadaysIamusingmorebus.SoIusethecarmore ontheweekendforsightseeing”.
Refuelingtime–Accordingtohowcustomerusetheircars theyhaveadifferentbehaviorinwhereandwhentorefueltheir tanks.Wehaveonegroupthatplantheirrefueling:“Iwasgoing to travel, even thoughI still had ½ tank, I decided torefuel becausethegasinthecityischeaper”;anotherwhoneverwait forthe“lowfuel”lighttoturn-on;athirdgroupprefertorefuel onlywhenthe“lowfuel”lightison:“Iusuallyrefuelwhenthe lightison,inthiscaseifIfindthegasstationnotsoreliable,I donotcompletelyrefuelthetank”.
Choosinggasstation–Oneofthemostcommonreasonsin whypeoplechosethegasstationwastheprice.Butthetrustinthe brandwasalsorelevant:“Ofcoursetherearesomegasstations withverycheapfuels,butIdistrust”,“Ialwaystrytorefuelin gasstationsthatIknow,atleastthebrandname”,“Ichoseby thebrandname”,“Ichosebythequalityofthefuel.Ipreferto refuelalwaysonthesamegasstation”. Theconveniencewas
also commented: “I used togo toa gasstation that washed
Table2
Totalvarianceexplained.
Factors Eigenvalues %ofvariance Cumulative% Cronbach’sAlpha
1 6.348 28.854 28.854 0.913
2 3.327 15.121 43.975 0.746
3 1.741 7.916 51.89 0.577
4 1.182 5.371 57.261 0.651
5 1.07 4.865 62.126 0.670
andsomedonotcareaboutthepriceandusestheonethatison theway.
ChoosingFuel–Thereasonsforchoosingthekindoffuel arevarious,themostcitedistheprice:“Ofcoursewethinkabout thequalitybutIalwayssearchfora betterprice”;“Whenmy cashislow,IbuyethanolsinceitischeaperalthoughIknowI willneedtorefuelagainsoon”;“Theruleistheonethat every-bodyknows:thepriceofalcoholshouldbe70%,orless,ofthe priceofgasoline”;“Whentheethanolwascheaper,Iusedtomix thefuel”.Ontheotherhand,therearetheonesthatdonotcare abouttheprice:“DoyouthinkIknowhowmuchIpaidforthe fuel?”Anothercommonmotiveistheconvenience:“Thefact ofnothavingtostopping allthetimeinthegasstation,Ifind it[gasoline] anadvantage”.Environmental concernwasalso commented:“Ethanolhastheadvantagetopolluteless,thenif youdrivetothecityitisevenbetter”;“Ifitisnottooexpensive, Iprefertorefuelwithethanolsinceitismoresustainable”.The questionofqualitywasalsopresentintheinterviews:“Many peopletalkaboutthepricebutthequalityoffuelisimportant”. Thereisalsosomebelievessuchas“ThecarisflexandIknow thatifIputonlygasoline,orputonlyethanol,itdoesnot influ-encethecar’sengine,butonceinawhileIfinditisimportantto changethefuel”;“Mycarishavingaprobleminthepiston,and thealcoholcancleanit”;“WhenIrefuelthetankwithethanol thecardoesnotworkverywell,forinstanceinthemorningit isdifficulttostart”;and“Thegasolineismoretrustful”.
Observethatinchoosingfuelcategories,using theideaof
most cited motives or argument for choosing the product, it
waspossibletodefinesubcategoriessuchas:price,convenience,
environmentalconcerns,qualityand,believes.Basedonthese
specificcategory(choosingfuel),subcategories,andconsumers
statements,weoptedtodoanewempiricalstudypresentedin
thenextsection.
Studytwo:Quantitativeresearch
Inordertounderstandhowconsumerchosethefueltypes,
wecarried outaquantitativeresearchthrough aquestionnaire
survey,whichwasaimedtoidentifythe mainfactorsofthese
choices.Guidedbytheinformationgatheredfromthe
qualita-tiveresearchandbythekeystakeholder’spronouncements,we
developedstatements,whichwerethebasisforthisquantitative survey.
Braziliandrivers,fromSãoPaulo,receivedthequestionnaire byemail.Qualtricssoftwarewasusedtotheonlinedistribution.
Themethodof“snowballing”wasused,allowingthe
individ-ualswhoreceivedthequestionnairetoresendthelinktotheir
acquaintances,thereby increasingthe sample anddistributing
the survey tovarioussegments of individuals.Before partici-pantsstarted,theyreadaconsentformandtheinstructionsof the study. Theparticipantsdid notreceivemoney,it wasjust
explained that the study was been done by researchers from
theiruniversitiesanditwasimportanttheirparticipationonthe study.Thefirstquestiontheyhadtoanswerwaswhetherornot theyhadaflex-fuelvehicleandiftheywereresponsibleforthe car. Onlyparticipants, whowereapproved inthefilter, could
answer thequestionnaireforthisresearch.Itwould notmake
senseforpeople,whodonotownaflex-fuelcar,toparticipate inthisstudy.
Afterthe filter, the participantswere askedtoindicate the extenttowhichtheyagreedordisagreedwitheachstatements.
These sentences weremeasured on afive pointsLikert scale
(1=completely disagree and5=completely agree). The
sen-tenceswererandomlyarrangedamongparticipants.Participants
completed22statementsandsomedemographicquestions.
Itisimportanttocommentthatthepresentempiricstudywas carriedoutattheendof2012justafterthesecondsetback.The nextsectionpresentstheresultsofthisstudy.
Studytwo:Analysisandresults
In order to identify the factors that influence the choice
between buying ethanol or gasoline, we applied the online
questionnaire and thenwe analyzed using exploratoryfactor
analysis.Thefactoranalysisisastatisticmethodusedtoidentify relationshipbetweenmeasured variablesandis italsoa vari-ablereductiontechnique.Inotherwords,itisusedtoexplore the underlying factorstructure of a setof observedvariables
(Malhotra, 2011), inthis paper cases the factors that can be
influencingconsumersfuelchoice.
Wereceived 232 questionnaires, excludingthe incomplete
ones, we hadatotal of 209 forms.Ofthese, 122 individuals
weremen, representing58.4%of thesample.Regardingtheir
maritalstatus,46.4%weremarried,9.1%werelivingwiththeir girl/boyfriend,while38.3%weresingle.Intermsoftheir
edu-cation, 24.9%had aMaster or Doctorate degree, 29.7%had
college-level qualifications, 27.3% hadn’t completed college
and15.3%hadhighschoolqualifications.Themajorityof
par-ticipantswereaged30–39years(40%),while61(29%)were
between20and29yearsold,38(18%)werebetween40and49
years,and25(12%)wereover50yearsold.Noneofthe
par-ticipantswerebelow19yearsold.Bylaw,driversmustbeover 18yearsold,inBrazil.Participantspointedoutwhichfueltype theyusuallyprefertosupplythecar, asaresult50.7%fueled withgasoline,29.7%withethanoland19.6%havenopreference betweenethanolorgasoline.
Weconductedanexploratoryfactoranalysis(EFA)with Vari-maxRotation,usingtheFactorEigenvalues(greaterthan1)to establish thenumberoffactors.Toverify theadequacyofthe
sample,wemeasuredtheKaiser-Meyer-Olkin(KMO)andthe
asanindicatorofinternalconsistence(Hosmer,Lemeshow,&
Sturdivant,2013).
TheEFAresultedinfivefactors,whichexplained62.1%of thevariance.TheBartletttestofsphericityconfirmedthe suit-abilityof performingfactoranalysis(p<0.001)andtheKMO
was0.873,consideredappropriateaccordingtoHosmeretal.
(2013).
Table 2 presents the five factors obtained from the final
analysis,includingtheEigenvalues,thepercentageofvariance explainedbyeachfactorandtheCronbach’salpharesults.
AccordingtoHosmeretal.(2013)thefactorloadingsshould beabove0.50insampleswithapproximately200subjects.Thus, wetookoutthefactorswithloadingssmallerthanit.TheMSA
(Measureof SamplingAdequacy) wasappropriatedtoallthe
variablefactoranalysis,exceptforoneitem“Thefuelqualityis morevaluablethantheprice”thatwasexcludedtotheanalysis. Onepossibleexplanationofwhythisstatementhadalowloading
couldbethemixofinformationqualityandprice;wheresome
participantsbelievethatthequalityismoreimportantthanprice,
butotherpreferpricebecausemayperceivegasolinethesame
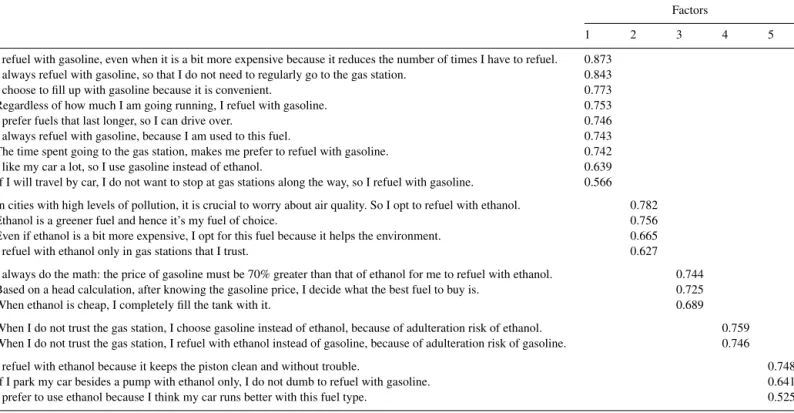
everywhere.InTable3,the22statementsarepresentedtogether withfactorloadingsofeachitem.
The first factor, which was renamed ‘convenience’, has 9
itemsandexplains28.85%ofthevariance.Thisfactorshows
thatindividualsprefertobuyfuelthathasalongerrange;i.e., theyprefertominimizetheirjourneystogasstations.Thechoice offuelthatminimizestheneedtocomebacktothegasstation isalsoevidentinsituationswhereindividualswilldrivelonger, forinstancewhentheyhavetodolongtripsbycar.
Thesecondfactorrenamed ‘cleanfuel’has4items,which
explain15.12%ofthevariance.Thisfactorshowsindividuals
concerned with sustainability, seekingtorefuel withethanol, whichisconsideredasacleanfuel.Insomecases,participants optforthiscleanfuel,simplybecausetheyareagainstthe gaso-line. Although itis nottheir preference,theybelievethat the ethanolfuelhasadditionalenvironmentalbenefits.
The third factor,‘economics’, has 3 items, which explain
7.92%ofthevariance.Thisfactorshowsthatindividualsseek toberationalintheirchoices,seekingtoacquirethemost cost-effectivefuel.Itshowsthatindividualscalculatetofindoutif thepriceof gasolineis0.7times thepriceofethanol.Thisis aneasycalculationthatpeopleusuallycomputetoverifywhich fuelischeaper.
The fourthfactor, ‘trust’,has only2 items, whichexplain 5.37%ofthevariance.Thisfactorrepresentstheamountoftrust thatindividualshaveinthefueltype;theirideasonthisfactor relatetotheperceivedperformanceoftheirvehicles.
Thefifthfactorwasrenamed asthepursuitof‘beliefsand influences’andithad2items,whichexplain4.87%ofthe vari-ance.Thisfactorincludestheterminfluencebecauseitshows
that other individuals may also interfere in the processes of
consumer’sfuel choices.Information orotherindividualscan
influenceaconsumer’schoiceoffueltype.
Onceidentifiedthemostimportantfactorsthatintervenesin theconsumers’choice,nextsectionpresentstheanalysisofthe impactofthesefactorontheprobabilityofchoosingethanolor gasoline.
Impactfactorinchoiceoffuel
In order to calculate the impact of each factor on the
probability of choice of fuel type, we ran two multinomial
logiteconometricmodelswherethedependentvariablewasthe
Table3
Matrixofrotatedcomponents:dimensionsandfactorloadings.
Factors
1 2 3 4 5
Irefuelwithgasoline,evenwhenitisabitmoreexpensivebecauseitreducesthenumberoftimesIhavetorefuel. 0.873 Ialwaysrefuelwithgasoline,sothatIdonotneedtoregularlygotothegasstation. 0.843
Ichoosetofillupwithgasolinebecauseitisconvenient. 0.773
RegardlessofhowmuchIamgoingrunning,Irefuelwithgasoline. 0.753
Ipreferfuelsthatlastlonger,soIcandriveover. 0.746
Ialwaysrefuelwithgasoline,becauseIamusedtothisfuel. 0.743
Thetimespentgoingtothegasstation,makesmeprefertorefuelwithgasoline. 0.742
Ilikemycaralot,soIusegasolineinsteadofethanol. 0.639
IfIwilltravelbycar,Idonotwanttostopatgasstationsalongtheway,soIrefuelwithgasoline. 0.566
Incitieswithhighlevelsofpollution,itiscrucialtoworryaboutairquality.SoIopttorefuelwithethanol. 0.782
Ethanolisagreenerfuelandhenceit’smyfuelofchoice. 0.756
Evenifethanolisabitmoreexpensive,Ioptforthisfuelbecauseithelpstheenvironment. 0.665
IrefuelwithethanolonlyingasstationsthatItrust. 0.627
Ialwaysdothemath:thepriceofgasolinemustbe70%greaterthanthatofethanolformetorefuelwithethanol. 0.744 Basedonaheadcalculation,afterknowingthegasolineprice,Idecidewhatthebestfueltobuyis. 0.725
Whenethanolischeap,Icompletelyfillthetankwithit. 0.689
WhenIdonottrustthegasstation,Ichoosegasolineinsteadofethanol,becauseofadulterationriskofethanol. 0.759 WhenIdonottrustthegasstation,Irefuelwithethanolinsteadofgasoline,becauseofadulterationriskofgasoline. 0.746
Irefuelwithethanolbecauseitkeepsthepistoncleanandwithouttrouble. 0.748
IfIparkmycarbesidesapumpwithethanolonly,Idonotdumbtorefuelwithgasoline. 0.641
Table4
Modelbaseintheethanolchoice.
Ethanol–gasoline Ethanol–mixed
Coefficient Standarddeviation Significance Coefficient Standarddeviation Significance
Constant 1.238 0.284 0.000* 0.262 0.328 0.425
Convenience 2.547 0.389 0.000* 1.131 0.367 0.002*
Cleanfuel −1.138 0.270 0.000* −0.975 0.260 0.000*
Economics −0.230 0.286 0.422 0.423 0.298 0.156
Confidence 0.789 0.263 0.003* 0.022 0.257 0.932
Beliefs −1.644 0.306 0.000* −0.668 0.273 0.014*
LRstatistic=144.47(p<0.00).
Note:*Thesignificancethresholdwassetat.05.
chosen fuelandthe independentvariableswere thescores of
the fivefactorsidentified inthe previoussection. Werunthe regressionanalysisusingSPSS.Thefactorscoresaremeasures
of each factor attributed to the observations. Hosmer et al.
(2013)statethatscoresaremeasuresthatcanbeusedforfurther
analysisusingfactoranalysistorepresentallvariableswiththe correspondingfactorloads.
Weusedtheregressionmodeldescribed: Fuel:j=0–Ethanol,1–Gas,2–Mix. Subjects:i=1,2,...,216.
Factors:p=1,2,3,4,5.
Linearestimatorofsubjecti:Xiβj
ProbabilityoftheIndividualichosethefuelj:
Pr(Yi=j)=Pij=
exp(Xiβj)
1+jk
=0exp(Xiβk)
Theestimatedmodelwasgloballyvalidbecausethestatistical maximumlikelihood(LRstatistic)wassignificantaspresented
inTable4.TheR2ofMcFaddenindicatesthatthemodelhasa
goodfit(0.337).Thechoiceofethanolistheomittedvariable sothatallresultsshouldbeanalyzedwithrespecttothischoice. Toverifyiftherewerelimitationstologisticregression,we per-formedacrosstabsanalysisandtherewerenorestrictionsonthe goodness-of-fitregardingtheuseofthemodel.WeruntheSPSS
NOMREGinstructionandtheresultsshownoseriousviolation
oftheassumptionoflinearityofthelogit.
Theresultsshow thatthe conveniencefactorincreasedthe probabilitythattheconsumerchoosesgasolinefirstandasa sec-ondoptionchosethemixedfuel(ethanolandgasolinetogether). Contrarytothisresult,theappealofcleanfuelreducedthe like-lihoodofgasolinechoiceandmixedfuelrespectively.Forthis sample,theeconomicsfactorwasnotasignificantfactorinthe choiceofthetwofueltypes;inotherwords,participantsseems nottoworrywiththepriceduringtheirchoice.However,the neg-ativebetashowsthatiftheethanolishighthereisatendency ofconsumersprefersgasoline.Theconfidencefactorincreased thelikelihoodofexclusivelychoosinggasoline,butitwasnot significant for mixed fuel. On the otherhand, the belief fac-torreducedtheprobabilityofchoosinggasolineandmixedfuel respectively.Inthenextsection,wepresentsomeextraanalysis relatedtodemographicdifferencesbetweensubjects.
Table5
Comparinggenders.
Anovatest Averagescore
F Sig. Male Female
Convenience 5.051 0.026* 2545 2853
Cleanfuel 0.241 0.624 2709 2770
Economics 6.339 0.013* 2213 2510
Confidence 0.656 0.419 3467 3353
Beliefs 8.979 0.003* 2332 2516
Note:*Thesignificancethresholdwassetat.05.
Demographicdifferences
Weanalyzedvariousdemographicquestionsandfoundthat
genderinterfereswiththeprocessofchoosingfuel.Werunan
ANOVAwiththeintentiontocheckfordifferencesinchoices
of fueltypebetweenmenandwomen.Beforeperformingthe
ANOVA,theLevene’stestwasperformed.Forallfactors,thep valueswerelowerthan0.10,whichconfirmedthesuitabilityof
usingANOVA.
Wefoundastatisticallysignificantdifference(p-value<0.05)
between genders in the factors convenience, economics and
beliefs. Table5 showsthe means for men andwomen of all
thefuelchoicefactors.Itcanbeobservedthatinthethree
fac-tors mentioned(convenience,economicsandbeliefs),women
hadsignificantlyhighermeanscoresthanmen.Thefindingsof theresearchontheissueofconvenienceareconsistent;women preferorvalueconvenienceinboththeirchoiceofgasstations andaswellasfueltype.
Discussion
Inthissection,firstwepresentasummaryoftheresults,then
we discussthesefindingsbased ontheframeworksof energy
technology diffusion/transitionandsupplychain management
previouslypresentedinthetheoreticalbackground,withthe pur-posetoexplorepossiblecausesofthesecondsetbackinBrazilian ethanolindustry.
With the technology of flex fuel engine,more consumers
hadtochoosebetweenortheproportionofgasolineorethanol
(Nascimentoetal.,2009)duringacarsrefuel.Withthat,anew
challengedappeared tothe supplychain management:
under-standtheconsumer’spreferencesandperceptions(Geels,2004).
thenature of demand(Fisher, 1997).Basedonthat,using an
exploratorystudy we exploredmotivesinhow consumersact
andthinkaboutrefuelingtheircars.Withdeepinterview,four
main categories related toflex cars owner perspectives were
formed: the purpose of using car, the period or reasons for
beingrefueling thecar, the motivesforchoosing onetypeof
fuelagainstotherandtheprocessofchoosingthegasstation. Amongthesecategoriesitwaspossibletoobservesubcategories
suchas economic perspectiveor conveniencebeing in
agree-mentwithSalvoandHuse(2013)idea.So,asecondempirical
studywasruntodefinetherealdriversthatinfluenceconsumer choice.Usingstatementsdevelopedbytheinterviews,intothe motivesforchoosingafuelcategory,statementswerepresented inaquestionnairetoflex ownercars.Asaresult,fivedrivers
wereuncovered:convenience,cleanfuel,economics,trustand
beliefs.Knowing consumer’sbehavior,wewereabletoruna
logitregressionthatshowedthattheeconomicsdriverwasnot
influencingconsumer’schoice.ThatmeansBrazilianflex-fuel
vehicleownersseemsnottomakeeconomicallyrational
deci-sionas commentedby afewresearchers(e.g.Salvo&Huse,
2011), and in opposite perspective to mind-set of Brazilian
governmentandethanolindustrial(e.g.UNICAcommentson
media).
With these results, our research has revealed that another
probablecauseofthesecondsetback,amongmanyalready
com-mented by otherresearchers, usually relatedto supply chain
(Alonso-Pippoetal.,2013)wasanincorrectperceptionoffuel
consumers’preferencesbykeystakeholders.Inoursurvey,FFV
ownersconsideredfactorssuchasConvenienceandCleanFuel
asmorerelevantthanPriceinchoosingbetweenethanolor
gaso-line. However, the second setback demonstrated clearly that
largeprice hikes canundermine thedominance of other
fac-torsinconsumers’decision.Ontheotherhand,thestatements bykeystakeholdersindicatethat intheinitialphaseof
diffu-sionof FFV,thesestakeholdersbelievedthat FFVtechnology
hadempoweredcarownerstochoosethemoreeconomicalfuel.
FFVcarownerswouldnotbelocked-inaswiththeethanol-only
carownersofthe80s/90s.Theyassumedthattheseconsumers
couldgainmucheconomicallybyrationallychoosingtheright
fuel.Therefore,theethanolsupplychaindidnothavetobe con-cernedwiththepriceoscillationssince,asmillsownersargued, thesearenaturalphenomenonforanagriculturalproduct.Asa resultof thisbelieve,strategic ethanolstockpile hasnotbeen
implemented,eventhoughithasbeendiscussedinmany
occa-sionsbytheethanolsupplychain’sdecisionmakersandthereis storagecapacityintheethanolsupplychain(Lucas-dos-Santos, 2013).Asaconsequence,theoccurrenceofviolentethanolprice
oscillations in2009 and2010 that causeda threeyears
con-secutivedeclineofethanolconsumption(duringthisperiodthe consumptionofgasolinehadsignificantgains)andmaybethatis
whyin2012,whenourdatawascollected,FFVowners
consid-eredthePricenotsorelevant.OurhypothesisisthattheseFFV ownershadsettledintoaroutinebypurchasinggasolineafter 2009.Ourresultsarenotablebecausetheyshowthatconsumers arenotonlyconcernedwitheconomicissuesbutalsowithother issuessuchasreliability,convenience,sustainabilityandbeliefs.
Therefore,understanding consumers’ preference could better
preparemanaging ethanolsupply chain andpotentiallyavoid
thesetback.
Our survey identified attributes that are relevant for FFV ownersinfuelselection.Notethattheethanolsupplychaincan
only starttodiscuss how to dealwith aproblem if it
recog-nizestheproblem.Supplychainfactorsarethosethatthesupply
chain management has morecontrol over such as economics
(more specifically the productionand distributioncosts, thus theprice),convenience(specificallytheFFVrange),and envi-ronmentalsustainability. Inordertoimprovethemarketshare of ethanol,theethanol supplychainshouldexploit these fac-torsthatitcancontrolsuchaslowerethanolprice,improving convenience,highlighting theenvironmentalsustainability. In
the following paragraphswe offer suggestions, based on our
researchresults,forstrategymanagementofBrazilianethanol supplychainandforpublicpolicyrelatedtoethanolregulation. Withregardtotheethanolprice,theethanolsupplychainhas beensuccessfulinreducingethanolproductionanddistribution costs through incrementalinnovations inthe last forty years, butnotso indecreasingthe amplitudeofethanolprice varia-tions.Theinvestmenttoreducepriceoscillation(e.g.,strategic stockpileofethanol)requiredcanbequitelarge,butitshouldbe justifiedwiththepossiblelossofrevenuefortheethanolsupply chainifanothersetbackoccurs.
Anotherwaytodealwiththeproblemofethanolprice oscilla-tionistolookatthecompetinggasolinesupplychain.Oneofthe problemswiththeethanolpriceoscillationisthatthecompeting product,gasoline,hasastablepricemaintainedbygovernment.
The Brazilian government’s aim was tocontrol the inflation.
However,thispolicyhascreatedanunevenplayingfieldagainst
ethanol. Thisis more serious dueto the existence of natural
seasonalpriceoscillationofethanolduetoitsproductioncycle whichdoesnotoccurredwithgasoline.
Alongwiththeeconomicfactor,anothertopethanolsupply chainrelatedfactorforFFVownersistheconvenience.Byusing ethanol,therefuelingfrequencyishigherduetoitslowerenergy
density.ThisisinconvenientforFFVowners.Onesolutionto
improve the convenience isto increasethe engine efficiency,
whenburningethanol,aswehavealreadymentioned.This solu-tionimpliesthattheethanolsupplychainshouldhaveanactive
participationinthedevelopmentof futureethanolconsuming
technologies, for example, sponsoring research programs in
developingimprovedethanol internalcombustionenginesfor
hybrid electriccars. Anothersolution is toinfluencethe
per-ceptionoftheFFVownerswithregardtothe“inconvenience”
of refuelingwithethanol.Manyotherservicesectors employ
techniquestoreducetheinconvenienceperceivedbyclients.A classiccase isthat the perceptionof waitingtimeinaqueue
canbe influencedby someentertainmentssuch watchingTV
(Thomke, 2003).Brazilianethanolsupply chainmanagement
cancertainlylearnfromtheseexperiencesinmanagingclients’
perceptions in order toimprove its competitiveness with the
gasolinesupplychain.
thisperceptionthroughitscommunicationwiththepublic.In consumerdecisionmakingtheissueoftrade-offisatraditional
themeinmarketing literaturesince it documentsthe positive
relationshipbetweenpriceandperceptionsofquality.Priceand qualitytendtobeseenasatrade-offthat requires
relinquish-ingsomething(convenience)forsomethingelse(environmental
sustainability).
Our survey indicates that there are different segments of
FFVowners,forinstancethedifferentchoicebehaviorbetween
genders.FemaleFFVownersrateconveniencemoreimportant
thanmeninchoosingfuel.Thisresultcorroboratestheideaof
DommeyerandGross(2003)whoarguethatgendershouldbe
consideredasakeyvariableinstudiesof consumerbehavior.
A segmented marketing strategy should be employed by the
ethanolsupply chaintomanage the communicationwith
dif-ferentsegmentsofethanolconsumers.Inaddition,theethanol
supply chain should havequantitative measures of trade-offs
betweenpriceandenvironmentalsustainabilityforFFVowners
indifferentsegments.Thesedatacanalsoberelevantinmaking ethanolsupplychainstrategicdecisions.Forinstance,in decid-ingonhowmuchtoinvestinethanolstockpilingcapacity,the ethanolsupplychainneedstohaveanestimateoftheamountof additionalethanolrevenuewithagivenpricereductionprovided bystockpile.
Finally,alltheimplicationsdiscussedaboverequirethatthe Brazilianethanolsupplychainbeableto:first,makestrategic
decisionsbasedontheseimplications,andsecond,implement
theminatimelyandcoordinatedway.Thishastodowiththe
governanceoftheethanolsupplychain.Basedonwhathappened inthelastsetback,thisgovernanceof,orcoordinationin,the Brazilianethanolsupplychainisstillnotmatureifwecompare withthat of gasoline supplychain (Lucas-dos-Santos, 2013).
Usingthelanguageofsupplychainmanagement(Lee,2004),
theBrazilianethanolsupplychainshouldbeafasterlearneras
ameantobemoreadaptabletoadynamiccontext.
Conclusions
Themainresearchquestionsofthispaperare:first,howdo driverschoose fuelsinrefuelingtime? Second,isthe
percep-tion ofethanol supplychain managersabout their consumers
correct?Thesearethekeyquestionstobeansweredinorderto understandpossiblecausesoftheset-backsinBrazilianethanol supplychain.Ourresultsshowthattherewasasignificant
dif-ferencebetweenthe actualpreferencesoffuelconsumersand
theperceivedconsumers’preferencesbykeystakeholdersinthe lastsetbackoftheBrazilianethanolsupplychain.Basedonthe literaturesofenergytechnologydiffusion/transition,andsupply
chainmanagement,weexploretheimplicationsof this
differ-enceongovernmentpolicyandethanolindustry’ssupplychain
strategy.Ourresearchmethodisbasedonaliteraturereviewon
the eventsoccurredbefore andduringthe second set-backin
ordertoidentifythesupplychainkeystakeholders’perceptions ofconsumers’preferences,plusaqualitativeandaquantitative studyonBrazilianfuelconsumerpreferences.
Thispaper contributes tothe extant researchincleanfuel
diffusionby showingthe relevanceof consumers’ preference
incoordinatinganemergingethanolsupplychainwhich
incor-porates somesignificant technologicalinnovations inthe last fewdecades.Anothercontributionofthispaperisthe integra-tionofthetheoriesofenergytechnologydiffusion/transitionand supplychainmanagementinordertounderstandtheroleof
con-sumers’preferencesintheethanolindustry’sperformanceand
itsimplicationsonpublicpolicy.
WeagreedwithCollantes(2010)thatpublicpoliciesshould containavaluepropositionmorerobustthanjusttheeconomic incentivestoencourageethanolconsumption.Withourresults, thefirstconsequencefortheethanolsupplychainmanagementis theneedtohaveasystemtomonitorandforeseecarusers’ pref-erence.Thismonitoringshouldbeperiodicsotheethanolsupply
chain can trace thechanging mood of consumersof ethanol,
identifythecorrectcausesandtakeappropriateactionsto
mit-igate possiblenegativeimpacts. Webelievethat conventional
marketing researchtechniques canbe employedfor this
pur-pose.Inparticular,theethanolsupplychainshouldpaidspecial
attention totechnologicalinnovation’simpacton carowners’
routine.In thetwosetbacksinBrazilianethanolsupplychain
discussed inthis paper, weobserved that bothoccurred after
ademandboomcausedbyanewethanolconsuming
technol-ogy andsubsequentethanolsupplybottleneck.Therefore,the
ethanol supplychain should monitor newethanolconsuming
technologiesthatcanup-setcarowners’ethanolpurchase rou-tine,andshouldassessthepossibleimplicationsfortheethanol
supply chain andthenrecommendadaptationsof the ethanol
supplychaintothenewtechnology.Severalethanolconsuming
innovations areinthe developmentstageandallof themcan
affectcarowners’purchasingroutine.Amoreefficientethanol
enginewouldhaveabiggerrangeforthesameamountof
bio-fuel,andthusmoreconvenientforcarowners.Thisnewtypeof ethanolenginecanalsobeusedinhybridelectricvehicleswhich wouldofferaquitedifferentsetofattributestoconsumersthana conventionalethanol-onlycar.Therefore,theBrazilianethanol
supplychainshouldmonitor, orevenshouldcontributetothe
developmentofthesenewtechnologies,andanalyzesthe
possi-bleconsequencesforcarownersandadaptstheethanolsupply
chainstructureinordertoavoidarepetitionofthefirstsetback inthe90s.
Inmonitoringtheevolutionofnewethanolconsuming
tech-nologies and other relevant events, the ethanol supply chain
shouldpayparticularattentiontothedynamicsof supplyand
demandofethanol.Asweobservedinbothsetbacks,onceanew technologyhadbeenwidelyacceptedbytheconsumers,therate
ofincreaseinethanoldemandhadbeenmuchhigherthanthat
ofsupplycapacity.Thisfacthadcreatedthemismatchbetween
demandandsupplywhichwastheroot-causeofthesesetbacks.
Toexpandethanolsupplycapacity,amillneedsfirsttoexpand itssugarcaneplantationandthentobuildnewethanol produc-tioncapacity.Theseactivitiestakeatleastthreetofouryears.
Thesedifferencesinthedynamicsofdemandandsupplyneed
tobe includedinthe planningof ethanolsupplychain which
requires asolid marketandtechnologyintelligencesystemin
place.
statewhichismorewell-educatedpeoplefromthericheststate
of Brazil. Although we focus on São Paulo consumers, it is
importanttonotethatthisisthemaincenterofconsumptionof
ethanol(hydrousandanhydrous)inBrazil.AccordingtoANP
(datafrom2010),25%ofthetotalsalesofgasolineC(thathas ethanol)and56%of thetotalsalesof hydratedethanolinthe
countryisconsumedinSãoPaulo.
Notethatthispaperdidnotaimtoexploreallthemotivesthat couldhadcausedthesecondsetback,webelievethatthereare manycauses,forinstanceeffectofefficiencyorinefficiencyin thesupplychain,foodindustryeconomyimpactinthe agricul-turefield,gasolineprice,governmentregulation,impactofother derivativesoftheoilinthemarket,etc.Allthesepossibilities shouldbeexploredinfuturestudies.Ourobjectiveherewasto
showthatamongmanypossiblecauses,onehadbeenforgotten
bytheresearchers: theconsumers’preference.Relatedtoour
study,wealsosuggestthatalongitudinalconsumerpreferences
studycouldbringagoodviewinhowdriveractduring
oscil-lationprices.Hence,culturedifferencescouldalsobeexplored sinceenvironmentalcognitionsaredifferentineachcountry.
Conflictsofinterest
Theauthorsdeclarenoconflictsofinterest.
AppendixA. Semi-structureguide–Qualitative research
1. Doyouhaveacar?
2. Whichcardoyouhave?
3. Howdidyouchoosetopurchasethiscar?
4. Isyourcaraflexfuelmodel?
5. Whydidyoupurchaseaflexfuelmodelcar?
6. Whatisyourcarfor?
7. Whatisthedateofyourthelastfullfueled? 8. Describehowdidyouchoosethetypeoffuelused. 9. Whydidyouchoosethistypeoffuel?
10. How much gas/ethanol you still had on tankbefore full
fuelingit?
11. Whichtypeoffueldidyouusedinyourpenultimatetime?
Why?
12. Whatfactorsinfluenceyouwhenyouarebuyingfuel?
13. Howdoyouthinkpeopleusuallyselectthetypeoffuel? 14. Inwhatsituationsdoyouchangeyourconsumptionroutine.
15. Whatisyourmonthlyexpenditureonfuel
16. Demographics:gender,age,education,placeofresidence
andmaritalstatus
References
Anderson,S.T.(2012).Thedemandforethanolasagasolinesubstitute.Journal ofEnvironmentalEconomicsandManagement,63,151–168.
Aguilar,F.X.,Cai,Z.,Mohebalian,P.,&Thompson,W.(2015).Exploringthe drivers’sideofthe“blendwall”:USconsumerpreferencesforethanolblend fuels.EnergyEconomics,49,217–226.
Alonso-Pippo,W.,Luengo,C.A.,Alberteris,L.A.M.,Pino,G.G.,&Duvoisin Junior,S.(2013).Practicalimplementationofliquidbiofuels:The transfer-abilityoftheBrazilianexperiences.EnergyPolicy,60,70–80.
Balat,M.,&Balat,H.(2009).Recenttrendsinglobalproductionandutilization ofbio-ethanolfuel.AppliedEnergy,86(11),2273–2282.
Camargo,A.S.,Yu,A.S.O.,Nascimento,P.T.S.,Belinetti,J.V.,Marques, J.J.,&Morilhas,L.J.(2011).OptionvalueembeddedontheBrazilian flexandsustainablevehicles.InternationalJournalofSocialEcologyand SustainableDevelopment,2(3),18–33.
Chopra,S.,&Meindl,P.(2013).Supplychainmanagement:Strategy,planning, andoperation(5thed.).NewJersey:Pearson.
Collantes,G.(2010).Dogreentechpoliciesneedtopasstheconsumertest? Thecaseofethanolfuel.EnergyEconomics,32(6),1235–1244.
Croson,R.,Donohue,K.,Katok,E.,&Sterman,J.(2014).Orderstabilityin sup-plychain:Coordinationriskandtheroleofcoordinationstock.Production andOperationsManagement,23(2),176–196.
Dommeyer,C.,&Gross,B.(2003).Whatconsumersknowandwhattheydo: Aninvestigationofconsumerknowledge,awareness,anduseofprivacy protectionstrategies.JournalofInteractiveMarketing,17(2),34–51. Fisher,M.L.(1997).Whatistherightsupplychainforyourproduct?Harvard
BusinessReviews,3,105–116.
Fouquet, R. (2010). The slow search for solutions: Lessons from his-torical energy transitions by sector and service. Energy Policy, 38, 6586–6596.
Furtado,A.T.,Scandiffio,M.I.G.,&Cortez,L.A.B.(2011).TheBrazilian sugarcaneinnovationsystem.EnergyPolicy,39,156–166.
Geels,F.W.(2004).Fromsectorialsystemsofinnovationtosocio-technical sys-tems:Insightsaboutdynamicsandchangefromsociologyandinstitutional theory.ResearchPolicy,33,897–920.
Goldemberg,J.,Coelho,S.T.,Nastari,P.M.,&Lucon,O.(2004).Ethanol learningcurve—TheBrazilianexperience.BiomassandBioenergy,26(3), 301–304.
Gonzalez,A.O.,Berna,K.,&Wetzstein,M.E.(2012).Apublicpolicyaid forbioenergyinvestment:Casestudyoffailedplants.EnergyPolicy,51, 465–473.
Hosmer,D.W.,Jr.,Lemeshow,S.,&Sturdivant,R.X.(2013)..Appliedlogistic regression(vol.398)JohnWiley&Sons.
Hira,A.,&DeOliveira,L.G.(2009).Nosubstituteforoil?HowBrazil devel-opeditsethanolindustry.EnergyPolicy,37(6),2450–2456.
Hodbod,J.,&Adger,W.N.(2014).Integratingsocial-ecologicaldynamicsand resilienceintoenergysystemsresearch.EnergyResearch&SocialScience, 1,226–231.
Lee,H.L.(2004).Thetriple–Asupplychain.HarvardBusinessReview,12(10), 102–112.
Lopes,M.B.,daSilva,A.L.,&Conejero,M.A.(2010).Fluxosepodernos canaisdedistribuic¸ãodeetanolcarburante:Umestudoqualitativonoestado deSãoPaulo.RevistadeAdministra¸cão,45(4),356–372.
Lucas-dos-Santos,L.A.(2013).Oamadurecimentodosuprimentode biocom-bustíveissobaóticadagestãoestratégicadeopera¸cões:Umestudodos revesesdoetanolnoBrasilapós2005.SãoPaulo,225p.Disserta¸cãode Mestrado,FEA,USP.
Malhotra,N.(2011).Marketingresearch:Anappliedorientation(6thed.).New Jersey:UpperSaddleRiver.
Markard,J.,&Truffer,B.(2008).Technologicalinnovationsystemsandthe multi-levelperspective:Towardanintegratedframework.ResearchPolicy, 37(4),596–615.
Myers,M.(2013).Qualitativeresearchinbusiness&management(2nded.). LosAngeles:Sage.
MinistériodeMinaseEnergias(2013)ResenhaEnergéticaBrasileira–Edic¸ão de29demaiode2013–Exercíciode2012.Availableathttp://www.mme. gov.brmmegaleriasarquivospublicacoesBEN3-ResenhaEnergetica 1-ResenhaEnergetica.pdf.
Moreira,J.R.,Pacca,S.A.,&Parente,V.(2014).Thefutureofoilandbioethanol inBrazil.EnergyPolicy,65,7–15.
Nascimento,P.,Yu,A.,Quinello,R.,Russo,R.F.S.,Nigro,F.,&Lima,N. (2009).Exogenousfactorsinthedevelopmentofflexiblefuelcarsasalocal dominanttechnology.JournalofTechnologyManagement&Innovation, 4(4),110–119.
Samanez,C.P.,daRochaFerreira,L.,doNascimento,C.C.,deAlmeidaCosta, L.,&Bisso,C.R.(2014).EvaluatingtheeconomyembeddedintheBrazilian ethanol–gasolineflex-fuelcar:Arealoptionsapproach.AppliedEconomics, 46(14),1565–1581.
Salvo,A.,&Huse,C.(2011).Isarbitragetyingthepriceofethanoltothat ofgasoline?Evidencefromtheuptakeofflexible-fueltechnology.Energy Journal,32(3),119–148.
Salvo,A.,&Huse,C.(2013).Buildit,butwilltheycome?Evidencefrom consumerchoicebetweengasolineandsugarcaneethanol.Journalof Envi-ronmentalEconomicsandManagement,66,251–279.
Silva,A.T.B.D.,Spers,R.G.,Wright,J.T.C.,&Costa,P.R.D.(2013). Prospectivescenariosfortheethanolinternationaltradein2020.Revistade Administra¸cão(SãoPaulo),48(4),727–738.
Silva,A.T.B.,Caldeira,C.A.,&Bandeira-de-Mello,R.(2014).Formulac¸ãoe Execuc¸ãodeEstratégiasPolíticasnoSetordeEtanol:UmModelo Proces-sual.RevistadeAdministra¸cãoContemporânea,18,22.
Soares, S. D. S. S., & Saes, M. S. M. (2015). Distribuic¸ão de com-bustívelnoestadodeSãoPaulo:Estruturasdegovernanc¸aemecanismos complementares de coordenac¸ão. Revista de Administra¸cão, 50(2), 241–253.
Thomke,S.(2003,April).R&Dcomestoservices:BankofAmerica’spath breakingexperiments.HarvardBusinessReview,3–11.
VanderKroon,B.,Brouwer,R.,&VanBeukering,P.J.(2014).Theimpactofthe householddecisionenvironmentonfuelchoicebehavior.EnergyEconomics, 44,236–247.
Van den Wall Bake, J. D., Junginger, M., Faaij, A., Poot, T., & Wal-ter, A. (2009). Explaining the experience curve: Cost reductions of Brazilian ethanol from sugarcane. Biomass and Bioenergy, 33(4), 644–658.