StakeMeter: Value-Based Stakeholder
Identification and Quantification Framework
for Value-Based Software Systems
Muhammad Imran Babar1, Masitah Ghazali1*, Dayang N. A. Jawawi1, Kashif Bin Zaheer2
1Department of Software Engineering, Universiti Teknologi Malaysia, Johor, Malaysia,2Department of Mathematical Sciences, Universiti Teknologi Malaysia, Johor, Malaysia
Abstract
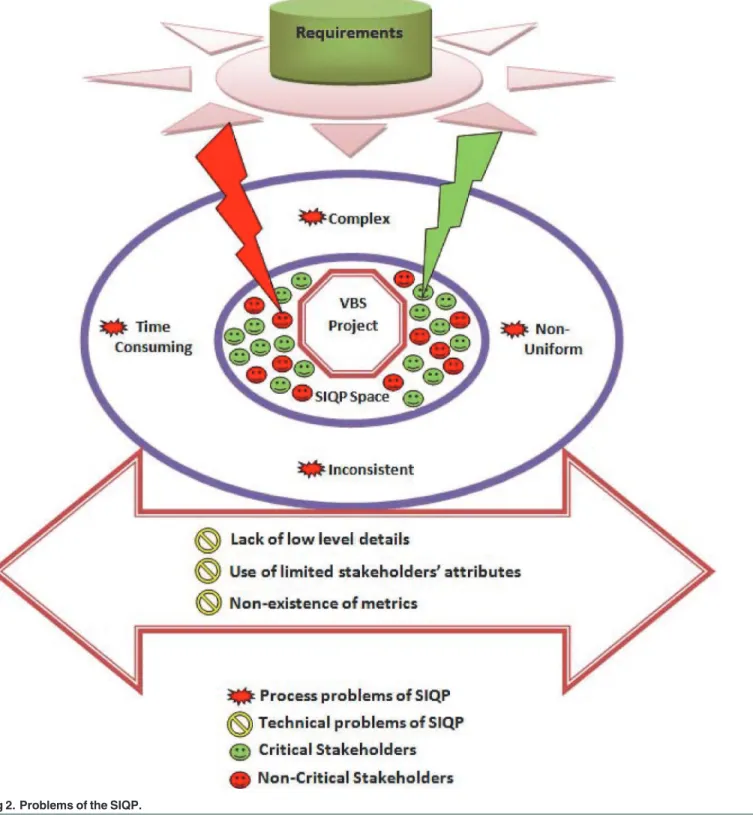
Value-based requirements engineering plays a vital role in the development of value-based software (VBS). Stakeholders are the key players in the requirements engineering process, and the selection of critical stakeholders for the VBS systems is highly desirable. Based on the stakeholder requirements, the innovative or value-based idea is realized. The quality of the VBS system is associated with the concrete set of valuable requirements, and the valu-able requirements can only be obtained if all the relevant valuvalu-able stakeholders participate in the requirements elicitation phase. The existing value-based approaches focus on the de-sign of the VBS systems. However, the focus on the valuable stakeholders and require-ments is inadequate. The current stakeholder identification and quantification (SIQ) approaches are neither state-of-the-art nor systematic for the VBS systems. The existing approaches are time-consuming, complex and inconsistent which makes the initiation pro-cess difficult. Moreover, the main motivation of this research is that the existing SIQ ap-proaches do not provide the low level implementation details for SIQ initiation and stakeholder metrics for quantification. Hence, keeping in view the existing SIQ problems, this research contributes in the form of a new SIQ framework called‘StakeMeter’. The Sta-keMeterframework is verified and validated through case studies. The proposed framework
provides low-level implementation guidelines, attributes, metrics, quantification criteria and application procedure as compared to the other methods. The proposed framework solves the issues of stakeholder quantification or prioritization, higher time consumption, complexi-ty, and process initiation. The framework helps in the selection of highly critical stakeholders for the VBS systems with less judgmental error.
Introduction
In the Requirements Engineering (RE), the functional and non-functional goals are docu-mented and analyzed in order to develop a new system [1,2]{Wiegers, 1999 #64}. The well doc-umented and right requirements have a prominent effect on the quality of the software [3,4].
OPEN ACCESS
Citation:Babar MI, Ghazali M, Jawawi DNA, Zaheer KB (2015) StakeMeter: Value-Based Stakeholder Identification and Quantification Framework for Value-Based Software Systems. PLoS ONE 10(3): e0121344. doi:10.1371/journal.pone.0121344
Academic Editor:Cheng-Yi Xia, Tianjin University of Technology, CHINA
Received:October 12, 2014
Accepted:February 10, 2015
Published:March 23, 2015
Copyright:© 2015 Babar et al. This is an open access article distributed under the terms of the Creative Commons Attribution License, which permits unrestricted use, distribution, and reproduction in any medium, provided the original author and source are credited.
Data Availability Statement:All relevant data are within the paper.
Funding:The authors have no support or funding to report.
The RE process is a combination of different activities or phases which when performed in col-laboration results in a requirements document. The different phases of the RE process are elici-tation, analysis, specification, validation and management [5,6].
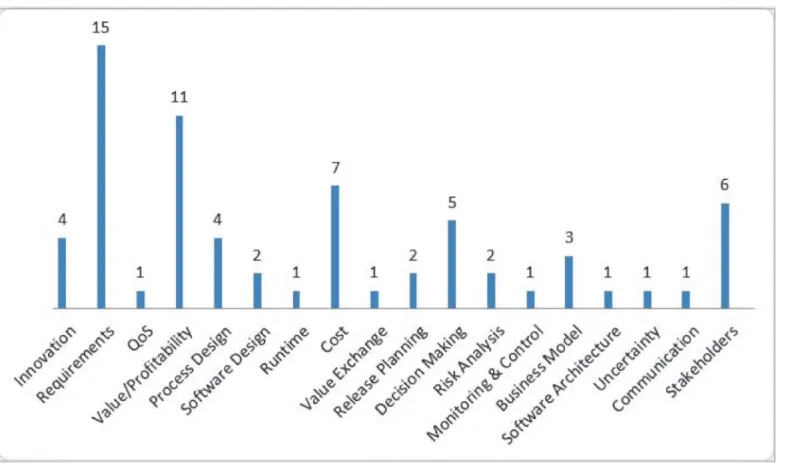
The VBS systems are the part of value-based software engineering (VBSE). The definition of VBSE given by Barry Boehm is“the explicit concern with value concerns in the application of science and mathematics by which properties of computer software are made useful to the peo-ple”[7]. Hence, a VBS system is one that provides useful software properties to the intended stakeholders. The VBS systems are based on an innovative or value-based idea and are associat-ed with the economic leverage. The implementation of an innovative or value-basassociat-ed idea is dif-ficult in terms of high uncertainty. It is difdif-ficult to guess that either the innovative or value-based idea will yield the economic benefit or not. In the VBS systems, the involvement of rele-vant stakeholders can play a vital role in the quality improvement [8] and value-based software requirements engineering (VBSRE) practices. The case of the VBS systems is very sensitive be-cause they are usually part of the distributed environments due to the diverse locations of the stakeholders. In such cases, it is very difficult to consider all the stakeholders who have little stakes in the development of the VBS system. (Fig. 1) summarizes the research on the VBS sys-tems and shows the frequency of the research conducted on different issues in order to design high-quality VBS systems. The research in the domain of VBS development mainly focuses on requirements, profitability, cost and decision-making. The VBSRE approaches do not focus on the stakeholder analysis. There are few studies that focus on the significance of the stakeholders for the VBS systems, but do not propose any framework or approach for the stakeholder
Fig 1. Issues highlighted in the VBS Research.
identification and quantification (SIQ) process. There is the need to integrate the stakeholder analysis with the VBSRE for better RE practices.
Stakeholders are the key element in the success and failure of the software. Hence, the high priority is given to the stakeholders in the Star Triangle in [9]. A comprehensive analysis of the SIQ problems is discussed in [10] for the VBS development and it is forced that“to characterise the stakeholders based on the responsibilities”,“to propose the stakeholders’metrics to make the SIQ process easy”and“to propose an SIQ framework in easy steps”for the VBS systems. Freeman defines a stakeholder as“any group or individual who can affect or is affected by the achievement of the organization’s objectives”[11]. Tom Gilb defines a stakeholder as“any per-son or organizational group with an interest in, or ability to affect, the system or its environ-ment”[12]. The stakeholder or customer satisfaction related to the VBS system mainly depends on the selection of highly critical requirements. In order to satisfy the customers, the selection of highly valuable stakeholders is essential in the requirements elicitation phase (REP). In order to gain the market leverage, the trustworthiness of the system must be high. The VBS trustworthiness or reliability is taken as a quality measure as trustworthiness or reliability of cloud service is considered as a quantitative quality measure in the case of cloud computing [13]. The cloud computing is also a part of the value-based paradigm and the trustworthiness of the cloud services is highly desirable. Same is the case with the stakeholders with respect to the trustworthiness. However, the current SIQ techniques cannot be adopted as a standard be-cause they are not standardized, applied and tested in a real time environment. Hence, the suit-ability of the existing SIQ techniques for the VBS systems is questionable. The VBS systems are associated with the economic leverage, thus all the entities cannot be taken at par. For the VBS systems, only the key stakeholders are considered during the requirements analysis phase. It is not easy to decide which technique is suitable for the VBS development. The selection of a tech-nique as a model is very difficult because some methods are just characterizing the stakeholders instead of the quantification [14,15]. Enough work is done with respect to the value-based re-quirements prioritization or quantification in different research studies like [16–19]. However, the work in the domain of value-based stakeholder prioritization or quantification is
not sufficient.
The rest of the paper is divided into 9 sections. Section 2 discusses the SIQ research back-ground. The detail of the proposed SIQ frameworkStakeMeteris given in Section 3. Section 4 is about stakeholder factor formulation. The description of inclusion and exclusion criteria of stakeholders is given in Section 5. Section 6 describes the implementation guidelines. The de-tails of the case studies are given in Section 7. The dede-tails of performance analysis of the Stake-Meterare given in Section 8. Section 9 highlights the future research directions. The last section, Section 10 concludes this study.
Research Background
stakeholders into eight categories like dormant stakeholders, discretionary stakeholders, de-manding stakeholders, dominant stakeholders, dependent stakeholders, dangerous stakehold-ers, definitive stakeholders and non-stakeholders [21]. Mitchell’s model is a very basic initial model for stakeholders’identification and lacks in low level details.
Ballejos and Montagna presented a technique based on the roles and types for the SIQ at inter-organizational level [26–28]. The stakeholders are quantified based on key attributes of function, knowledge abilities, geographical position and hierarchy level. The technique induces the problem of competency measurement among all four aspects. Moreover, the technique is not cost-effective in terms of time utilization.
The PisoSIA (Stakeholder Identification and Analysis) technique is an extension in an exist-ing technique called PISO (Process Improvement for Strategic Objectives) [29]. The technique does not focus on the SIQ process. The technique focuses on the identification of new stake-holders when a change is required in the existing functionality of a system. However, the im-portance of the stakeholders is not denied. Boonstra (2006) conducted a research called “ERP-implementation project from a stakeholder perspective”. In this research, a technique is pre-sented based on the Mitchell’s model to classify the stakeholders at a higher level of abstraction [30]. In this technique, the new stakeholders are identified based on the induced change and the impact of the change is measured on the existing stakeholders.
Glinz and Wieringa quantified stakeholders into three major categories i.e. critical, major and minor [31]. However, the process level details are not given for the SIQ. An abstract pic-ture of the identification and classification model is depicted. Thus, it is difficult to adopt the model when a project or product requires an agile environment in terms of its execution, im-plementation or development. Woolridgeet al. (2007) divide stakeholders into high level major categories based on their induced risk. The research does not provide in depth process level details for classification of stakeholders. The reported stakeholder categories are financial supporters, customers, internal stakeholders, external stakeholders, special interest stakehold-ers and influencer stakeholdstakehold-ers [32].
The research motivation is based on the findings which state that the current techniques are complex, provide a description of stakeholders at a higher level of abstraction, and do not pro-vide process level details in order to quantify the stakeholders [29], incorrect early findings [29], are not uniform [33], cannot be adopted as a framework [33], and are time consuming and costly [26–28]. The VBS systems mainly focus on the economic leverage and this thing dif-ferentiates the VBS from traditional software applications. There is the need to propose a new SIQ framework for the VBS systems. The proposed framework will help in finding out a critical set of stakeholders and decision making. The framework provides clear and easy guidelines to initiate the SIQ process. The concept of multi-attribute and multi-metrics as proposed in [34,
Proposed Framework StakeMeter
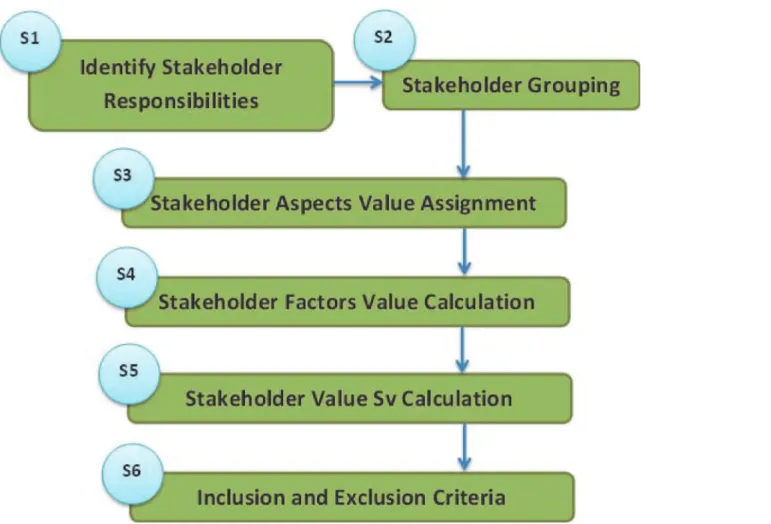
The proposed SIQ framework calledStakeMetercomprises 6 steps. The main steps of the framework are stakeholder responsibilities, stakeholder groups, stakeholder aspects or attri-butes, stakeholder factors, stakeholder values and inclusion and exclusion criteria. (Fig. 3) shows the different steps of the proposed frameworkStakeMeter.
Fig 2. Problems of the SIQP.
3.1 Stakeholder Responsibilities
The organizations mostly define the responsibilities of their employees from higher level to the lower level including their authorities. The overview of such documents may help in under-standing the responsibilities of the stakeholders of an organization. If the responsibility docu-ments are not available, then there is the need to create them. The responsibilities of
stakeholders play a vital role in identification of different stakeholders who may contribute in the development of the VBS systems.
3.2 Stakeholder Groups
In this step, the stakeholders are identified and divided into different groups based on their re-sponsibilities. Stakeholders or people working in the same vicinity and professional area are placed in the same group. Moreover, based on the job relationships the stakeholders may also be placed in the similar groups. However, their level of professionalism is defined using stake-holder factors or metrics which are described in Section 4.
3.3 Stakeholder Aspects or Attributes
An initial estimation of all the factors is based on the stakeholder aspects or attributes which are taken into account during quantification of the stakeholders. These aspects are taken from Fig 3. Flowchart of StakeMeter.
literature and industry professionals. Some of the stakeholder aspects are communication, in-terpretation, decision making, cognitive load, complexity, clarity, objectivity, self-confidence, language barriers, time and geographical differences. The description of some of the stakehold-er aspects is given inTable 1. However, the selected stakeholder aspects are described in detail in Section 4.
3.4 Stakeholder Factors
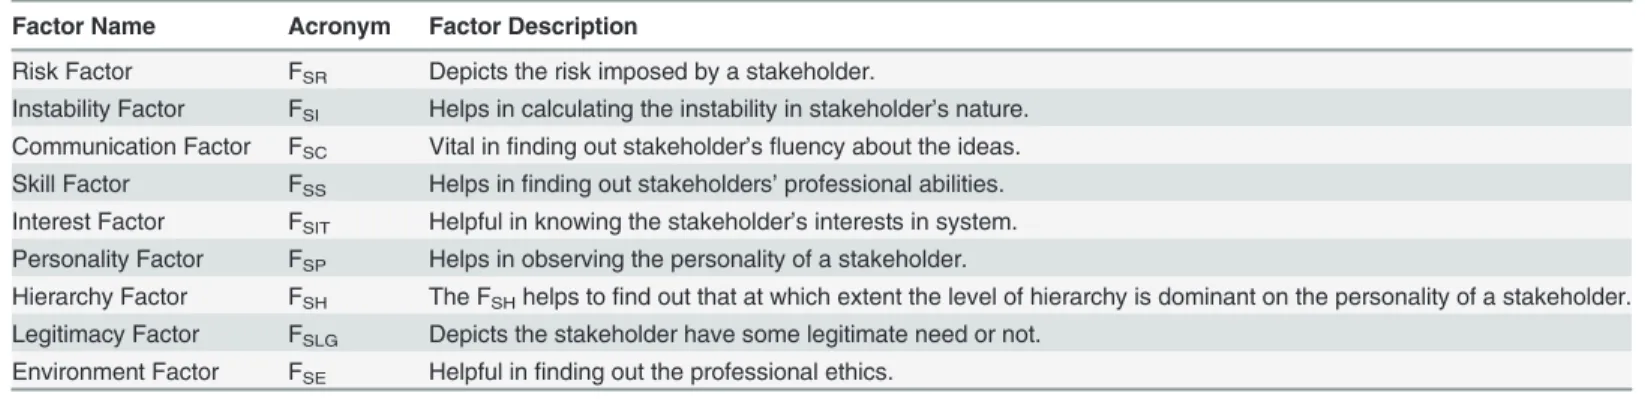
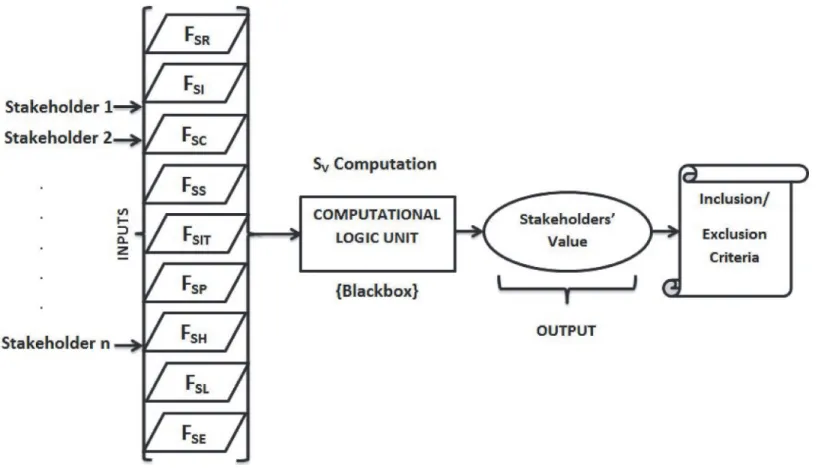
In this step, the individual value of each of the stakeholder factor or metric is calculated to find out the value of a stakeholder. These individual values are given as an input to theSvfunction as shown in Section 4, and the final value of the stakeholderSvis calculated. This step of the framework comprises different stakeholder factors that must be considered during the SIQ to select the most critical stakeholders. The value of these factors is calculated to find out the im-portance of an entity for a given VBS system.Table 2describes the proposed factors in detail.
The factors given inTable 2consist of stakeholder aspects and the output is in the form of number values obtained from mathematical formulations as described in Section 4. The values obtained from all these factors serve as an input to the final computational logic in order to find out the worth or value of a stakeholder, which is denoted bySv, for the VBS development. (Fig. 4) depicts the computational model for stakeholder quantification in which stakeholder factors serve as an input to the Computational Logic Unit (CLU) or Blackbox and returns the value of the intended stakeholder based on the proposed computational logic.
Table 1. Stakeholders’aspects.
Aspect Name Aspect Description
Communication The stakeholders’ability to communicate properly.
Interpretation Stakeholders’ability to describe the economic benefit of the required needs. Decision Making The stakeholder has a prominent role in decision making or not.
Cognitive Load This shows the stakeholder’s ability related to memory stress.
Complexity Stakeholder’s ability to present the complex needs in an elaborative way. Clarity Stakeholder’s ability to describe the intended needs In a clear manner. Objectivity Stakeholder’s ability to describe the intended meanings of the needs properly. Self Confidence It represents the level of self-confidence of the stakeholder.
doi:10.1371/journal.pone.0121344.t001
Table 2. Factor description.
Factor Name Acronym Factor Description
Risk Factor FSR Depicts the risk imposed by a stakeholder.
Instability Factor FSI Helps in calculating the instability in stakeholder’s nature.
Communication Factor FSC Vital infinding out stakeholder’sfluency about the ideas.
Skill Factor FSS Helps infinding out stakeholders’professional abilities.
Interest Factor FSIT Helpful in knowing the stakeholder’s interests in system.
Personality Factor FSP Helps in observing the personality of a stakeholder.
Hierarchy Factor FSH The FSHhelps tofind out that at which extent the level of hierarchy is dominant on the personality of a stakeholder.
Legitimacy Factor FSLG Depicts the stakeholder have some legitimate need or not.
Environment Factor FSE Helpful infinding out the professional ethics.
3.5 Stakeholder Values
The value of stakeholderSvis calculated by using all the stakeholder factor values as a variable. The values of stakeholder factors are given to the finalSvequation and quantified valueSvof a stakeholder is obtained. TheSvis explained in Section 4. TheSvis the result of a function which can be written as:
Sv¼fðxÞ
x¼ fFSR;FSC;FSS;FSI;FSIT;FSP;FSH;FSLG;FSEg
The output off(x)results in theSvwhich is used to quantify the stakeholders in order to know the stakeholder importance for the VBS project. The value of‘x’is based on the values of stakeholder factors. In mathematical notations,Svis a function ofx. The different factors are taken into consideration in order to quantify the stakeholders which serve as an input to the function. For the calculation of all these factors, different stakeholder aspects are taken into ac-count. These aspects help infinding out the value of a given factor for a given stakeholder. Based on the values of all these factors, the overall value of a stakeholder is calculated which is denoted by theSv.
3.6 Inclusion and Exclusion Criteria
The inclusion and exclusion criteria are based on the quantification value of stakeholders ob-tained from individual stakeholder factors after computation. The inclusion and exclusion Fig 4. Computational model of stakeholders’quantification.
criteria depend on theSv. TheSvdefines that either the involvement of a stakeholder is essen-tial for the success of the system or not in terms of market leverage. The inclusion and exclu-sion criteria are described in Section 5.
Stakeholder Factor Formulation
The stakeholder selection is based on the stakeholder metrics, which are termed as‘factors’in this study. The stakeholder factors are proposed after long discussions and meetings with the industry professionals. Each of the factor value is calculated by using stakeholder attributes that are stated as‘aspects’in this study. In this stage, the experts are heavily involved, and the significance of the stakeholder aspects is defined for different stakeholder factors. A consensus was made by the experts on the use of the terms factors and aspects instead of metrics and attri-butes. The values of all the proposed factors are calculated by assigning them the values of stakeholder aspects. Different aspects are used for different factors to evaluate the stakeholders thoroughly in order to know their worth for the VBS project. However, in the existing ap-proaches, the use of few aspects does not help in thorough evaluation of the stakeholders and this limitation results in confusion and biases. Thus, a wide range of aspects is evaluated in order to know the worth of a stakeholder for the VBS project. F denotes the stakeholder factor or metric and T denotes the stakeholder attribute or aspect in this research. The values of the aspects are taken as an input on a Likert scale of 0 to 5.
Factor!F Aspect!T
4.1 Stakeholder Risk Factor (F
SR)
The aspects that are considered for stakeholder risk factor are communication (TCM),
interpre-tation (TIT), decision-making (TDM), cognitive load (TCL), complexity (TCP), language barriers
(TLB), time and geographic differences (TTG). The selected aspects represent the effect of a
stakeholder on the RE and it may be positive or adverse. The details of the selected aspects are as follows:
1) Communication (TCM): The aspect of communication is taken into consideration in order
to judge that at which level the stakeholder is able to communicate the functional objectives of the project.
2) Interpretation (TIT): The aspect of interpretation helps in evaluation of the descriptions
given by a stakeholder related to a particular functional aspect of the system.
3) Decision-making (TDM): The stakeholder has a prominent role in decision-making or not.
4) Cognitive Load (TCL): At which level the stakeholder is able to bear the memory stress.
5) Complexity (TCP): To which extent the stakeholder is able to present the complex needs
and decisions in a more elaborative way.
6) Language Barriers (TLB): The impact of language of the intended stakeholder.
7) Time & Geographic Differences (TTG): The impact of time and geographical differences
re-lated to the stakeholder.
summation as shown inEquation 1also helps in reducing the expert biases due to the fact that it prevents from mere numbers game. The same technique is used in all other proposed factors in order to obtain a linear dataset. In the case of FSR, if the aspect value is 0 then it means low
risk, otherwise 5 means high risk. FSR¼0
:2ðTCMþTITþTDMþTCLþTCPþTLBþTTGÞ þ0:2
FSR¼0:2
X
ni¼1
FSRi
0
B @
1
C
Aþ
0
:2
ð1Þ
The expert assigns the value to each aspect in the range of 0 to 5. For example if the expert assigns the following values to all seven aspects of FSR:
FSR¼0:2ð3þ2þ4þ3þ1þ2þ3Þ þ0:2
Then the value of FSRfor a given stakeholder is 3.8. In the same way, the values of all other
stakeholder factors are calculated based on the aspect values. InEquation 1,idenotes an aspect of FSRandnis the total number of aspects. After inserting the aspect values in the range of 0 to
5, the output of FSRis in the range of 0.2 to 7.2.
4.2 Stakeholder Instability Factor (F
SI)
The aspects that are considered for stakeholder instability factor are immune to challenges (TCH), workload (TWL), and fatigue management (TFM). These aspects are described as
follows:
1) Immune to Challenges (TCH): The stakeholder has the ability to face the new challenges.
2) Work Load (TWL): The stakeholder is able to bear the extra workload.
3) Fatigue Management (TFM): The stakeholder’s expression of fatigue.
In the case of FSI, if the aspect value is 0 then it means low risk, otherwise 5 means high risk.
FSI ¼0:2ðTCHþTWLþTFMÞ þ0:2
FSI¼0:2
X
ni¼1
FSIi
0
B @
1
C
Aþ
0
:2
ð2Þ
InEquation 2,idenotes an aspect of FSIandnis the total number of aspects. After inserting
the aspect values in the range of 0 to 5, the output of FSIis in the range of 0.2 to 3.2.
4.3 Stakeholder Communication Factor (F
SC)
The aspects that are considered for stakeholder communication factor are clarity (TCR),
objec-tivity (TOB), and self-confidence (TSC). The description of the aspects is given as follows:
1) Clarity (TCR): The stakeholder is able to clearly describe the intended needs of the
VBS system.
2) Objectivity (TOB): The stakeholder is able to properly describe the intended meaning of the
required needs in terms of economic benefit.
In the case of FSC, if the aspect value is 0 then it means that the stakeholder is non-critical,
otherwise 5 means critical.
FSC¼0:2ðTCRþTOBþTSCÞ þ0:2
FSC¼0:2
X
ni¼1
FSCi
0
B @
1
C
Aþ0:2
ð3Þ
InEquation 3,idenotes an aspect of FSCandnis the total number of aspects. After inserting
the aspect values in the range of 0 to 5, the output of FSCis in the range of 0.2 to 3.2.
4.4 Stakeholder Skill Factor (F
SS)
The aspects that are considered for stakeholder skill factor are experience (TEX), managerial
abilities (TMA), domain knowledge (TDK), domain training (TDT), and self-esteem (TSE). These
aspects are described as follows:
1) Experience (TEX): The stakeholder’s prior experience or related experience in the domain of
VBS systems.
2) Managerial Abilities (TMA): The stakeholder’s level of management in their respective
professional area.
3) Domain Knowledge (TDK): The current level of domain knowledge of the stakeholder.
4) Domain Training (TDT): The stakeholder is properly trained or not.
5) Self-esteem (TSE): The stakeholder is holding the status as per his or her required skills.
In the case of FSS, if the aspect value is 0 then it means that the stakeholder is non-critical,
otherwise 5 means critical. FSS¼0
:2ðTEXþTMAþTDKþTDTþTSEÞ þ0:2
FSS¼0:2
X
ni¼1
FSSi
0
B @
1
C
Aþ0:2
ð4Þ
InEquation 4,idenotes an aspect of FSSandnis the total number of aspects. After inserting
the aspect values in the range of 0 to 5, the output of FSSis in the range of 0.2 to 5.2.
4.5 Stakeholder Interest Factor (F
SIT)
The aspects that are considered for stakeholder interest factor are domain scope knowledge (TDSK), business knowledge (TBK), and objectivity (TOB). These aspects are described as
follows:
1) Domain Scope Knowledge (TDSK): The stakeholder has the knowledge of most relevant
sub-ject matter of the domain.
2) Business Knowledge (TBK): The stakeholder knows well about the business domain.
3) Objectivity (TOB): The knowledge shared by the stakeholder is meaningful in terms of
In the case of FSIT, if the aspect value is 0 then it means that the stakeholder is non-critical,
otherwise 5 means critical.
FSIT ¼0:2ðTDSKþTBKþTOBÞ þ0:2
FSIT ¼0:2
X
ni¼1
FSITi
0
B @
1
C
Aþ0:2
ð5Þ
InEquation 5,idenotes an aspect of FSITandnis the total number of aspects. After
insert-ing the aspect values in the range of 0 to 5, the output of FSITis in the range of 0.2 to 3.2.
4.6 Stakeholder Personality Factor (F
SP)
The aspects that are considered for stakeholder personality factor are cooperative (TCO),
vi-sionary (TVI), inspirer (TIN), performer (TPR), knowledge sharer (TKS), role model (TRM), and
influence (TINF). These aspects are described as follows:
1) Cooperative (TCO): The extent of cooperation of a stakeholder with other team members.
2) Visionary (TVI): The stakeholder’s level of deep insight of the business.
3) Inspirer (TIN): The stakeholder has the ability to do something creative.
4) Performer (TPR): The stakeholder has the ability to do something as an achiever in order to
make something successful.
5) Knowledge Sharer (TKS): The stakeholder shares ideas and experiences with others.
6) Role Model (TRM): The stakeholder’s abilities make him or her prominent among team
members and other stakeholders consider him or her as a role model.
7) Influence (TINF): The stakeholder’s effect on other members in terms of creative thinking,
development and behavioral aspects.
In the case of FSP, if the aspect value is 0 then it means that the stakeholder is non-critical,
otherwise five means critical.
FSP¼0:2ðTCOþTVIþTINþTPRþTKSþTRMþTINFÞ þ0:2
FSP¼0:2
X
ni¼1
FSPi
0
B @
1
C
Aþ
0
:2
ð6Þ
InEquation 6,idenotes an aspect of FSPandnis the total number of aspects. After inserting
the aspect values in the range of 0 to 5, the output of FSPis in the range of 0.2 to 7.2.
4.7 Stakeholder Hierarchy Factor (F
SH)
The aspects that are considered for stakeholder hierarchy factor are executive position (TEP),
mid-career (TMC), and entry-career (TEC). The stakeholder’s hierarchy is rated in terms of
high, average and low. The details of these aspects are given as follows.
1) Executive (TEP): The stakeholder’s highest level of power based on experience.
2) Mid-Career (TMC): The stakeholder’s power level with good experience.
The value of FSHis considered based on the current position of the stakeholders.
TEP¼High¼4
TMC ¼Average¼3
TEC¼Low¼2
FSH¼TVal
TVal¼Value of Hierarcy Aspects
4.8 Stakeholder Legitimacy Factor (F
SLG)
The legitimacy shows that either the stakeholder is a legitimate one in terms of system needs or not. The intensity of legitimacy is described in terms of high, average, and low.
High¼4
Average¼3
Low¼2
FSLG¼TVal
TVal¼Intensity of Legitimacy
4.9 Stakeholder Environment Factor (FSE)
The aspects that are considered for stakeholder environment factor are cognitive load (TCL),
fa-tigue management (TFM), inspirer (TIN), and knowledge sharer (TKS). There are some of the
as-pects which are also common in other factors. The commonality exists due to the dual role of these aspects under different scenarios. The detail of these aspects is given as follows:
1) Cognitive Load (TCL): At which level the stakeholder is able to bear the memory stress.
2) Fatigue Management (TFM): The stakeholder’s expression of fatigue during work hours.
3) Inspirer (TIN): The stakeholder has the ability to do something creative.
4) Knowledge Sharer (TKS): The stakeholder shares ideas and experiences with others.
In the case of FSE, if the aspect value is 0 then it means that the stakeholder is non-critical,
otherwise 5 means critical.
FSE¼0:2ðTCLþTFMþTINþTKSÞ þ0:2
FSE¼0:2
X
ni¼1
FSEi
0
B @
1
C
Aþ
0
:2
ð7Þ
InEquation 7,idenotes an aspect of FSEandnis the total number of aspects. After inserting
the aspects’values in the range of 0 to 5, the output of FSEis in the range of 0.2 to 4.2.
calculated as a linear combination or summation of all the aspects. The weight factor 0.2 is ap-plied in order to get a smaller range of value and to get a linear solution for each factor. The weight factors, greater than 0.2, are problematic in terms of higher values of theSv. Moreover, the weight factor 0.2 is used to standardize the data in a manageable range with upper and lower bounds. The weight factors lower than 0.2 are problematic in terms of fuzzification. Fuz-zification causes the problem of uncertainty in the selection process of the stakeholders. Differ-ent weight factors are applied and evaluated in the range of 0.1 to 0.9 and it is found that if a factor is applied in this range, the number of quantification values remain the same. However, as the value of the factor is going to increase from 0.1 to 0.9 the values of stakeholder factors are also going to increase. The higher values of stakeholder factors are difficult to manage. Thus, the weight factor of 0.2 is chosen as a solution in order to obtain the normalized and manageable data values. TheSvrange increases due to the application of a large number of stakeholder aspects. The finalSvof a stakeholder is calculated by using the following formula.
SV¼ ðFSCþFSSþFSITþFSPþFSHþFSLGþFSEÞ ðFSRþFSIÞ
SV¼
X
ni¼1
bi
X
mj¼1
gj ð8Þ
b¼ fFSCþFSSþFSITþFSPþFSHþFSLGþFSEg ð9Þ
g¼ fFSRþFSIg ð10Þ
InEquation 8,βrefers to the values of stakeholder factors that are used to calculate the posi-tive impact of a stakeholder on the system andirefers to theβfactors, wherenis the total num-ber ofβfactors. However,γrefers to the values of stakeholder factors that are used to calculate the negative impact of a stakeholder on the system andjrefers to theγfactors, wheremis the total number ofγfactors. After inserting the factor values, the output ofβis in the range of 5.0 to 31.0 with a geometric progression of 0.2. After inserting the factor values, the output ofγis in the range of 0.4 to 10.4 with a geometric progression of 0.2.Svis the value of stakeholder that is calculated after taking a summation of theβvalues of the factors and negating the sum-mation of theγvalues of the factors. TheSvis in the range of-5.4 to 30.6 with a geometric pro-gression of 0.2.Equation 9andEquation 10shows theβandγfactors.
Inclusion and Exclusion Criterion
The inclusion and exclusion of a stakeholder in the RE process depends on theSv. In case of theSv, the two exceptions are very prominent:
1) The values ofβandγcannot be high at the same time.
2) The values ofβandγcannot be low at the same time.
Implementation Guidelines
In order to implement theStakeMeterframework, the implementers must adhere to some rules and regulations. In this section, some of the key application principles are given in order to im-plement the proposed frameworkStakeMeter. The application principles are stated as follows:
1) In order to achieve the optimum results of theStakeMetera team of professionals, compris-ing at least 4 members, must be selected.
2) Get knowledge of the business practices of the organization early for which the product is going to be developed.
3) Apply all steps of theStakeMeterin a rigorous way
4) The team members must avoid conflicts and measure the value of each stakeholder based on the proposed frameworkStakeMeter.
5) The team members may divide the organizational units based on their key expertise in order to implement the frameworkStakeMeter.
Case Studies
Three teams, comprising five members each, are made in order to implement the framework as per given implementation guidelines which are given in Section 6. The purpose to choose the three teams is to evaluate the framework in a true sense and to reduce the extent of biasness. Two members of each team were working on analysis of the stakeholders based on the pro-posed SIQ framework and on the requirements in order to get the requirements from the in-tended stakeholders. Two members of the teams were working as developers in order to realize the requirements of the stakeholders into a working system and one member of each team was working on documentation of the system. The teams are made in order to get the unbiased re-sults and to analyse the real worth of the proposed SIQ framework. The description of the proj-ects is given inTable 3.
The process is initiated by the teams after taking into consideration the total number of stakeholders who are related to the system directly or indirectly. The teams initially met with the top management of the business organizations in order to find out the total number of stakeholders in the given organization.Table 4lists all the possible stakeholders of an organization.
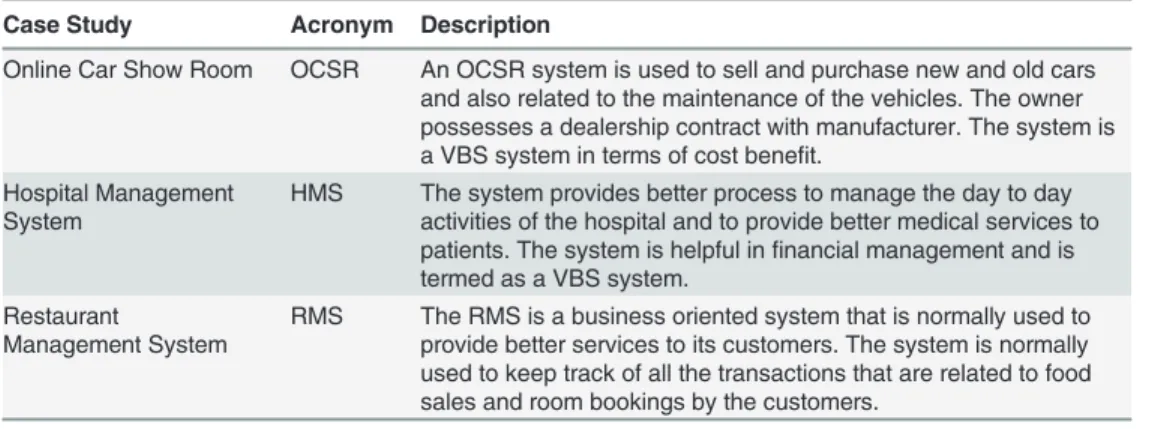
Table 3. Case study descriptions.
Case Study Acronym Description
Online Car Show Room OCSR An OCSR system is used to sell and purchase new and old cars and also related to the maintenance of the vehicles. The owner possesses a dealership contract with manufacturer. The system is a VBS system in terms of cost benefit.
Hospital Management System
HMS The system provides better process to manage the day to day activities of the hospital and to provide better medical services to patients. The system is helpful infinancial management and is termed as a VBS system.
Restaurant
Management System
RMS The RMS is a business oriented system that is normally used to provide better services to its customers. The system is normally used to keep track of all the transactions that are related to food sales and room bookings by the customers.
7.1 Number of stakeholders
In this section, the number of stakeholders of three case studies is described in detail.
7.1.1 Case study: 1 Online Car Show Room. The main purpose of an Online Car Show
Room (OCSR) management system is to sell and purchase cars or vehicles, and is normally used by the vehicle dealers. Team 1 who was working on the OCSR found a total of 23 main stakeholders at higher level of abstraction. The car showroom team is presided by one director and two deputy directors. The four stakeholders work on the front desk in order to oversee the customer requests and out of these four, one member works as a cashier. There is one front desk manager who controls the front desk activities. The administration team of car showroom consists of three admin assistants, two accountants and one admin officer. The technical store consists of one store officer, two store assistants, one clerk and five maintenance in-charges. There are 13 mechanics working under these maintenance in-charges who are not directly af-fected by the system thus, they are not included in the list of stakeholders.Table 5lists all the stakeholders in the OCSR.
7.1.2 Case study 2: Hospital Management System. The Hospital Management System
(HMS) is used in order to manage the day-to-day activities of a hospital like administrative af-fairs, patient administration, billing, and other related activities. The helpful properties of the system are used by all stakeholders from higher ranks to lower ranks in a hospital. Patient is considered as one of the most important entity in this system. There is the need to incorporate all critical needs or requirements of the stakeholders in the intended system. In order to make the HMS beneficial for the intended community, the system should be flexible, reliable, and easy to adopt. The main flow of the information totally depends upon the requirements gath-ered from the stakeholders. For an automated HMS, there is the need to identify the key stake-holders of the system in order to gather requirements. In the HMS, there is a long list of stakeholders who control different activities of the hospital. The proposed SIQ framework is applied and the stakeholders are quantified based on theSv.
Table 5. List of the OCSR stakeholders.
OCSR CASE STUDY
ID # Stakeholders Total
1. Director 1
2. Deputy Director 2
3. Admin Officer 1
4. Front Desk Manager 1
5. Store Officer 1
6. Store Assistant 2
7. Admin Assistant 3
8. Accountant 2
9. Front Desk Employee 4
10. Clerk 1
11. Maintenance In-charge 5
doi:10.1371/journal.pone.0121344.t005 Table 4. Total number of stakeholders.
Organization Name OCSR HMS RMS
Total Stakeholders 23 63 121
Assigned To Team 1 Team 2 Team 3
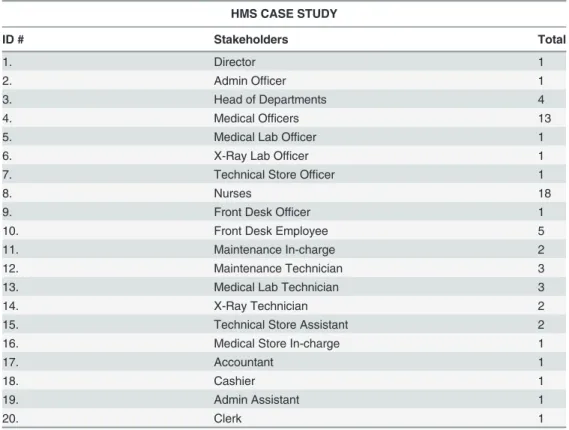
Team 2 was working on the HMS and found a total of 63 stakeholders at a higher level of ab-straction. There was one director of the hospital and one administrative officer. The medical departments are governed by four head of departments. In the front desk team, there are five employees headed by a front desk officer. There are a total of 13 medical officers who work in the hospital. The medical laboratory is comprised of three technicians with one lab officer and the X-ray department has two technicians with one X-Ray medical officer. There are a total of 18 male and female nurses. There are two medical equipment maintenance in-charges and three technicians. The admin team consists of one cashier, one accountant, two admin assis-tants and one clerk. Medical store is controlled by one medical store in-charge and two sales-men. There is one technical store officer and two store assistants.Table 6lists all the
stakeholders in the HMS.
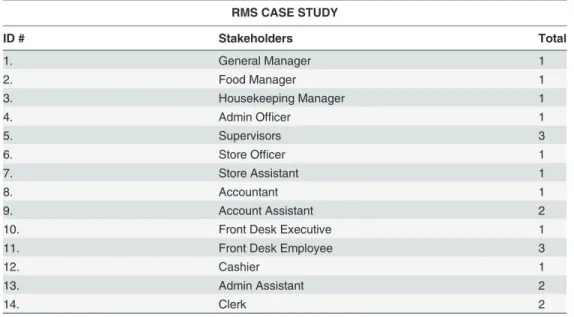
7.1.3 Case study 3: Restaurant Management System. The Restaurant Management
Sys-tem (RMS) is assigned to Team 3 and they have listed a total of 121 stakeholders who are work-ing at the restaurant. However, only 21 stakeholders are selected out of 121 and are listed here based on the core responsibilities of the stakeholders. The focused restaurant is supervised by a general manager who is responsible for overall activities of the restaurant. The food manager manages the food supply chains, and the housekeeping manager keeps the maintenance of the building. There is one administrative officer who handles the administrative affairs of the res-taurant, two admin assistants and two clerks are working under his supervision. The financial matters are looked by one cashier and one accountant who supervise two assistants. Three su-pervisors are responsible for the in-house maintenance or needs of the restaurant that should be informed to senior management. The front desk team consists of three employees who guide the guests about room booking and other services and are supervised by one front desk
Table 6. List of the HMS stakeholders.
HMS CASE STUDY
ID # Stakeholders Total
1. Director 1
2. Admin Officer 1
3. Head of Departments 4
4. Medical Officers 13
5. Medical Lab Officer 1
6. X-Ray Lab Officer 1
7. Technical Store Officer 1
8. Nurses 18
9. Front Desk Officer 1
10. Front Desk Employee 5
11. Maintenance In-charge 2
12. Maintenance Technician 3
13. Medical Lab Technician 3
14. X-Ray Technician 2
15. Technical Store Assistant 2
16. Medical Store In-charge 1
17. Accountant 1
18. Cashier 1
19. Admin Assistant 1
20. Clerk 1
officer. There is one store officer and one store-assistant.Table 7describes the total stakehold-ers in the RMS.
7.2 Stakeholders
’
responsibilities and grouping
The responsibilities of the stakeholders play a vital role in description of the different business activities. After counting the total number of stakeholders of all three case studies namely OCSR, HMS and RMS, all of the teams asked the lists of responsibilities of all the stakeholders from the respective business organization. Based on these responsibilities, the teams have found dependencies of different stakeholders on each other and the working relationships be-tween all the entities. The teams have divided the stakeholders into different groups based on their responsibilities, especially based on similar responsibilities.
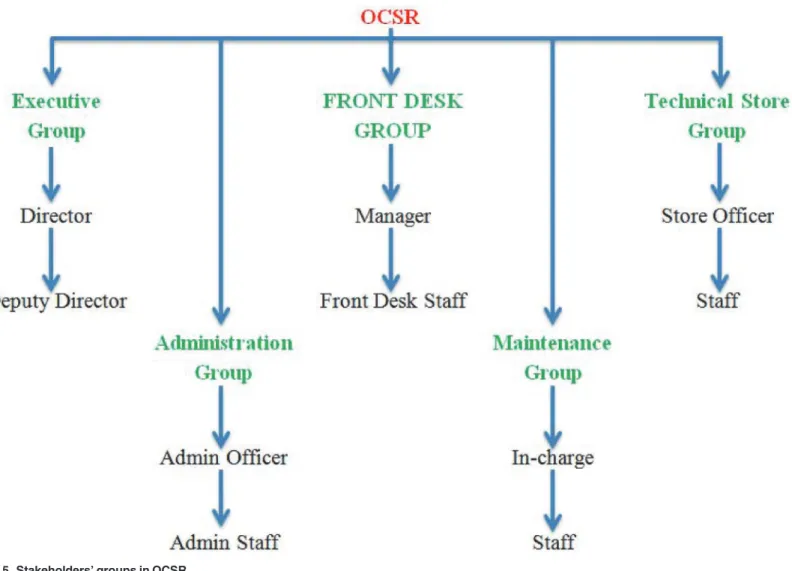
7.2.1 Online car show room. Team 1 has divided the stakeholders of the OCSR into five
main categories namely executive group, administration group, front desk group, maintenance group and technical store group. These groups help in finding out the hierarchies of the stake-holders in terms of their relative position in the organization. Team 1 has included the director and deputy directors into the executive group who mainly handle the financial issues and over-all infrastructure of the showroom. The administration group deals with the administrative af-fairs of the showroom, thus the administrative officer and staff come in the boundaries of this group. The front desk group comprises front desk officer or manager and the related staff who handle similar activities in the showroom. The maintenance group is related to the mainte-nance of the old and new vehicles and comprises maintemainte-nance in-charges and technicians. The technical store group consists of the store officer and working staff. The technical store group handles the inventory of spare parts in the store of the showroom. (Fig. 5) describes the differ-ent groups in the OCSR case study.
7.2.2 Hospital management system. The team who worked on the HMS divided the
stakeholders into nine major groups. The list of groups is comprised of executive group, front desk group, treatment group, administration group, maintenance group, laboratory group, medical store group, technical store group and x-ray lab group. (Fig. 6) lists all the groups of the HMS stakeholders. Executive group consists of director and head of departments. Front Table 7. List of the RMS stakeholders.
RMS CASE STUDY
ID # Stakeholders Total
1. General Manager 1
2. Food Manager 1
3. Housekeeping Manager 1
4. Admin Officer 1
5. Supervisors 3
6. Store Officer 1
7. Store Assistant 1
8. Accountant 1
9. Account Assistant 2
10. Front Desk Executive 1
11. Front Desk Employee 3
12. Cashier 1
13. Admin Assistant 2
14. Clerk 2
desk group contains the list of front desk officer and front desk staff. The treatment group is re-lated to the treatment of the patients and is comprised of medical officers and nurses. The ele-ments of administration group are admin officer and admin staff. Maintenance group contains in-charge and technicians. Laboratory group is related to pathological tests and consists of lab officer and technicians. X-ray laboratory group consists of lab officer and technicians. The medical store group contains store in-charge and salesman. Finally, the technical store group is a set of store officer and store assistants.
7.2.3 Restaurant management system. The software team who worked on the RMS
re-ported five groups of stakeholders, namely executive group, front desk group, technical store group, administration group and maintenance group. (Fig. 7) describes all the possible groups of the stakeholders in the RMS. Executive group contains Managers. Front desk group consists of front desk officer and staff. The technical store group consists of store officer and staff. The administration group consists of admin officer and related staff. The maintenance group is comprised of supervisors and staff.
Fig 5. Stakeholders’groups in OCSR.
7.3 Stakeholder quantification results and analysis
The stakeholder quantification is performed by applying the proposed factors. Every team has used the proposed nine factors and quantified the stakeholders based on the key attributes. The value of each stakeholder is calculated by using theSvequation. Later, for each project a critical set of stakeholders is selected by the professionals.Table 8describes the selection and quantifi-cation of the OCSR stakeholders based on the proposed factor values andSv. Team 1 of the OCSR selected 13 stakeholders based on theSvof each stakeholder. TheSvdecreases quickly in the case of the OCSR project, which shows that only few stakeholders are beneficial for this project. The rest of the stakeholders in the case of the OCSR are not included due to the lowSv.
Table 9describes theSvvalue of the HMS stakeholders. The team has selected 32 stakehold-ers out of 63 based on theSv. The software development team 2 has considered all those Fig 6. Stakeholders’groups in HMS.
Fig 7. Stakeholders’groups in RMS.
doi:10.1371/journal.pone.0121344.g007
Table 8. OCSR stakeholder Sv.
Sr. No: Stakeholder Group βValues γValues SV
1. Director Executive 26.4 0.8 25.6
2. Dy. Director Executive 23.0 1.2 21.8
3. Front Desk Manager Front Desk 20.6 1.0 19.6
4. AO Administration 18.8 0.8 18.0
5. SO TechStore 19.2 1.6 17.6
6. SA1 TechStore 18.2 1.2 17.0
7. SA2 TechStore 17.4 0.8 16.6
8. MI1 Maintenance 17.6 0.8 16.8
9. MI2 Maintenance 18.8 2.4 16.4
10. MECH1 Maintenance 16.4 2.0 14.4
11. MECH2 Maintenance 14.6 1.8 12.8
12. MECH3 Maintenance 15.2 2.6 12.6
13. MECH4 Maintenance 12.8 3.2 9.6
executive stakeholders who haveSvgreater than 19. The other non-executive stakeholders with Svgreater than 15 are included in the set of key stakeholders. The remaining stakeholders are not considered as key stakeholders for the HMS project, and they do not have legitimate needs. The requirements should be gathered from the selected key stakeholders.
The description of theSvof the selected stakeholders for the RMS is given inTable 10. Team 3 has selected 21 stakeholders out of 121. The remaining stakeholders are reported as non-critical stakeholders based on the different key aspects as given in the
StakeMeterframework.
Software project team 3 who worked on the RMS has selected a total of 21 stakeholders based on theSvof the stakeholders. The trend, which is observed here, is the similarity in theγ values of the stakeholders at all levels, to some extent, and this makes most of the
stakeholders significant. Table 9. HMS stakeholders’Sv.
Sr. No: Stakeholder Group β γ SV
1. Director Executive 24.4 0.6 23.8
2. Admin Officer Administration 22.2 0.4 21.8
3. HOD 1 Executive 25.2 0.8 24.4
4. HOD 2 Executive 21.6 0.6 21.0
5. HOD 3 Executive 20.4 0.4 20.0
6. HOD 4 Executive 22.8 0.6 22.2
7. FDO Front Desk 19.2 0.8 18.4
8. Front Desk Employee 1 Front Desk 20.2 2.2 18.0
9. Front Desk Employee 2 Front Desk 18.6 1.2 17.4
10. MO 1 Treatment 21.0 0.8 20.2
11. MO 2 Treatment 22.4 0.6 21.8
12. MO 3 Treatment 23.0 0.4 22.6
13. MO 4 Treatment 20.8 0.6 20.2
14. MO 5 Treatment 19.8 1.2 18.6
15. MO 6 Treatment 21.4 0.8 20.6
16. Lab Officer Laboratory 18.2 1.0 17.2
17. Lab Technician Laboratory 18.4 0.6 17.8
18. X-Ray Technician X-Ray Lab 21.2 1.6 19.6
19. X-Ray MO X-Ray Lab 17.8 1.2 16.6
20. Nurse 1 Treatment 19.2 1.2 18.0
21. Nurse 2 Treatment 22.4 0.6 21.8
22. Nurse 3 Treatment 21.0 1.2 19.8
23. Nurse 4 Treatment 22.8 2.2 20.6
24. Nurse 5 Treatment 18.8 1.6 17.2
25. Nurse 6 Treatment 23.2 0.4 22.8
26. Nurse 7 Treatment 17.8 2.4 15.4
27. Cashier Admin 21.2 1.0 20.2
28. Accountant Admin 22.6 2.4 20.2
29. Admin Assistant Admin 19.6 2.6 17.0
30. Medical Store In-charge Medical Store 17.8 1.6 16.2
31. Technical Store Officer Technical Store 18.0 0.6 17.4
32. Store Assistant Technical Store 19.2 1.0 18.2
In all of the three case studies, the stakeholders with higherSvare included in the critical set. TheSvof each key stakeholder is obtained by using the key attributes of the stakeholder factors. The consultation with these stakeholders proved highly beneficial. The clarity of the ideas of the stakeholders is appreciated by the development team. The emphasis is given on the participation of the highly critical stakeholders in the case of value-driven software systems. Previously, the existing stakeholder analysis approaches are unable to provide a framework that may be adopted for the VBS systems. The empirical findings report that the proposed stakeholder analysis framework has a deeper effect on the success of the VBS system. It is veri-fied by the results that the proposed stakeholder analysis framework is superior in terms of pro-posed steps, activities and propro-posed metrics as reported by the team members. The results show that the quantification of key stakeholders depends on the stakeholder aspects or attri-butes. The existing approaches do not cover the key aspects or attributes in a uniform way due to which the software professionals face different barriers. These barriers make the initiation process obscure. However, the proposed framework makes the initiation of the SIQ easy. Dur-ing the implementation of the proposed framework, the professionals accepted that the pro-posed framework focuses on the stakeholders in a vigorous way. The propro-posedStakeMeter framework reduces the burden of software professionals by providing a step by step guide for stakeholder analysis. Hence, the key contribution of theStakeMeterframework is based on clear guidelines, adequacy of the attributes, proposed metrics, and implementation details. However, the existing SIQ approaches do not provide support in terms of clear guidelines, at-tributes and stakeholder metrics. A comparative analysis of theStakeMeterframework, based on the key contributions, is shown in Section 8 with respect to the existing SIQ approaches and methods.
Table 10. RMS stakeholder Sv.
Sr. No: Stakeholder Group βValues γValues SV
1. General Manager Executive 20.6 1.8 18.8
2. Food Manager Executive 22.4 1.6 20.8
3. Housekeeping Manager Executive 23.6 1.0 22.6
4. Admin Officer Administration 19.8 2.2 17.6
5. Store Officer TechStore 18.2 2.0 16.2
6. Supervisor 1 Maintenance 18.0 2.4 15.6
7. Supervisor 2 Maintenance 17.8 1.8 16.0
8. Supervisor 3 Maintenance 19.2 2.8 16.4
9. Accountant Administration 18.4 1.2 17.2
10. Store Assistant Maintenance 17.6 1.6 16.0
11. Account Assistant 1 Administration 19.8 2.4 17.4
12. Account Assistant 2 Administration 18.4 2.0 16.4
13. Admin Assistant 1 Administration 16.6 2.4 14.2
14. Admin Assistant 2 Administration 15.2 2.0 13.2
15. Front Desk Executive Front Desk 19.8 2.6 17.2
16. Front Desk Employee 1 Front Desk 15.6 1.8 13.8
17. Front Desk Employee 2 Front Desk 16.2 2.0 14.2
18. Front Desk Employee 3 Front Desk 15.4 2.4 13.0
19. Cashier Administration 17.8 2.6 15.2
20. Clerk 1 Administration 16.2 3.0 13.2
21. Clerk 2 Administration 17.0 2.2 14.8
Performance Analysis of the StakeMeter
In order to measure the performance of theStakeMeterframework three existing methods are selected for comparative analysis. One is very initial method called as Mitchells’method (1997) and the second is a matured method as compared to the Mitchells’method and is called as Bal-lejos & Montagna method [28]. The third method is a latest one and is based on the bi-metric and fuzzy c-means algorithm [36]. The comparative analysis is based on the number of ex-plored stakeholders, time consumption in terms of total man hours for stakeholder analysis, clearly defined priorities and detailed guidelines. The time less than 24 man hours is considered as low, the time greater than 24 and less than or equal to 48 man hours is considered as medi-um and lastly the time greater than 48 man hours is considered as high.Table 11shows the comparative analysis of the proposedStakeMeterframework with the selected SIQ methods.
Table 11shows the comparative analysis of the three case studies of the OCSR, HMS, and RMS. Along with the application ofStakeMeterthe teams have applied Mitchells’method, the method proposed by Ballejos and Montagna and lastly the bi-metric and fuzzy c-means meth-od in order to analyse the stakeholders of the selected case studies. However, the Mitchells’ method is applied first of all. Secondly, the method proposed by Ballejos and Montagna is ap-plied. Thirdly, the bi-metric and fuzzy c-means based method is apap-plied. The main purpose to apply the three methods, prior to theStakeMeterapplication, is to find out the performance of the three methods and latter their performance is compared with theStakeMeterframework. Moreover, the teams are assigned every time a new case study in order to avoid expert biases.
8.1 Applications of the Mitchells
’
method
Initially, in the first step Mitchells’method is applied. The team working on the OCSR case study has found 18 stakeholders and it is reported that the time-consumption is very high. In the case of Mitchells’method, it is difficult to define the individual priorities of the stakehold-ers. Moreover, the guidelines of Mitchells’method are too abstract. There is a lack of low level details of the activities. The team working on the HMS case study has applied Mitchells’ meth-od and explored 43 stakeholders and the time taken during stakeholder analysis is high. Later, the Mitchells’method is applied on the RMS study. The team working on the RMS case study has found 39 stakeholders. The time-consumption is also high. The guidelines in the case of Mitchells’method are not clear and this results in higher time-consumption and large number of stakeholders is explored in each case study. It is observed that most of the stakeholders are treated at par instead of quantifying them individually.
8.2 Applications of the Ballejos and Montagna method
Before application of Ballejos and Montagna method [28] all three teams are shuffled on differ-ent projects in order to avoid any bias and to measure the performance of theStakeMeter Table 11. Comparative analysis.
Stakeholders Time-consumption Defined-Priorities of the Stakeholders
Detailed Guidelines OCSR HMS RMS OCSR HMS RMS
Mitchells’Method 18 43 39 High High High × ×
Ballejos & Montagna Method 15 46 53 Medium High High × Yes
Bi-Metric & Fuzzy C-Means Method
8 22 13 Low Low Low Yes Partial
StakeMeter 13 32 21 Low Low Medium Yes Yes
effectively. Team working on the OCSR case study has reported 15 stakeholders and the time taken to analyse the stakeholders is medium. The team working on the HMS case study has found 46 stakeholders and the time consumed in the case of HMS case study is high in terms of total man hours. The team of the RMS case study explored 53 stakeholders by applying Ballejos and Montagna method. The time reported by the team in terms of total man hours is high. In the case of Ballejos and Montagna method, it is also observed that more stakeholders are the part of game as compared to the Mitchells’method. Later, it is analyzed by the experts in each case study which stakeholders are not the key stakeholders and all these stakeholders are not considered as vital for the VBS development.
8.3 Application of the bi-metric and fuzzy c-means method
The bi-metric and fuzzy c-means based stakeholder analysis method is a most recent method. The details of the application of this method are given in [36]. The quantification of the stake-holders is based on two stakeholder metrics named as stakeholder skill factor and stakeholder interest factor. It is reported by the professionals that the given skill and interest factors result in selection of only those stakeholders who possess an executive role in the community and many other stakeholders are neglected. The two metrics mainly focus on the domain and its knowledge. However, the requirements of the stakeholders may vary under different contexts which make the suitability of the proposed metrics questionable for the projects with the large number of stakeholders. In this method, few stakeholders are selected based on the proposed metrics as shown inTable 11. However, it is also reported that the use of fuzzy c-means method may serve well in dividing the stakeholders into different clusters based on their proposed val-ues. The proposed method is efficient, but some of the stakeholders are missing in this case and are not the part of critical stakeholders. The team working on the OCSR has reported eight key stakeholders. The team working on the HMS case study explored 22 stakeholders as key stake-holders. However, the RMS team explored a total of 13 stakeholders as critical. The bi-metric and fuzzy c-means method neglects the stakeholders due to the focused attributes which main-ly help in the selection of executive members onmain-ly. This problem is solved by theStakeMeter framework in which stakeholder factors or metrics are divided into two main categories ofβ
andγfactors. Theβandγfactors cover a wide range of the stakeholder aspects and make the stakeholder analysis process lenient. The proposed factors of theStakeMeterhelp in evaluation of the stakeholders at different levels who are interested in the development of the VBS project. In the case ofStakeMeterframework, a range of stakeholder factors mitigates the extent of ex-pert biases too.
The bi-metric and fuzzy c-means based method [36] does not provide the low level imple-mentation details in order to initiate the SIQ. The problem of lack of low level details is highlighted in (Fig. 1). The proposed stakeholder quantification frameworkStakeMeter pro-vides a set of guidelines for industry professionals in order to quantify or prioritize the stake-holders. However, the bi-metric and fuzzy c-means based method is unable to provide easy to adopt guidelines for industry professionals. In theStakeMeter, the divide and conquer ap-proach is applied in which the stakeholders are grouped into different categories based on their responsibilities. The responsibilities are assessed through job cards. Based on these responsibil-ities it becomes easy to find out the initial worth of a stakeholder. However, it is not so in the case of bi-metric and fuzzy c-means based method. Later, inStakeMeterthe entities are evalu-ated based on the key aspects and factors that are discussed in Section 4. The proposed
frame-workStakeMeteradds new knowledge to software engineering body of knowledge (SWEBOK)
8.4 Application of the StakeMeter framework
The details of the application of theStakeMeterframework are given in Section 7. The team working on the OCSR has explored 13 key stakeholders and the time consumed in this case is low. In the case of HMS case study, the team has reported 32 stakeholders and the reported time is low again. Moreover, in the case of RMS case study the number of reported stakeholders is 21 and the time taken to analyse the stakeholders is medium as compared to the other three methods. The total number of stakeholders explored by the Mitchells’method, and Ballejos & Montagna method in the case of RMS is high as compared to theStakeMeterframework. The StakeMeterframework has identified the critical stakeholders only. In the case of bi-metric and fuzzy c-means method, the effort in man hours is less but some of the key stakeholders are missing as compared to theStakeMeterframework. However, in the case of theStakeMeter framework the overall man hours are less as compared to the Mitchells’method, and Ballejos & Montagna method.
The performance analysis of the three research studies is shown in (Fig. 8). In (Fig. 8), the effectiveness of the three research studies is measured in terms of time and it is obvious from the graph that the efficiency of the proposedStakeMeteris higher as compared to the other studies.
The experts of all three teams later analyzed the results and reported their observations. It is observed that due to the lack of clear quantification criteria it is difficult to define the baseline for inclusion and exclusion of stakeholders in the case of Mitchells’method, Ballejos and Mon-tagna method and bi-metric fuzzy c-means method for the VBS development process. Initially,
Fig 8. Performance analysis of StakeMeter.
the results of theStakeMeterframework are analyzed by the experts. It is reported that in the case of OCSR one stakeholder MECH4 has high risk and lowSvas compared to the other me-chanics. Hence, it is decided that it is not an element of the set of success critical stakeholders. At this initial stage this stakeholder is eliminated from the key stakeholder set. In the case of HMS, experts have also eliminated one stakeholder Nurse 7 due to the high risk and lowSv. However, in the case of RMS 3 stakeholders were eliminated by the experts in the first scrutiny due to the lowSv. Hence, in the final dataset of the stakeholders there are 12 key stakeholders in the OCSR, 31 in the HMS, and 18 in the case of RMS.
In the case of Mitchells’method, the number of selected stakeholders is high as compared to theStakeMeter. As compared toStakeMetersix non-key stakeholders are selected with the ap-plication of Mitchells’method in the case of OCSR. In the case of HMS, 12 non-key stakehold-ers are selected and in the case of RMS 21 non-key stakeholdstakehold-ers are selected.
The number of explored stakeholders in the case of Ballejos and Montagna method is also high as compared to theStakeMeterframework. In the case of OCSR, three non-key stakehold-ers are identified as key stakeholdstakehold-ers. In the case of HMS, 15 non-key stakeholdstakehold-ers are identi-fied as key stakeholders and in the RMS case study 35 non-key stakeholders are reported as success critical stakeholders.
In the case of bi-metric and fuzzy c-means method, the number of selected stakeholders is less as compared to theStakeMeterframework. In the OCSR case study four key stakeholders are missing. In the case of HMS case study nine key stakeholders are missing while in the case of RMS case study five key stakeholders are missing. This method mainly selects the executive or influential stakeholders of the VBS system and ignores others. Hence, in this method the error is based on the less number of selected stakeholders and some of the key stakeholders are neglected. In this case the error is higher than theStakeMeter. The identification error in the case ofStakeMeteris very low as compared to the two other methods. Based on the three, case studies the judgmental errors of the three research studies are shown in (Fig. 9) in the form of percentages. (Fig. 9) shows that the error in the case ofStakeMeterframework is very low as compared to the other studies.
Moreover, in order to measure the performance of the proposed SIQ frameworkStakeMeter the industry professionals are also involved for better understanding. Industry professionals have analyzed and evaluated the framework by applying it on different projects. The data is gathered from the industry professionals about performance of the proposed framework Stake-Meterusing survey questionnaire. Two surveys are conducted in this study one before applica-tion ofStakeMeterand one after application ofStakeMeter. The questionnaire is based on the five key parameters of standardization, easiness, efficiency with respect to time, ambiguity or lack of clarity of the proposed framework. The questionnaire is sent to 25 industry profession-als in order to record the data about performance analysis of the proposed framework. The re-sponse rate of the different reviewers, before and after application ofStakeMeter, is shown in
responses given by most of the respondents show that the proposed frameworkStakeMeteris easy, efficient in terms of time, clear and can be standardized.Table 12shows the performance of the proposed frameworkStakeMeter.
The comparison of theStakeMeterframework is also made with different methods and is shown inTable 13. The key elements that are taken into account in the comparison are person-ality metrics, technical metrics, inclusion/exclusion criteria, attribute adequacy, complexity, low level descriptions or guidelines and cost effectiveness in terms of time consumption. The proposed frameworkStakeMeterdeals with all the key issues of stakeholder analysis. However, there are some methods which provide partial or limited support for the different key parame-ters that are focused during comparative analysis and most of the key parameparame-ters are not fo-cused by the other methods and approaches.
Table 12. Response rate of StakeMeter performance.
Sr. No: Problem Before Response After Response
1 Lack of Standardization 95.40% 20.0%
2 Not Easy 80.0% 16.0%
3 Time-consuming 78.0% 12.0%
4 Ambiguity or lack of clarity 72.42% 12.0%
doi:10.1371/journal.pone.0121344.t012
Fig 9. Accuracy analysis of StakeMeter.
Future Research Directions
The future research is based on two phases. The first phase is to calculate the trustworthiness of all existing stakeholder analysis approaches in a rigorous way. The second phase of the research is to design an intelligent solution in order to reduce the extent of complexity and expert biases. The proposed frameworkStakeMeteris given for industry professionals. In order to evaluate the trustworthiness of the proposedStakeMeter, there is a need to evaluate the trustworthiness of all the existing stakeholder analysis approaches. By finding out the support given by each ap-proach it will be easy to measure the level of expert satisfaction. Hence, in order to measure the satisfaction of the industry professionals or experts in terms of stakeholder analysis approaches we hereby suggest the key satisfaction estimation metrics as proposed in [13].
In the first step, the similarity between the two approaches is calculated by applying Pearson Correlation Coefficient (PCC). Let us suppose, there are N experts and K stakeholder ap-proaches. The expert-approach matrix (EAM) for efficiency (e) value prediction is defined as:
EAM¼
e1;1 e1;K
. . . . . . . . .
eN;1 eN;K
2 6 6 6 6 4 3 7 7 7 7 5
For two approachesSAiandSAkthe PCC is applied in order to calculate the similarity
Table 13. Comparative Analysis of Different Methods.
Method PersonalityMetrics Technical Metrics
Selection Criteria
Attribute Adequacy
Complexity Guidelines Cost Effective
StakeMeter Yes Yes Yes Yes Yes Yes Yes
Ballejos & Montagna [39]
Partial × Partial × × Yes ×
Fuentes et al. [40] × × × × × × ×
Ballejos & Montagna [28]
× × × × × Partial ×
Press & Wegmann [22]
× × × × × Limited ×
Babar et al. [36] Limited Limited Partial Partial Yes Partial Yes
Boonstra [30] × × × × × × ×
Mitchel et al. [21] × × × × × Partial ×
Coakes & Elliman [24] × × × × × × ×
Pan [41] × × × × × × ×
Pouloudi [42] × × × × × Limited ×
Whitley et al. [43] × × × × × × ×
McManus [20] × × × × × Partial ×
Glinz & Wieringa [31] × × × × × Partial ×
Razali & Anwar [44] × × × × × Partial ×
Power [45] × × × × × Partial ×
Lim et al. [46] × × × × Partial Yes Partial
between the two by using the following formula:
SimðSAi;SAkÞ ¼
X
n2Uðen;i
eiÞðen;k
e kÞ ffiffiffiffiffiffiffiffiffiffiffiffiffiffiffiffiffiffiffiffiffiffiffiffiffiffiffiffiffiffiffiffiffiffiffiffi
X
n2Uðen;i
eiÞ
2
r ffiffiffiffiffiffiffiffiffiffiffiffiffiffiffiffiffiffiffiffiffiffiffiffiffiffiffiffiffiffiffiffiffiffiffiffiffi
X
n2Uðen;k
ekÞ
2
r ð11Þ
The similarity value between the two approaches is used to predict the value of the target ap-proach which isStakeMeterin this research. Ding et al. (2013) have later identified customer satisfaction, related to a cloud service, as a linear combination of perception functionfpand
dis-confirmation functionfdas proposed in the CSAT model [37]. Hence, the same function is
sug-gested here in this research in order to estimate the satisfaction of an industry professional or expert with respect to the efficiency of the existing stakeholder approaches. Let us suppose, for a target stakeholder approachSAithe expert satisfaction is denoted as:
EXnðrtÞ ¼fpðrtÞ þfd
rt rt
rþ t rt
ð12Þ
In order to evaluate the utility of the approach the constant relative risk aversion (CRAA) function can be applied as proposed in [38]. Lastly, the trustworthiness of an approach can be calculated by using thetrustnequation as given in [13].
The next phase for future research is to propose the multi-criteria based neuro-fuzzy in-spired intelligent decision support system in order to reduce the extent of complexity and expert biases.
Conclusion
The existing stakeholder quantification approaches are non-uniform, inconsistent, and time consuming. Moreover, the existing approaches do not provide the low level implementation details and stakeholder quantification metrics or factors. All these SIQ issues serve as a motiva-tion for this research. Hence, this research study contributes in the form of a new SIQ frame-work calledStakeMeterbased on the stakeholders’aspects and factors for the VBS systems. The framework is highly beneficial in terms of elaborated activities defined in the process. Moreover, the framework can also be used generically in the industry. The proposed SIQ framework provides professional support in stakeholder analysis and RE to business analysts and developers. The proposed frameworkStakeMeterprovides an easy way to initiate it as compared to the other proposed approaches and methods. Due to the unclear guidelines of the existing approaches the time spent on stakeholder analysis spans over several months and years. However, the time taken by the said frameworkStakeMeteris very less as compared to the other SIQ approaches and methods. The proposed stakeholder factors add knowledge to the SWEBOK and also support industry professionals.