Mara Lisa Miranda Marques
Licenciada
Orientador: Prof. Doutora Maria Alexandra Núncio de Carvalho Ramos Fernandes,
FCT/UNL
Presidente de Júri: Prof. Doutor José Paulo Nunes de Sousa Sampaio Arguente: Doutor Pedro Miguel Martinho Borralho
Vogal: Prof. Doutora Maria Alexandra Núncio de Carvalho Ramos Fernandes
Dezembro 2014
Dissertação para obtenção do Grau de Mestre em
Genética Molecular e Biomedicina
Monotherapy and combined therapy of new potential
antitumor compounds: antiproliferative activities and
Mara Lisa Miranda Marques
Licenciada
Orientador: Professora Maria Alexandra Núncio de Carvalho Ramos Fernandes,
FCT/UNL
Presidente de Júri: Prof. Doutor José Paulo Nunes de Sousa Sampaio Arguente: Doutor Pedro Miguel Martinho Borralho
Vogal: Prof. Doutora Maria Alexandra Núncio de Carvalho Ramos Fernandes
Universidade Nova de Lisboa
Faculdade de Ciências e Tecnologias
Departamento de Ciências da Vida
Monte de Caparica
Dezembro 2014
Dissertação apresentada na Faculdade de Ciências e Tecnologias da Universidade Nova de Lisboa para a obtenção do Grau de Mestre em Genética Molecular e Biomedicina
Monotherapy and combined therapy of new potential
antitumor compounds: antiproliferative activities and
III
Thesis publication
Review article
V
Monotherapy and combined therapy of new potential antitumor compounds: antiproliferative activities and biological targets.
© Mara Lisa Miranda Marques, FCT/UNL, UNL
VII
Acknowledgments
I would like to express my gratitude to my supervisor, Professor Alexandra Fernandes, whose expertise and assistance in writing this thesis added considerably to my graduate experience. I appreciate her vast knowledge in this field, and I would like to thank Professor Alexandra Fernandes for taking time out from her busy timetable to help me with this work.
I must also acknowledge Joana Silva for her guidance and presence along this year, supporting me with her experience and knowledge in the laboratory.
I would like to thank Catarina Rodrigues and Luís Raposo for their guidance in proteomics and, in alphabetical order, Ana Mendo, Carmen Gomez, Lídia Coito and Pedro Martins for their accessibility and exchanges of knowledge.
I would also like to thank to the Glycoimmunology Group of the Faculty of Medical Sciences in Lisbon, the Photochemistry and Supramolecular Chemistry Research Group and NanoTheranostics Group in FCT/UNL for their empathy and support, providing facilities for some experiments of this thesis.
IX Abstract
The in vitro antiproliferative potential of three new oxorhenium complexes in particular compounds 1 ([ReO3(PTA)2][ReO4]) and 2 ([ReO3(HMT)2][ReO4]) bearing the 1,3,5-triaza-7-phosphaadamantane (PTA) and the hexamethylenetetramine (HMT) ligands, respectively, and compound 3 ([ReO(Tpms)(HMT)]) bearing the tris(pyrazol-1-yl)methanesulfonate (Tpms) and HMT ligands, was evaluated in several cancer cell lines and fibroblasts. Compound 4, which is in a pending patent, bearing the trimeric polythiophene acetic acid (tPTAA) ligand, was also evaluated.
The rhenium compound 2 showed the best results on the colorectal cancer cell line with a relative IC50 of 88.6 +/- 7.1 µM.
Combined therapy using compound 2 and doxorubicin lead to a reduction of ~1.5x in the percentage of cell viability compared to doxorubicin alone. The combined therapy with compound 4 and cisplatin lead to a reduction of almost 3x in the percentage of cell viability compared with cisplatin alone.
Based on the spectroscopic titration with calf thymus DNA and the results of the electrophoretogram with plasmid DNA is proposed that compound 2 interacts weakly with ct-DNA and it has a non-covalent mode of binding. Furthermore, the low binding constant ~105 suggests that the interaction between the metal complex and DNA might not be intercalative in nature.
The fluorescence quenching assay of Human Serum Albumin showed a relatively moderate interaction between compound 2 and Human Serum Albumin with an average value of binding constant of the protein-quencher complex of 3.10 (+/- 1.2) x 103 M-1.
According to the comparative proteomic results, colorectal cancer cells exposed to compound 2 were more sensitive and prone to cell death due to alterations in the relative abundance of some heat shock proteins, a small GTPase and tubulin. On the other hand, Ezrin protein was more abundant on colon cancer cells exposed to compound 2 what could be an adaptive response inhibiting apoptosis. Proliferation-associated protein 2G4 overexpression might indicate that compound 2 triggers cell death by cell cycle arrest.
Tumor cell death was also evaluated. According to the results of fluorescence microscopy, compound 4 was more effective in killing tumour cells than compound 2. Apparently, apoptosis is not the main mechanism of cell death for compound 2 with 4.15 +/-1.16 % of apoptotic cells by Hoechst staining assay and 1.4% of early apoptotic cells and 13.3% of late apoptotic cells for cells exposed to compound 2 in the flow citometry.
XI
Table of contents
1 Introduction 1
1.1 Cancer in numbers 1
1.2 Cancer etiology 2
1.3 Cancer biology and therapeutics 3
1.3.1 Mutation acquisition 4
1.3.2 Proliferation barriers: oncogenes, cell senescence and tumor suppressors 5
1.3.3 Apoptosis, autophagy and necrosis 6
1.3.4 Inflammatory cells in tumor progression 7
1.3.5 Cell energy metabolism changes 8
1.3.6 Growth-promoting signaling and division deregulation 8
1.3.7 Angiogenesis 9
1.3.8 Metastasis formation 10
1.3.9 Tumor Microenvironment 10
1.4 Metallic compounds and doxorubicin 12
1.4.1 Cisplatin 12
1.4.2 Doxorubicin 13
1.4.3 Rhenium compounds 13
1.5 Work subject and objectives 15
2 Materials and Methods 16
2.1 Metalic compounds 16
2.2 Combined therapeutics 17
2.3 Cell lines 18
2.3.1 Tumour cell lines 18
2.3.2 Normal cell line culture 18
2.4 Cell lines culture and harvesting 19
2.4.1 Cell counting 19
2.5 Cell Viability assays 19
2.6 Flash photolysis 21
2.7 Study of the interaction between compounds and pUC18 plasmid DNA 22
2.7.1 Escherichia coli culture and DNA extraction 22
2.7.2 Plasmid DNA Electrophoretic procedure 22
XII
2.9 Human Serum Albumin interaction assays 24
2.10 Proteomic assay 24
2.10.1 Cell culture and lysis 24
2.10.2 Protein extract purification 25
2.10.3 Total protein quantification 25
2.10.4 SDS-PAGE for assessment of compound quantification 25
2.10.5 First dimension: IEF 26
2.10.6 Second dimension: SDS-PAGE 26
2.10.7 Gel Analysis 26
2.11 Hoechst 33258 staining 28
2.12 Flow cytometry 28
3 Results and Discussion 29
3.1 Antiproliferative activities 29
3.1.1 Combined therapeutics with compound 2 on colorectal cancer cell line 37
3.1.2 Compound 4 40
3.2 Laser Flash photolysis 44
3.3 Study of the interaction between compounds and pUC 18 plasmid DNA 47
3.4 DNA binding assays 48
3.5 Human Serum Albumin interaction assays 51
3.6 Proteomic analysis 54
3.7 Hoechst assay 60
3.8 Flow citometry 62
4 Conclusions 65
5 References 67
XIII
List of figures
Figure 1.1 Estimated Global Cancer Burden: number of new cases of cancer per year. 1
Figure 1.2 Estimated cancer mortality worldwide and in Portugal. 2
Figure 1.3 Development of colon carcinomas. 4
Figure 1.4 The anticancer drug cisplatin. 12
Figure 1.5 The anticancer drug doxorubicin. 13
Figure 1.6 From luminescent to light-induced anticancer Re complexes. 14
Figure 2.1 Illustrative scheme of cell viability assays. 20
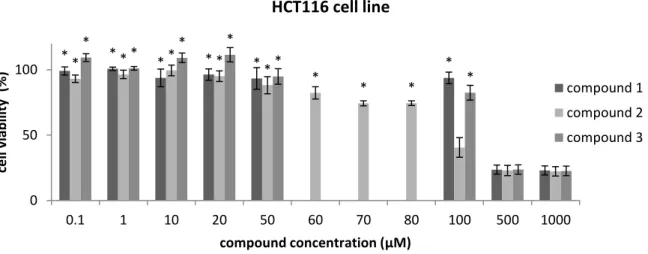
Figure 3.1 Cell viability assays in HCT116 cell line after 48 hours of treatment with compounds 1, 2 and 3. 29
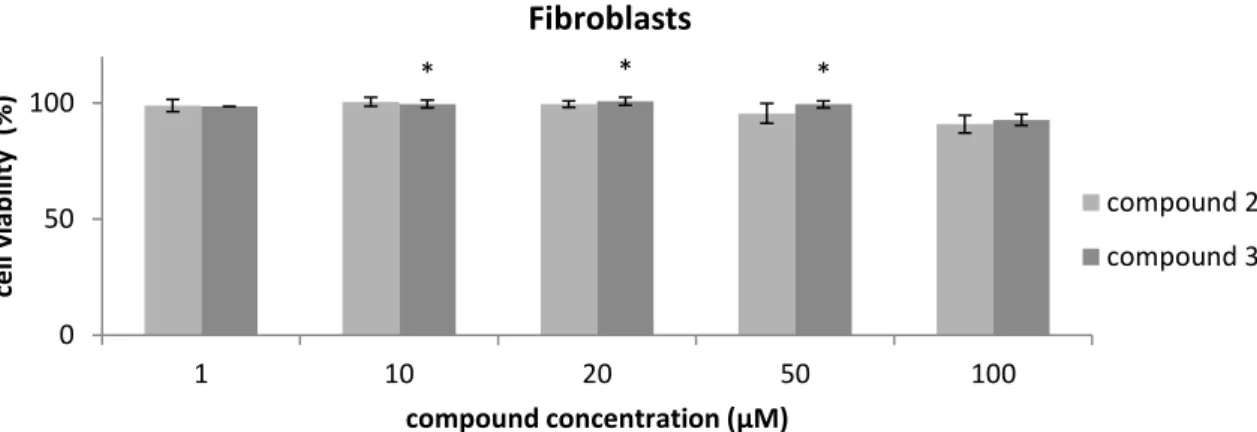
Figure 3.2 Cell viability assay in fibroblasts after 48 hours of treatment with compounds 2 and 3. 30
Figure 3.3 Cell viability assay in K562 cell line after 48 hours of treatment with compound 1, 2 and 3. 31
Figure 3.4 Cell viability assay in A549 cell line after 48 hours of treatment with compounds 1, 2 and 3. 33
Figure 3.5 Cell viability assay in H1650 cell line after 48 hours of treatment with compounds 2 and 3. 33
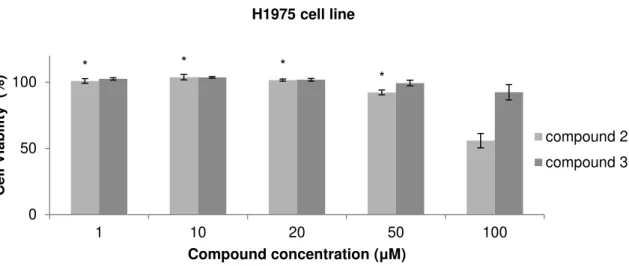
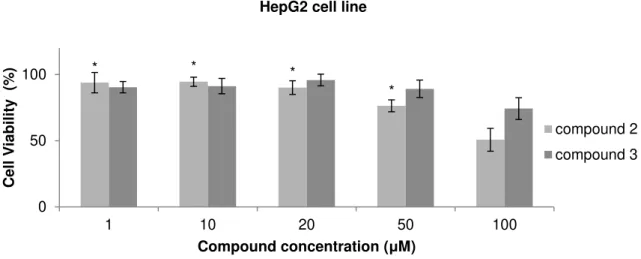
Figure 3.6 Cell viability assay in H1975 cell line after 48 hours of treatment with compounds 2 and 3. 34 Figure 3.7 Cell viability assay of MCF7 cell line after 48 hours of treatment with compounds 2 and 3. 34 Figure 3.8 Cell viability assay in HepG2 cell line after 48 hours of treatment with compounds 2 and 3. 35 Figure 3.9 Cell viability assay in MNT-1 cell line after 48 hours of treatment with compounds 2 and 3. 36
Figure 3.10 Cell viability in HCT116 cell line after combined therapy with compound 2 and cisplatin. 38
Figure 3.11 Cell viability in HCT116 cell line after combined therapy with compound 2 and cisplatin 39
Figure 3.12 Cell viability assay in HCT116 cell line after combined therapy. 39
Figure 3.13 Cell viability in HCT116 cell line after combined therapy with compound 2 and doxorubicin. 40 Figure 3.14 Cell viability in HCT116 cells after 48 hours of treatment with compound 4. 41 Figure 3.15 Cell viability assay in HCT116 cell line after 48 hours of treatment only with the tPTAA ligand of compound 4. 41 Figure 3.16 Cell viability in HCT116 cell line after combined therapy with compound 4 and doxorubicin. 42 Figure 3.17 Cell viability assay in HCT116 cell line after combined therapeutics with compound 4. 42 Figure 3.18 Cell viability in HCT116 cells after 48 hours of treatment with compound 4. 43 Figure 3.19 Transient absorption spectra of compound 2 in water and in methanol. 45
XIV
Figure 3.21 EMSA of 200 ng of pUC18 plasmid DNA after being exposed to compound 2. 47
Figure 3.22 EMSA of 200 ng of pUC 18 after being exposed to the compound 4. 48
Figure 3.23 Absorption spectra of compound 2 with ct-DNA. 49
Figure 3.24 Fluorescence spectrum of HSA and absorption spectrum of compound 2. 51
Figure 3.25 Fluorescence spectrum of HSA with compound 2. 52
Figure 3.26 Stern-Volmer plot obtained from the titration of HSA with compound 2. 52
Figure 3.27 Image of the 2-DE gels of HCT116 cell line treated during 48 hours. 54
Figure 3.28 HCT116 cells stained with Hoechst 33258 after treatment with DMSO. 60
Figure 3.29 HCT116 cells stained with Hoechst 33258 after treatment with compound 4 and compound 2 . 61
Figure 3.30 Evaluation of the apoptotic potential in HCT116 cells. Apoptosis was evaluated and quantified by
XV
List of tables
Table 2.1 Oxorhenium complexes bearing the water-soluble tris(pyrazol-1-yl)methaneulonate,
1,2,5-triaza-7-phosphaadamtane or related ligands. 16
Table 2.2 Tumoral cell lines that are used in this work. 18
Table 2.3 Energy transfer assay table with volumes of compound 2 stock added to the quartz cuvette with
benzophenone during the titulation. 21
Table 2.4 Conditions of the Isoelectric Focusing program in Ettan IPGphor3 IEF System. 26
Table 3.1 Cell viability assays results for rhenium compounds. 37
Table 3.2 Energy transfer assay. 46
Table 3.3 Spectrophotometric assays of the interaction of compound 2 with calf-thymus DNA. 49
Table 3.4 Stern-Volmer constant for compound 2. 52
Table 3.5 HSA binding constant for compound 2, represent as Kd +/- SEM. 53
Table 3.6 Proteins whose expression was significantly changed relatively to the control in HCT116 cells exposed
to compound 2. Proteins responsible for the maintenance of the cytoskeleton. 55
Table 3.7 Proteins whose expression was significantly changed relatively to the control in HCT116 cells exposed
to compound 2. 56
Table 3.8 Proteins whose expression was significantly changed relatively to the control in HCT116 cells exposed
to compound 2. 58
Table 6.1 Lysis Buffer constitution. 85
Table 6.2 Rehidration Buffer constitution. 85
Table 6.3 SDS loading buffer constitution. 85
Table 6.4 Poliacrilamide gels constitution. 86
Table 6.5 Electrophoresis buffer. 86
Table 6.6 Staining solution for proteomic gels. 86
XVII 1433z acac ACTG AMPL ANXA2 APC ATCC Bak Bax Bcl-2 Bcl-xL Bim CALR c-MET CSCs Ct-DNA DHE3 DMEM DMSO DTT ECM EDTA EGF EMT ENOA ENPL EZRI FDA GLUT1 GRP75 HER HMT HSA HSP HSP7C IARC IC50 IEF IGF-1R
14-3-3 protein zeta acetylacetonate Actin Gamma 1 protein Cytosol aminopeptidase Annexin A2 protein
Adenomatous polyposis coli American Type Culture Collection Bcl-2 homologous antagonist/killer Bcl-2-like protein 4
B-cell CLL/lymphoma protein 2 Bcl-2-like protein 1 isoform Bcl-2-like protein 11 Calreticulin protein
Hepatocyte growth factor receptor Cancer Stem Cells
Calf Thymus-DNA
Glutamate dehydrogenase
Dulbecco’s Modified Eagle Medium Dimethylsulfoxide
Dithiothreitol Extracellular Matrix
Ethylenediamine tetraacetic acid Epidermal Growth Factor
Epithelial–mesenchymal transition Alpha-enolase protein
Endoplasmin Ezrin protein
Food and Drug Administration Glucose transporter 1 protein 75 kDa glucose regulated protein Epidermal growth factor receptor Hexamethylenetetramine
Human Serum Albumin Heat Shock Protein
Heat shock cognate 71 kDa protein
International Agency for Research on Cancer Half maximal inhibitory concentration
Isoelectric focusing
Insulin-like growth factor 1 receptor
Abreviations
XVIII IF4A2 KRAS MALDI-TOF MAPK MAPs MMP-9 MTS MYC MW Nd-YAG NF1 NF2 NSCLC P4HB PA2G4 PBS PDIA3 PI3K PIK3CA PMS PMSE1 PMSF PTA PTEN PUMA PUR9 RAF RANG RAPTA RAS RB Re RPM ROS RSSA RTK SDS-PAGE TNF-
Eukaryotic initiation factor 4A-II Kirsten Rat Sarcoma viral oncogene
Matrix Assisted Laser Desorption/Ionization-Time of Flight Mitogen-Activated Protein Kinase
Microtubule-associated proteins Matrix Metalloproteinase-9
3-(4,5-dimethylthiazol-2-yl)-5-(3-carboxymethoxyphenyl)-2-(4-sulfophenyl)-2H-tetrazolium
v-myc avian myelocytomatosis viral oncogene homolog Molecular Weight
Neodymium-doped yttrium aluminium garnet Neurofibromin 1 tumour suppressor
Neurofibromin 2 gene (Merlin) Nonsmall cell lung cancer
Prolyl 4-hydroxylase beta polypeptide Proliferation-associated protein 2G4 Phosphate buffered saline
Protein disulfide isomerase family A member 3 Phosphatidylinositol-3 Kinase protein
Phosphatidylinositol-4,5-bisphosphate 3-kinase, catalytic subunit alpha Phenazine methosulfate
Proteasome activator subunit 1 protein Phenylmethanesulfonyl fluoride 1,3,5-triaza-7-phosphaadamantane
phosphatase and tensin homolog tumour suppressor Bcl-2 binding component 3
Bifunctional purine biosynthesis protein Raf-1 proto-oncogene, serine/threonine kinase Ran-specific GTPase-activating protein Ruthenium(II)−Arene PTA Complexes Retrovirus associated sequence oncogene Retinoblastoma-associated protein
Rhenium
Rotations per Minute Reactive Oxygen Species 40S ribosomal protein SA Receptor tyrosine kinase
XIX SCLC SEM SGTA SHC SI SSCs STIP1 TBA1B TCPG TEMED TGF-
TP53 Tpms tPTAA TSP-1 VEGF VHL WHO
Small cell lung cancer Standard Error of the Mean
Small glutamine-rich tetratricopeptide repeat-containing protein alpha Src Homology 2 Domain Containing pathways
Selectivity Index Semicarbazones
Stress-induced-phosphoprotein 1 Tubulin alpha-1B chain protein T-complex protein 1 subunit gamma Tetramethylethylenediamine Transforming Growth Factor Tumor Protein p53
Tris (pyrazol-1-yl)methanesulfonate trimeric polythiophene acetic acid Thrombospondin- 1 protein
1
1
Introduction
1.1 Cancer in numbers
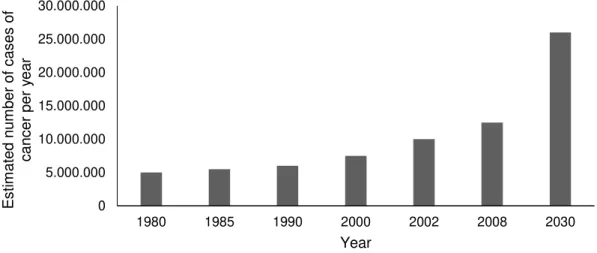
Cancer is one of the main causes of death. According to the World Health Organization, 8.2 million people worldwide died from cancer in 2012, although the chemotherapeutic agents available (International Agency for Research on Cancer (IARC), 2012). The trend for the Estimated Global Cancer Burden, according to the data since 1980 (Figure 1.1), is a considerable increase, even though the public health action by governments and health practitioners. In addition, current chemotherapeutic agents are highly toxic. This indicates the need of new pharmaceuticals with reduced toxicity and more effective therapeutics.
Figure 1.1 Estimated Global Cancer Burden: number of new cases of cancer per year (adapted from IARC,
2008). The figure shows data from 1980, 1985, 1990, 2000, 2002, 2008 and a prevision for 2030 (IARC, 2008).
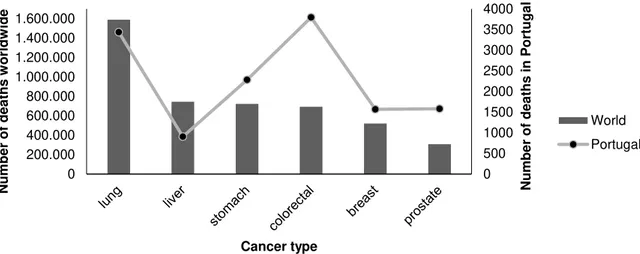
The difference between developed and developing countries is reflected on the incidence of specific types of cancer. Richer countries have incidence rates of cancer more than the double in relation to developing countries. Europe and America are the regions with the highest incidence of all forms of cancer. Lung (1.59 million deaths, 19.4% of the total), liver (745.500 deaths, 9.1% of the total), stomach (723.000 deaths, 8.8% of the total), colorectal (694.000 deaths, 8.5% of the total), breast (522.000 deaths) and prostate (307.000 deaths) cancers cause most of the deaths, worldwide. Lung Cancer is the most common and the deadliest cancer in the world mainly due to tobacco smoking, being women less affected by this particular type of cancer due to cultural reasons. Colorectal cancer is the third most common cancer in men (10 % of the total) and the second in women (9.2 % of the total) worldwide, and the deadliest type of cancer in Portugal (3797 deaths, 15.7% of the total) (see Figure 1.2).
0 5.000.000 10.000.000 15.000.000 20.000.000 25.000.000 30.000.000
1980 1985 1990 2000 2002 2008 2030
2
Figure 1.2 Estimated cancer mortality worldwide (columns) and in Portugal (line) (adapted from IARC, 2012).
1.2 Cancer etiology
Cancer is not a modern disease. However, the world is facing a situation without precedent as the proportion of older people and life expectancy increase throughout the world, what makes chronic diseases such as cancer more common nowadays. It is also important to observe that the potential economic and social costs of cancer rise sharply with age (WHO, 2011). This link between aging and cancer has been studied and some reasons were pointed. An increase in mutations is proposed as an aging mechanism mainly due to the accumulation ofmutations in the nuclear genome (Kennedy et al., 2012). The genomic instability generates random mutations, chromosomal rearrangements and dysregulation of epigenetic mechanisms that promote tumor progression (Berdasco and Esteller, 2010). Some authors indicate the disruption of the correct functioning of telomerase and telomere length as other cause. Tumor cells can prevent the loss of telomeres by telomerase upregulation due to alterations in the function of proteins that interact or interfer with the telomeres at the level of chromatin (Blasco, 2005). Other links between aging and cancer are described elsewhere (Campisi, 2013; Finkel et al., 2007).
In addition, there is an increased exposure to etiological agents. External factors as well as internal factors (inherited mutations, hormones, immune conditions and mutations resulting from metabolism) may act together or in sequence to initiate cancer development (WHO, 2013). Tobacco smoke influence on lung cancer incidence and mortality was already mentioned before (see 1.1). Other examples are the bacterium Helicobacter pylori that predisposes to stomach cancer (Jemal et al., 2010) and the human papilloma virus that is responsible for infections that can originate cervical cancer (Subramanya et al., 2008). Additional causes are based on the eating habits and physical activity. It is estimated that one in every ten cancers in Western populations are due to an inadequate intake of vegetables and fruit and excessive consumption of red meat (Daniel et al., 2011; IARC, 2003). Other studies corroborate these causes (Bao et al., 2013; Bravi et al., 2013; Kandaswami et al., 2005). Pollution of air, soil and water (Berman et al., 2008; Abnet, 2007; Chen et al., 2004; Desai et al., 2004) and ionizing radiation (Robertson et al., 2013; Sethi et al., 2012; Krewski et al., 2005; Shinji et al., 2004; Pavia et al., 2003;) are other well known causes of cancer as described elsewhere.
3
1.3 Cancer biology and therapeutics
There are several different kinds of cancer that can be included in four main groups: carcinoma, sarcoma, lymphoma/leukemia and cancers derived from cells of the nervous system. Both carcinomas and sarcomas are solid tumours. Carcinomas are solid malignant lesions originating in the epithelial tissue. Sarcomas are solid tumours of the connective tissue, such as bone and muscle. Leukemia and lymphoma are malignancies originating in haematopoeitic or immune cells that are found throughout the vascular system (Alberts et al., 2008).
All groups of cancer have in common an abnormal cell proliferation that gives rise to a neoplasm, but not all give rise to a mass of cells, e.g. leukemia (Hutter, 2010). Malignant neoplasms show a high level of anaplasia (lack of differentiation), the ability of invading neighbouring structures and to spread through the lymphatic system and bloodstream to other organs originating secondary tumors through a process called metastazation (Alberts et al., 2008).
The human tumorigenesis is considered a multistep process. Sustaining proliferative signaling, growth suppressors’ evasion, cell death resistance, replicative immortality, angiogenesis induction, invasion activation and finally metastasis formation are considered the main steps. They are acquired in different tumor types via distinct mechanisms and at different points during the course of the tumorigenesis. The tumor progression can be viewed as a sequence of clonal expansions, each of which is triggered by the accidental acquisition of somatic mutations that confers selective advantage. This advantageous mutant genotype enables their outgrowth and an eventual dominance in a local tissue environment (Hanahan and Weinberg, 2011).
In terms of therapeutics, cancer can be treated by surgery, radiation, chemotherapy, hormonal therapy, and targeted therapy. An early detection of cancer results in a less expensive treatment and better results. While surgical resection and adjuvant therapy can cure well confined primary tumors, metastatic disease is largely untreatable because of their systemic nature and the resistance of tumor cells to existing therapeutic agents (Gupta and Massagué, 2006). However, molecular and cell-biological details of the tumour progression process are emerging and influencing the therapeutics available (Valastyan and Weinberg, 2011). Surgery and radiotherapy dominated the field of cancer therapy into the 1960s until new data showed that combinating chemotherapy could cure patients with various advanced cancers (Vincent T. et al., 2008).
4
1.3.1 Mutation acquisition
The development of tumours from single cells that begin to proliferate abnormally, called tumour clonality, is one important characteristic of cancer. Although this single cell origin, some fundamental changes are needed in order to develop cancer. The development of cancer is viewed as a multistep process involving mutation and selection for cells with progressively increasing capacity for proliferation, survival, invasion, and metastasis (Hanahan and Weinberg, 2011; Cooper, 2000).
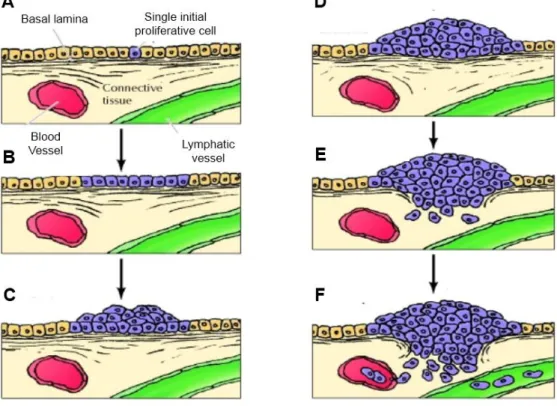
Studies of colon carcinomas provide an example of tumour progression during the development of cancer (see Figure 1.3).
Figure 1.3 Development of colon carcinomas (Adapted from Cooper, 2000). A single initially altered cell (A)
begins to proliferate and gives rise to a proliferative cell population (B), which progresses first to benign adenomas (C) of increasing size (D) and then to malignant carcinoma (E and F). In this phase, cancer cells invade the underlying connective tissue and penetrate blood and lymphatic vessels, spreading throughout the body.
5
hypermethylation, resulting in switch off of tumor suppressor genes, indicated as CpG island methylator phenotype (Bogaert and Prenen, 2014; Mojarad et al., 2013).
Some of these mutations confer a selective advantage to the cell, e.g. more rapid growth, and by a process called clonal selection, the descendants of this cell will consequently become dominant within the tumour population. Clonal selection during tumour development, also aids tumours becoming increasingly malignant (Hanahan and Weinberg, 2011; Alberts, 2008; Cooper, 2000).
Malignant carcinomas then arise from the benign adenomas characterized by invasion of the tumour cells through the basal lamina into underlying connective tissue. In the connective tissue of the colon wall cancer cells continue to proliferate and spread. Then, the cancer cells penetrate the wall of the colon and invade other abdominal organs. In addition, the cancer cells invade blood and lymphatic vessels, allowing them to metastasize throughout the body (Cooper, 2000). In a molecular level, Epithelial-mesenchymal transition (EMT, see section 1.3.8) is an important early event involved in invasion and metastasis of colorectal cancer. Some alterations in EMT include vimentin hyperexpression that iniciates the molecular program, and genes involved in invasion such as N-cadherin with a decrease expression of genes involved in epithelial cell adhesion such E-N-cadherin, and even its loss. Progression in colon cancer is also characterized by activating mutations in Ras genes and tumor growth factor action (Todosi et al., 2012).
1.3.2 Proliferation barriers: oncogenes, cell senescence and tumor suppressors
Genes important for cancer development can be grouped into two main classes. Genes in which a gain-of-function mutation promotes cancer are called proto-oncogenes. The mutant forms are called oncogenes. Oncogenes are cancer-promoting genes. Many of them are involved in the mitogenic signaling pathways. Genes of the second group are called tumour suppressor genes. A loss-of-function mutation in a tumour suppressor gene can contribute to cancer (Alberts, 2008).
Oncogene signaling deregulation is important for cell proliferation however there is no universal response to an increasing expression of oncogenes. In contradiction with the notion that elevated expression of oncogenes increases cancer cells proliferation and thus tumor growth, some studies indicates that excessively elevated signaling by RAS (Retrovirus associated sequence oncogene), MYC (v-myc avian myelocytomatosis viral oncogene homolog), and RAF (Raf-1 proto-oncogene, serine/threonine kinase) oncoproteins can provoke induction of cell senescence and/or apoptosis (Collado and Serrano, 2010). Other function for oncogenes operating within tumor cells, such as Ras and Myc, is upregulating the expression of angiogenic factors that promote angiogenesis. Cell senescence is a protective barrier to neoplastic expansion. Senescence is a cell nonproliferative but viable state characteristic of premalignant tumor stages, but it is absent from malignant tumors. Tumor suppressors can induce or prevent senescence. Deletion of tumor suppressors PTEN (phosphatase and tensin homolog), VHL (von Hippel-Lindau), NF1 (neurofibromin 1) and RB (retinoblastoma-associated) leads to excessive proliferative signaling and ultimately to senescence (Collado and Serrano, 2010).
6
the RB protein also integrates signals from extracellular sources. The ‘‘guardian of the genome’’, TP53 (Tumour protein P53), is involved in preserving genomic integrity. Depending of the context, P53 can stop the cell-cycle progression or trigger apoptosis, the last one in case of irreparable damages (Jackson and Bartek, 2009). Although P53 and RB absence permits persistent cell proliferation they are not essencial. There are studies that reflect a functional redundancy that restrict replication of cells lacking these proliferation suppressors. Tumor suppressor genes, in addition to their cell-cycle progression interference, can also contribute to contact inhibition that is abolished in cancer cells. For example, the protein Merlin, the product of the gene NF2, by sequestering growth factor receptors, limits its ability to efficiently emit mitogenic signals (Curto et al., 2007). In this way, Merlin absence promotes cancer cells proliferation.
As stated before, many oncogenes are involved in mitogenic signaling pathways. p38α is a tumour suppressor gene and is a mediator of Mitogen-activated protein kinase pathway, involved in resistance to cisplatin, irinotecan and 5-fluorouracil chemotherapy in colorectal cancer patients. Despite its tumour suppressor activity in some tissues, the p38α pathway may also acquire an oncogenic role involving cancer related-processes such as cell metabolism, invasion, inflammation and angiogenesis (Grossi et al., 2014).
There are some suggestions of therapeutic exploration of the pathways involving oncogenes and tumor supressors described by other authors (Shanker et al., 2011; Luo et al., 2009).
1.3.3 Apoptosis, autophagy and necrosis
Apoptosis, in which a cell contracts and is consumed by neighbors, is triggered by diverse stresses as signaling imbalances resulting from elevated levels of oncogene signaling and DNA damage. Apoptosis is divided into two pathways: the extrinsic apoptotic pathway (death receptor), involving the Fas ligand/Fas receptor that receives extracellular death-inducing signals and the intrinsic pathway (mitochondrial) that integrates a variety of signals of intracellular origin as those originated during radio- and chemotherapy. Apoptosis is tightly regulated by the balance between pro- and antiapoptotic proteins. In human cancers, overexpression of antiapoptotic proteins such as Bcl-2 (B-cell CLL/lymphoma 2) and Bcl-xL (Bcl-2-like protein 1 isoform), or downregulation of proapoptotic factors such as Bax (bcl-2-like protein 4), Bim (Bcl-2-like 11) and Puma (Bcl-2 binding component 3) is observed (Bai and Wang, 2014).
As stated before, Bcl-2 is an antiapoptotic protein. However, Zeestraten and co-workers reported that from studies on colorectal cancer patients to determine Bcl-2 expression, upregulation of Bcl-2 was related with better survival. The explanations rised for this is the fact that Bcl-2 can also exert a distinct negative influence on cell cycle progression, which can eventually slow down tumor growth. The role of Bcl-2 may also depend on disease stage (Zeestraten et al., 2013).
7
recycled and thus used for biosynthesis and energy metabolism. Autophagy machinery has both regulatory and effector components (Levine and Kroemer, 2008) and there is a link between autophagy and apoptosis. Mice bearing inactivated alleles of the Beclin-1 gene or of certain other components of the autophagy machinery exhibit increased susceptibility to cancer (White and DiPaola, 2009; Levine and Kroemer, 2008). Beclin-1 is a member of the BH3-only subfamily of apoptotic regulatory proteins, and its BH3 domain allows it to bind the Bcl-2/Bcl-xL proteins. Stress-sensor-coupled BH3 proteins can displace Beclin-1 from its association with Bcl-2/Bcl-xL, enabling the liberated Beclin-1 to trigger autophagy, much as they can release proapoptotic Bax and Bak (Bcl-2 homologous antagonist/killer) to trigger apoptosis.
In contrast to apoptosis and autophagy, necrotic cells swollen and explode releasing proinflammatory signals into the local tissue microenvironment, and in some circumstances under genetic control (Galluzzi and Kroemer, 2008). Necrotic cells can recruit immune inflammatory cells and promote cell proliferation given that immune inflammatory cells are capable of promoting angiogenesis, cancer cell proliferation, and invasiveness. Additionally, necrotic cells can release bioactive regulatory factors, such as IL-1a, which can directly stimulate neighboring viable cells to proliferate (Grivennikov et al., 2010). Consequently, necrotic cell death can also stimulate cell proliferation. Other authors show that although this contradictory effects, necrosis could have a fundamental role in tumor clearance by stimulating the innate immune response (Guerriero et al., 2008).
In relation to anticancer therapeutics, apoptosis, necrosis, mitotic catastrophe, senescence, and autophagy are the main types of cell death and cytostatic mechanisms described so far (Guerriero et al., 2008). There are studies about some compounds to modulate the activity of Bcl-2 family members or inhibit negative regulators of caspases such anticancer peptidic compounds that induce apoptosis of tumor cells (Barras and Widmann, 2011). Other review highligths the development of small-molecule inhibitors targeting three major classes of antiapoptotic proteins (Bai and Wang, 2014). New drugs could be designed for targeting the major players in autophagy however more studies are needed to better understand the relationship between autophagy and cancer (Lisiak et al., 2014).
1.3.4 Inflammatory cells in tumor progression
8
1.3.5 Cell energy metabolism changes
In cancer cells some metabolic changes occur in order to support continuous cell growth and proliferation (Wu and Zhao, 2013; Negrini et al., 2010). Even in the presence of oxygen, cancer cells can limit their energy metabolism to glycolysis. As cancer cells obtain less energy with glycolysis compared to mitochondrial oxidative phosphorylation, they upregulate glucose transporters such as Glucose transporter 1 (GLUT1), which increases glucose import into the cytoplasm (Jones and Thompson, 2009; DeBerardinis et al., 2008). Glycolytic fueling has been shown to be associated with activated oncogenes (e.g., RAS, MYC) and mutant tumor suppressors (e.g., TP53) (Jones and Thompson, 2009; DeBerardinis et al., 2008) whose alterations in tumor cells have been selected primarily for their benefits in promoting tumour progression. Other studies show tumours with two subpopulations of cancer cells that function symbiotically: one subpopulation consists of glucose-dependent (‘‘Warburg-effect’’) and other subpopulation of cells that preferentially import and utilize the lactate produced by the first group (Kennedy and Dewhirst, 2010; Feron, 2009; Semenza, 2008).
Some antineoplastic agents that have been used in the clinic for a long time – such as 5-fluorouracil, methotrexate and gemcitabine – inhibit metabolic enzymes. This leads to the idea that some drugs that are currently licensed by the US Food and Drug Administration (FDA) for use in patients with metabolic disorders may exert antineoplastic effects. Other possible antineoplastic agents indicated are metformin, phenformin and fibrates (Galluzzi et al, 2013).
1.3.6 Growth-promoting signaling and division deregulation
Cancer cells have the ability of continual proliferation. The growth-promoting signals bind to cell-surface receptors, typically containing intracellular tyrosine kinase domains, to regulate the cell growth and division. Cancer cells can deregulate the growth-promoting signals by autocrine proliferative stimulation. Structural alterations in the receptor molecules or the constitutive activation of components of signaling pathways operating downstream of the receptors (that can happens by somatic mutations) can also facilitate chronic proliferation. Some tyrosine-kinase inhibitors have been introduced in cancer therapeutics (Leeuwen et al., 2014). Cancer cells may also send signals to their microenvironment (see 1.3.9) to stimulate normal cells within the supporting tumor-associated stroma supplying cancer cells with growth factors (Hanahan and Weinberg, 2011).
Some authors also observed that members of the mitogen-activated protein kinase (MAPK) and phosphatidylinositol-3 kinase (PI3K) cascades are good targets for anticancer therapeutics, as some of these proteins are involved in the cell survival mechanisms (Mester and Redeuilh, 2008).
9
increased tumorigenicity, metastatic potential of cancer cells and resistance to chemotherapy. When associated with some apoptotic factors, some heat shock proteins become anti-apoptotic proteins with the ability to block the cell death process (Horváth and Vígh, 2010; Multhoff and Hightower, 2011).
However, some treatments can trigger the cell membrane accumulation of heat shock proteins and promote anti-tumour T cell response (Kroemer et al., 2013; Krysko et al., 2013). Altogether, HSP27, HSP70 and HSP90 are emergent targets for anticancer therapeutics.
Other relevant target in anticancer therapeutics is the tubulin/ microtubule system due to its role in cell division. Drugs that interfere with microtubule function inhibit the proliferation of cancer cells by preventing the correct formation of the mitotic spindle (Pasquier and Kavallaris, 2008). Alterations in expression of tubulin isotypes, in the tubulin post-translational modifications, and in the expression of microtubule-associated proteins (MAPs) are thought to influence cellular responses to chemotherapeutics (Parker et al., 2014).
Besides mitotic spindle assembly, Ran also regulates nuclear envelope formation and cell cycle checkpoint control. Ran is a small ras-related GTPase that controls the nucleocytoplasmic exchange of macromolecules across the nuclear envelope, and is overexpressed in a range of tumors, such as breast and renal. Oncogenic KRAS (Kirsten Rat Sarcoma viral oncogene) or PIK3CA (phosphatidylinositol-4,5-bisphosphate 3-kinase, catalytic subunit alpha) mutations makes some tumors addicted to Ran expression. Decreasing the endogenous levels of Ran in the cell could have anti-mitotic effects and consequently contribute to the development of an effective cancer therapeutic (Matchett et al., 2014).
Other possible targets are among the purine ring de novo synthesis pathways. The synthesis of the purine ring de novo is required when DNA is replicated. The requirement to synthesize new purines in differentiated cells is smaller because the salvage pathway “recycle” nucleotides to the everyday needs.In this way, de novo synthesis of the purine ring is low in differentiated cells. This all together make inhibitors of the purine de novo synthesis effective drugs against cancer (Adam T., 2005).
1.3.7 Angiogenesis
Angiogenesis is activated early during the development of invasive cancers, causing normally quiescent vasculature to continually sprout new vessels that help sustain expanding neoplastic growths. Tumor neovasculature is marked by premature capillary sprouting, distorted and enlarged vessels, leakiness, and abnormal levels of endothelial cell proliferation and apoptosis (Nagy et al., 2010). In addition, tumors exhibit diverse patterns of neovascularization depending on the interactions between cancer cells and the associated stromal microenvironment (Baeriswyl and Christofori, 2009).
10
include dominant oncogenes operating within tumor cells, such as Ras and Myc that can upregulate the expression of angiogenic factors, whereas in others, such inductive signals are produced indirectly by immune inflammatory cells (Wang and Miao, 2013; Hanahan and Weinberg, 2011).
1.3.8 Metastasis formation
Metastasis remains the major cause of mortality in patients with cancer. After angiogenesis and local invasion, distant metastasis formation is another step towards a higher grade of malignancy. The invasion-metastasis cascade is characterized by the invasion of epithelial cells of primary tumors into surrounding extracellular matrix and stromal cell layers (local invasion), entry into the lumina of blood vessels, transport through the vasculature (physical dissemination through lymphatic and hematogenous systems) and arrest at distant organ sites and into the parenchyma of distant tissues. In these distant sites the epithelial cells from the primary tumor form micrometastases, and in certain conditions re-initiate their proliferative programs, generating macroscopic tumors clinically detectable (Fidler, 2003).
There are three types of invasiveness known: “mesenchymal”, “collective invasion” and
“amoeboid” form of invasion. During the invasion-metastasis cascade cancer cells typically developed
alterations in their shape as well as in their attachment to other cells and to the extracellular matrix (ECM). The Epithelial-Mesenchymal Transition (EMT) program regulates a particular type of invasiveness that has been named ‘‘mesenchymal’’. EMT is a program that can be activated transiently or stably, and to differing degrees (Hanahan and Weinberg, 2011). The transcriptional regulators Snail, Slug, Twist, and Zeb1/2 that are normally expressed during embryogenesis are also expressed in various combinations in the EMT program during tumor development. They are responsible for the loss of adherens junctions and associated conversion from a polygonal/epithelial to a spindly/fibroblastic morphology, expression of matrix-degrading enzymes, increased motility, and heightened resistance to apoptosis (Hanahan and Weinberg, 2011). Several of these transcription factors can directly repress E-cadherin (a cell-to cell adhesion molecule) gene expression, favoring invasion and metastasis (Peinado et al., 2004). Other forms of invasion are described elsewhere (Madsen and Sahai, 2010; Sabeh et al., 2009).
Most of the studies on cancer are done in primary tumors even though primary tumors and metastases can differ in expression profiles. Targeting the outgrowth at a distant site (metastatic colonization), by targeting the metastatic cancer cell or the host cell, or by interrupting reciprocal interactions between tumor cells and the microenvironment are considered the most relevant therapeutics. Some target candidates are pointed elsewhere (Steeg and Theodorescu, 2008).
1.3.9 Tumor Microenvironment
11
Settleman, 2010). Being considered responsible for cancer initiation, progression, metastasis, recurrence and drug resistance, they are actracting attention for the development of new anticancer therapies (Chen et al., 2013).
12
1.4 Metallic compounds and doxorubicin
Metals are essential cellular components with unique characteristics that include redox activity, variable coordination modes, and reactivity towards organic substrates what makes the coordination complexes with a metal ion, good candidates for anticancer agents (Frezza et al., 2010).
The type of metal bonded to carbon subdivides metallic compounds in two distinct types. One type involves compounds containing the main group elements such as the alkali and alkaline earth metals, and the more metallic elements in the zinc, boron, carbon, nitrogen, and oxygen vertical groups in the periodic table. The other type includes compounds containing transition metal elements. One of the features of transition metal chemistry that is not shared by main group elements is the potential for formation of metal-metal multiple bonds. This property of transition metals resulted in the foundation of coordination complexes with variable coordination modes (Martins et al., 2014; Hartinger and Dyson, 2009).
To date, practically all transition and main group metals have been tested for antitumor properties. The antineoplastic potential of compounds of several metals such as gallium, ruthenium and titanium was recognized more than two decades ago. The number of metal compounds in current clinical use for the cancer therapy is extremely limited (Jakupec et al., 2008). Platinum drugs are still the most used chemotherapeutic drugs (see section 1.4.1). Doxorubicin is not a metallic drug, but is also a reference chemotherapeutic drug (see section 1.4.2).
1.4.1 Cisplatin
Although the potential of the diverse metals in periodic table, cisplatin (Figure 1.4) impact influenced the antitumor agents development towards platinum compounds (Jakupec et al., 2008).
Figure 1.4 The anticancer drug cisplatin (Adapted from Food and Drug Administration, 2011).
Platinum complexes such as cisplatin are clinically used as adjuvant therapy of cancers.
Cisplatin is used to treat cancers including: sarcoma, small cell lung cancer, germ cell tumors, lymphoma, and ovarian cancer. Other platinum drugs include carboplatin, a drug with fewer and less severe side effects introduced in the 1980s, and oxaliplatin, a drug which is part of the FOLFOX (5-FU, leucovorin, and oxaliplatin) treatment for colorectal cancer. Cisplatin is frequently given as part of a combination chemotherapy regimen with other drugs and it continues to find uses, especially as it is synergistic with other agents (Florea and Büsselberg, 2011).cisplatin-13
resistant. To minimize or avoid this, combinatorial therapies are being developed (Florea and Büsselberg, 2011).
1.4.2 Doxorubicin
Doxorubicin (Figure 1.5) is an anthracycline antiobiotic without a metallic center but has shown great treatment potential, being regarded as one of the most potent of the Food and Drug Administration-approved chemotherapeutic drugs. The drug is a nonselective class I anthracycline, possessing aglyconic and sugar moieties (Tacar et al., 2012).
Doxorubicin is given to treat non-Hodgkin's lymphoma, multiple myeloma, acute leukemias, Kaposi sarcoma, Ewing sarcoma, Wilm tumor, and cancers of the breast, adrenal cortex, endometrium, lung, ovary, and other sites. There are also some studies on colorectal cancer cell lines (Tacar et al., 2012).
Doxorubicin acts by binding to DNA-associated enzymes, such as topoisomerase enzymes I and II, and it can intercalate the base pairs of the DNA’s double helix. By binding to her targets a range of cytotoxic effects occurs in conjunction with the antiproliferative role, however this effect is limited by its toxicity on normal cells, being cardiotoxicity the major concern regarding the use of doxorubicin (Tacar et al., 2012). New therapies are needed to minimize the doxorubicin dose used in cancer treatment.
Figure 1.5 The anticancer drug doxorubicin (Adapted from Inspiralis, 2006).
1.4.3 Rhenium compounds
In line with these problems, rhenium compounds have been studied for some imaging and therapeutic applications, (Bertrand et al., 2014; Lecina et al., 2014; Smilkov et al., 2014; Hanson et al.,2012; Wuest et al., 2012), including anticancer therapeutics.
14
The biodistribution and targeting ability of a compound are determined by a number of factors, such as the oxidation state of the metal, as well as the charge, polarity and lipophilicity of the complex. Some rhenium compounds are transported as perrhenate (ReO4-), which is the most stable, water-soluble rhenium oxide in the +VII oxidation state (Yumata, 2010).
Besides radiopharmaceuticals are derivatives of a nontoxic luminescent probe of rhenium applied for biological imaging that were discovered to have antitumor properties when irradiated at a suitable wavelength. Replacing just the 2,2’-bipyridine in 4 with 2-(2’-pyridyl)indolato and its derivatives (1–3) changes the physicochemical and biological properties of such rhenium(I) complexes (see Figure 1.6) making them toxic for cancer cells (Dieckmann et al., 2013).
Figure 1.6 From luminescent (4) to light-induced anticancer Re complexes (adapted from Dieckmann et al.,
2013).
15
1.5 Work subject and objectives
Cisplatin, oxaliplatin, related metallodrugs as well doxorubicin are extensively used in the treatment of a diversity of cancers. However these drugs are highly toxic and tumor becomes drug-resistance (Holohan et al., 2013). On the other hand, in addition to drug resistance there are also complicated side effects (Tacar et al., 2012). These facts indicate the need for cytotoxic agents with less toxicity, more tumour specific and devoid of drug resistance. New metallic compounds that could be more selective to cancer cells could fulfil these requirements.
The present work is based on the latest studies of rhenium compounds and their anticancer therapeutic properties with alternative mechanisms of action and possible uses in combined therapeutics (Collery et al., 2014; Kitanovic et al., 2014; Pracht et al., 2013; Wang et al., 2013; Collery et al., 2012; Martínez-Lillo et al., 2011).
The cytotoxic potential of three new rhenium compounds [ReO3(PTA)2][ReO4] (PTA = 1,3,5-triaza-7-phosphaadamantane), [ReO3(HMT)2][ReO4] (HMT = hexamethylenetetramine) and [ReO(Tpms)(HMT)] (Tpms = tris(pyrazol-1-yl)methanesulfonate) designated from here on by 1, 2 and 3, and compound 4 was evaluated in several cancer cell lines and fibroblasts. The structure of compound 4, bearing the trimeric polythiophene acetic acid (tPTAA) ligand, can not be revealed due to a pending patent. The compounds 2 and 4 were also tested in combination with cisplatin and doxorubicin in tumor cell lines. Flash photolysis was used to assess transient species formation that could increase the anticancer potential (Dieckmann et al., 2013).
16
2
Materials and Methods
2.1 Metalic compoundsRhenium compounds tested for antitumoral activity (see Table 2.1) were synthesized by Martins and collaborators (2013). They were prepared from the Re (VII) oxide Re2O7, which is a relatively inexpensive, accessible, and highly reactive material, and characterized by Infrared and Nuclear Magnetic Ressonance spectroscopies, elemental analysis and electrochemical properties as described by Martins and collaborators (2013). The same authors also have shown that the oxorhenium compounds are soluble in water, an ambivalent behavior which is characteristic of certain 1,3,5-triaza-7-phosphaadamantane (PTA) Renhium complexes.
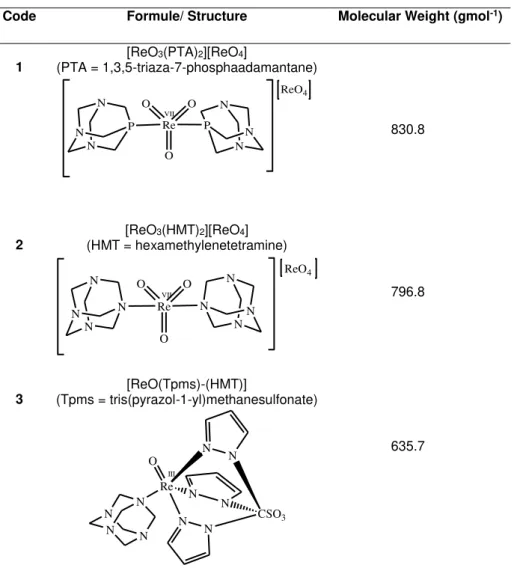
Table 2.1 Oxorhenium complexes bearing the water-soluble tris(pyrazol-1-yl)methaneulonate,
1,2,5-triaza-7-phosphaadamtane or related ligands. These organometallic compounds have been prepared from the Re(VII) oxide Re2O7 (Martins et al., 2013). In this table are represented from left to right: code (the number used in this
thesis to refer a particular rhenium compound), formule, structure and molecular weight.
Code Formule/ Structure Molecular Weight (gmol-1)
1
[ReO3(PTA)2][ReO4]
(PTA = 1,3,5-triaza-7-phosphaadamantane)
O O O Re N N N P N N N P ReO4 VII 830.8 2
[ReO3(HMT)2][ReO4]
(HMT = hexamethylenetetramine)
O O O Re N N N N N N N N ReO4 VII 796.8 3 [ReO(Tpms)-(HMT)]
(Tpms = tris(pyrazol-1-yl)methanesulfonate)
Re N N N N N
N CSO3
N N N N O III 635.7
17
high boiling and freezing points. DMSO is also known by its antimicrobial activity, thereby avoiding the need for sterilization and autoclaving before use. The samples in DMSO can be stored either at room temperature or in a frozen state and thawed when needed (Cheng et al., 2003). In this work the aliquots were stored at -20ºC.
Compound 4 was synthesized in University College of Dublin by Grace Morgan Group and its structure can not be revealed due to a pending patent. Compound 4 (4502.0 µM) was stored at 4ºC.
2.2 Combined therapeutics
18 2.3 Cell lines
2.3.1 Tumour cell lines
In this work eight tumour cell lines of Homo sapiens origin (see Table 2.2) were used (American Type Culture Collection (ATCC) nomenclature).
Table 2.2 Tumoral cell lines that are used in this work. From left to right: the name, morphology, culture properties
and cell line derivation and other informations.
Tumoral Cell Lines
Morphology Culture properties
Derivation
A549(1) epithelial adherent Initiated in 1972 through explant culture of lung carcinomatous tissue from a 58-year-old caucasian male.
H1650(2) epithelial adherent Derived from stage 3B adenocarcinoma, in particular, bronchoalveolar carcinoma. The tissue donor was a 27-year-old
caucasian male.
H1975(3) epithelial adherent Established in July 1988 and is from an adenocarcinoma; non-small cell lung cancer. The tissue donor was a female
non-smoker.
HCT116(4) epithelial adherent This cell line is from colorectal carcinoma. The tissue donor was an adult male.
HepG2(5) epithelial adherent This cell line is from hepatocellular carcinoma. The tissue donor was a 15-year-old caucasian male.
K562(6) lymphoblast suspension The continuous cell line K-562 is from the pleural effusion of a 53-year-old female with chronic myelogenous leukemia (CML) in
terminal blast crisis.
MCF-7/GFP(7) epithelial adherent MCF-7 was isolated (1970) from a malignant adenocarcinoma from the breast of a 69-year-old woman. The cell line MCF-7/GFP
expresses GFP.
MNT-1(8) epithelial adherent This is a melanotic cell line from skin enriched with mature stage III and IV melanosomes.
Legend: More information in (accessed in November 29, 2013):
(1)http://www.lgcstandards-atcc.org/Products/All/CCL-185.aspx#generalinformation;(2)
http://www.lgcstandards-atcc.org/products/all/CRL-5883.aspx?geo_country=pt;(3)
http://www.lgcstandards-atcc.org/Products/All/CRL-5908.aspx#generalinformation;(4)http://www.lgcstandards-atcc.org/Products/All/CCL-247.aspx; (5)https://www.lgcstandards-atcc.org/Products/All/CRL-10741.aspx;(6)
https://www.lgcstandards-atcc.org/Products/All/CCL-243.aspx;(7)
https://www.cellbiolabs.com/sites/default/files/AKR-211-gfp-mcf-7-cell-line.pdf; (8)http://www.lifetechnologies.com/pt/en/home/technical-resources/cell-lines/m/cell-lines-detail-545.html
2.3.2 Normal cell line culture
19
2.4 Cell lines culture and harvesting
Cell lines were cultured in Complete Culture Medium constituted by Dulbecco’s Modified Eagle Medium (DMEM; Invitrogen, New York, United States of America) supplemented with 10% (v/v) fetal bovine serum (FBS, Invitrogen, New York, United States of America), 1% (v/v) streptomycin-penicillin (Pen-Step+Antimycotic; Invitrogen) in culture flasks of 25, 75 and 175 cm2 (BD Biosciences, New Jersey, EUA). The culture flasks were incubated at 37℃ in a humidified atmosphere of 99% and 5% CO2. For the tumoral cell line HepG2 and dermal fibroblasts 1% (v/v) of MEM nonessential amino acids (100x, Invitrogen, New York, United States of America) were added to the Complete Culture Medium.
When cells were near the end of exponential growth (roughly 80% confluent), they were harvested with 6 mL, 4 mL or 1 mL of TrypLE (Gibco, Thermo Fisher Scientific, Waltham, United States of America), a replacement of Trypsin, (for 175 cm2, 75 cm2 or 25 cm2 flasks, respectively). After ten minutes TrypLE is neutralized with the same volume of Complete Culture Medium and cells were centrifugated at 1500 RPM for 5 minutes at 20ºC. Then the medium with TrypLE was aspirated and added new Complete Culture Medium, 1 or 2 mL to dissolve the pellet. The cell lines were subcultured at a 1:10 split ratio.
2.4.1 Cell counting
Cells were counted by the Trypan blue exclusion method in a hemocytometer (Hirschmann, Eberstadt, Germany) from a mixture of 350 μL of complete culture medium, 100 μL of Trypan blue at 0.4 % (v/v) (Sigma, St. Louis, United States of America) and 50 μL of cellular suspension obtained during the subculturing process (see 2.4). A hemocytometer consists of a thick glass microscope slide with a grid of perpendicular lines etched in the middle. The grid has specified dimensions so that the area covered by the lines is known. The area under the coverslip fills by capillary action. The load
volume is about 10 μL. The number of cells per ml is obtained by multiplying the number of total cells
counted, the volume of the hemocitometer (104 mL-1) chamber and the dilution factor (10) divided by the number of squares counted, as represented in equation (1).
(1) Total cells/mL =Total cells counted x 10number of squares4 x 10
2.5 Cell Viability assays
To assess cell drug inhibition, 7500 cells per well were seeded in 96-well plates and incubated during 24 hours at 37ºC in a humidified atmosphere of 99% and 5% (v/v) CO2 in air. Drugs were added 24 hours later at established concentrations (between 0.1 μM and 1000 μM). Control cells used have been growth in the presence of 0.1% (v/v) DMSO at 99.5% (Sigma, St. Louis, United States of America). The 96-well plates were then incubated for 48 hours at 37ºC in a humidified atmosphere of 99% and 5% (v/v) CO2.
Cell viability was measured using the colorimetric method CellTiter 96® AQueous
20
product that is soluble in tissue culture medium. The quantity of formazan product measured by the amount of 490nm absorbance is directly proportional to the number of living cells in culture.
After 48 hours after drug addition, medium was aspirated from 96-well plates and 100 µL of a solution mixture of complete culture medium, MTS and PMS (100:20:1) were pipetted to each well. The 96-well plates were incubated at 37ºC and after 40 minutes the absorbance at 490 nm was read in a microplate reader (Tecan infinite F200, Männedorf, Switzerland). An illustrative scheme is shown in Figure 2.1.
Figure 2.1 Illustrative scheme of cell viability assays. 7500 cells per well (0.75 x 10⁵ cells/mL) were seeded in
96-well plate at 37ºC, humidified atmosphere of 99% and 5% (v/v) CO2, and 24 hours later the cells were exposed to
compounds for more 48 hours in the same conditions. Then, each well was aspirated and 100 µL of a solution mixture of complete culture medium, MTS and PMS (100:20:1) were pipetted to each well. After 40 minutes of incubation the absorbance at 490nm was read in a microplate reader.
Data were treated by the equation (2) and the half maximal inhibitory concentration (IC50) determined by GraphPadPrism 6:
21
2.6 Flash photolysis
Laser Flash Photolysis experiments were carried out at room temperature on LKS.60 Nanosecond Laser Flash Photolysis Spectrometer (Applied Photophysics, Surrey, United Kingdom) in two different solvents (distilled water solutions and deaerated distilled water solutions for at least 5 minutes with oxygen-free nitrogen and methanol (99.9%, Sigma, St. Louis, United States of America)). The concentrations are adjusted to yield an absorbance of 0.2 at the excitation wavelength. Samples were excited by the 4th harmonic (λEXC = 266 nm, laser energy around 10 J) of a neodymium-doped yttrium aluminium garnet (Nd-YAG) laser. Light excitation was carried out using a medium pressure mercury arc lamp. Filters (Oriel, Bozeman, United States of America) were placed in the light path to narrow the spectrum and remove wavelengths inferior to 305 nm. Transient absorption spectra were recorded after the laser pulse (ten shots at each wavelength, with an interval of ten nanometers).
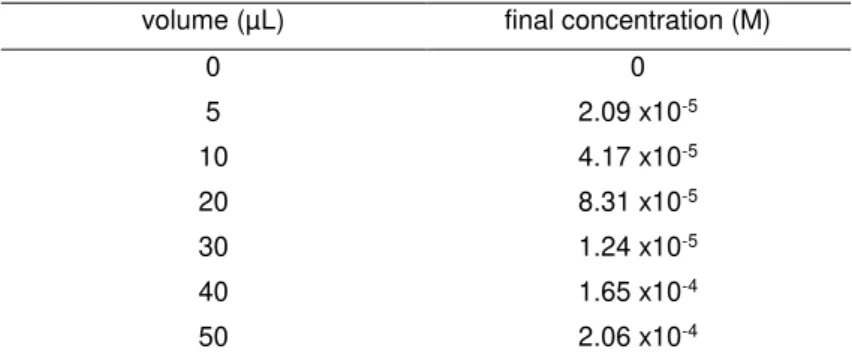
Stock solutions of quenchers in the energy transfer assays were prepared so that it was only necessary to add microliter volumes (see Table 2.3) to the sample cell in order to reach appropriated quencher concentration. Benzophenone (10-4 mol/L) used in energy transfer assays was acquired from Merck, Whitehouse Station, United States of America. Data were acquired and analysed with the Applied Photophysics software.
Table 2.3 Energy transfer assay table with volumes of compound 2 stock added to the quartz cuvette with benzophenone during the titulation.
volume (µL) final concentration (M)
0 0
5 2.09 x10⁻⁵
10 4.17 x10⁻⁵
20 8.31 x10⁻⁵
30 1.24 x10⁻⁵
40 1.65 x10⁻⁴
22
DNA interaction assays
2.7 Study of the interaction between compounds and pUC18 plasmid DNA
2.7.1 Escherichia coli culture and DNA extraction
Plasmid DNA (pDNA) extraction from pUC18 (Thermo Scientific, Waltham, United States of America), was done from Escherichia coli DH5 culture. Transformed cells stored at -80ºC were inoculated (20 µL) in an erlenmeyer (50 mL) with 20 mL of Luria-Bertani medium and 100 µg/mL of ampicillin (100 mg/mL, Bioline, Humber Road, United Kingdom). The culture was grown for sixteen hours with orbital agitation of 250 RPM at 37ºC.
The NZYMiniprep kit (Nzytech, Lisbon, Portugal) was used to extract pUC18 pDNA. The procedure was followed according to manufacturer’s instructions, however some exceptions were performed: centrifugation times of 30 seconds was doubled for 1 minute and the elution step was made with 30 µL of Tris-HCl buffer (50 mM Tris-HCl (Merck, Whitehouse Station, United States of America), 10 mM NaCl (Panreac, Barcelona, Spain), pH 7.0) pre-warmed at 70ºC.
The resulting pDNA was quantified by spectrophotometry at 260 nm (NanoDrop2000, Thermo Scientific, Waltham, United States of America). DNA purity is evaluated with the ratios Abs260/Abs280 and Abs260/Abs230. Values of Abs260/Abs280 bellow 1.8 indicate protein contamination and above 2.0 RNA presence. Values of Abs260/Abs230 bellow 2.0 indicate mainly alcohol contamination, and this ratio must be between 2.0 and 2.2. DNA integrity was assessed by agarose gel electrophoresis at 0.7 % (w/v) in TAE 1x (composition for 1 L of TAE 10x: 48.4 g of Tris-base, 3.72 g of EDTA, 11.42 mL of acetic acid, pH 8.0) with 1 % (v/v) GelRed (10000 x, Biotarget, Lisboa, Portugal).
2.7.2 Plasmid DNA Electrophoretic procedure
Each sample (20 µL) was prepared by mixturing 200 ng of pDNA pUC18, with the compounds (concentration between 0 and 200 µM) and Tris-HCl buffer (50 mM Tris-HCl, 10 mM NaCl, pH 7.0). Compounds were diluted in the same buffer before adding to the samples. A pDNA sample with 1.6 % (v/v) DMSO, instead of compound, was prepared as control. A sample of 200 ng of pDNA pUC18 was linearized with 0.5 µL of EcoRI (10 U/µL, Fermentas, Maryland, United States of America), 2 µL of EcoRI buffer (Fermentas, Maryland, United States of America) and destilled water until 20 µL.
Samples were incubated during 24 hours at 37ºC. Then, they were deposited on an electrophoresis agarose gel 0.7 % (p/v) in TAE 1x buffer and run at 70 V during 90 minutes in a horizontal electrophoresis system. The DNA size marker used was λ DNA/HindIII (Fermentas, Maryland, United States of America). The agarose gel was stained in a solution of 100 mL of distilled water with ethidium bromide (Invitrogen) 0.04 % (v/v) during 15 minutes with agitation and visualized and images acquired with BioRad equipment and Quantity One software (BioRad, California, United States of America). Gel images were analysed by GelAnalyzer 2010 (http://www.gelanalyzer.com/).
2.8 Spectrophotometric assays
23
United States of America) stock in Tris-HCl buffer (50 mM Tris-HCl (Merck, Whitehouse Station, United States of America), 10 mM NaCl (Panreac, Barcelona, Spain), pH 7.0). Ct-DNA was quantified by spectrophotometry at 260 nm (NanoDrop2000, Thermo Scientific, Waltham, United States of America).
24
Protein interaction assays
2.9 Human Serum Albumin interaction assays
Human Serum Albumin (HSA, Sigma, St. Louis, United States of America) stock solution was prepared diluting 100 mg of HSA in 10 mL of phosphate buffer (39 mL of 0.2 M monobasic sodium solution (Merck, Whitehouse Station, United States of America), 61 mL of 0.2 M dibasic sodium solution (Sigma, St. Louis, United States of America) and 100 mL of distilled water) with 0.15 M NaCl (VWR, Radnor, Pennsylvania), pH 7, incubating 1 hour at room temperature for full rehydration. Samples were prepared with 35 µM of HSA and varying the concentration of compound 2 (0 µM to 720 µM). Then phosphate buffer was added to make up 100 µL. Samples were incubated during 24 hours at 37ºC. The U.V./Visible spectrum was acquired between 230 nm and 500 nm (UVmini-1240 UV-Vis Shimadzu spectrophotometer, Kyoto, Japan) for 80 µL of each sample and an emission spectrum between 300 nm and 500 nm after excitation at 295 nm (Varian Cary Eclipse Fluorescence Spectrophotometer, Agilent Technologies, Santa Clara, United States of America).
2.10 Proteomic assay
2.10.1 Cell culture and lysis
Two-dimensional electrophoresis was used in this work for the analysis of protein mixture extracted from HCT116 cells after compound treatment. The technique allows to separate proteins according to two independent chemical properties in two steps: first Isoelectric focusing (IEF, see 2.10.5), which separates proteins according to their isoelectric points, and the second step Sodium Dodecyl Sulfate-Polyacrylamide Gel Electrophoresis (SDS-PAGE, see 2.10.6), which separates them according to their Molecular Weights (MW).
In a 175 cm2 culture flask, HCT116 cells (2 x 10⁵ cells/mL) in Complete Culture Medium were incubated during 24 hours at 37ºC in a humidified atmosphere of 99% and 5% (v/v) CO2 in air for cell adherence. After 24h compounds were added after aspirating the medium and cells were incubated for 48 hours at 37ºC in a humidified atmosphere of 99% and 5% (v/v) CO2. As a control cells were incubated in the presence of 0.1% (v/v) DMSO (99.5%, Sigma, St. Louis, United States of America).