Recu p er ação d o Desem p en h o d e Po ed eir as A p ó s
Alimentação com Dietas Deficientes em Aminoácidos
ABSTRACT
Three hundred and tw enty Hy-Line W36 commercial laying hens, 39 w eeks of age, w ere used to determine the sequence and the length of time needed for hens to recover performance characteristics after an eight-w eek period under graded levels of threonine deficiency. Eight experimental diets w ith Thr levels ranging from 0.35 to 0.53% w ere randomly fed w ith eight replicates of five hens each. After the previous experiment, the hens w ere fed a control diet (0.53% Thr) for a four-w eek period. Feed consumption (FC), energy intake (EI), egg production (EP), egg w eight (EW), egg mass (EM ), and body w eight (BW) w ere evaluated. All performance characteristics w ere impaired on Thr deficient diets. The recovery sequence order w as FC and EI; EP, EW and EM , and f inally BW, w it h t he lengt h of t ime of t w o, t hree, and f our w eeks, respectively. The data indicated that an amino acid deficiency does not cause permanent damage to the reproductive system of the hens.
RESUM O
Trezent as e vint e poedeiras com erciais Hy-Line W 36 com 39 semanas de idade f oram ut ilizadas com o objet ivo de det erminar a seqüência e o t em po necessário para as galinhas recuperarem as características de desempenho após um período de oito semanas de alimentação, com dietas contendo diferentes níveis de treonina. Oito dietas experimentais, com níveis de treonina variando de 0,35 a 0,53% , foram distribuídas ao acaso, com oito repetições de cinco aves cada. Após esse prévio experimento, as aves foram alimentadas com a dieta controle (0,53% Thr) por quatro semanas em que as características: consumo de ração (CR), de energia (CE), produção de ovos (PO), peso de ovos (PE), massa de ovos (M O) e peso corporal (PC) foram avaliadas. Todas as características foram prejudicadas com dietas deficientes em Thr, e a seqüência da recuperação ocorreu na seguinte ordem: CR e CE; PO, PE e M O e, por último, PC, nos prazos de duas, três e quatro sem anas, respect ivam ent e. Os dados obt idos indicaram que um a deficiência em aminoácidos não causa um dano permanente ao sistema reprodutivo das galinhas.
0114 Código / CodeCodeCodeCodeCode
Douglas Emygdio de Faria
Depto. de Zootecnia - FZEA / USP Av. Duque de Caxias Norte, 225 Campus da USP - Caixa Postal 23 13635-900 - Pirassununga - SP - Brasil
E-mail: def [email protected]
Correspondência / M ail Address
Unit erm os / Keyw ords
am in o ácid o d ef iciên cia, d esem p en h o , produção de ovos, treonina
amino acid deficiency, egg production, laying hens, threonine
Faria DE1
Harms RH2
Russell GB2
1 - Dep t o . d e Zo o t ecn ia d a FZEA / USP, Pirassununga e Professor Visitante - University of Florida, Gainesville, USA
2- Department of Animal Sciences, University of Florida, Gainesville, USA
Aut or(es) / Aut hor(s)
Observações / Not es
INTRODUCTION
Nutritionists usually formulate diets for commercial laying hens to achieve maximum performance and maximum economic return. Feeding programs should m eet t he nut rient requirem ent s according t o t he product ion phase or age of hens. M ost of t hese feeding programs are based on the daily feed intake concept, w hich w as first suggested by Harms et al. (1978) and later modified by Harms (1981).
Dietary manipulation can have different objectives such as increasing early egg w eight (Bohnsack & Harms, 2000), reducing egg w eight and improving eggshell qualit y in old and young hens (Roland, 1 9 8 0 a, b ), im p r o vin g eg g size classif icat io n (Zimmerman, 1997; Harms, 2000), and for diets used just before hens are marketed or molted (Kuchinski & Harms, 1993). How ever, if the margin of safety is too small and variation of feed ingredients results in co n sid er ab ly less am in o acid s in t h e f eed , performance of the hen w ill be reduced (Harms & Russell, 1998).
Harms & Ivey (1993) evaluated the performance of layers fed various supplemental amino acids in a co r n - so yb ean m eal d iet an d co n clu d ed t h at met hionine and lysine w ere t he f irst t w o limit ing amino acids, w ith tryptophan, arginine or threonine being third. On the other hand, NRC (1994) suggested a d aily in t ak e o f 4 7 0 m g /d ay o f t h reo n in e f o r maximum performance of laying hens.
Theref ore, t his experim ent w as conduct ed t o det erm ine t he sequence and t he lengt h of t im e needed f or hens t o recover various perf orm ance characteristics after receiving diets deficient in amino acids w ith threonine being the most limiting.
M ATERIALS AND M ETHODS
Th r ee h u n d r ed an d t w en t y Hy- Li n e W 3 6 commercial laying hens, 39 w eeks of age, w ere used in this experiment. They w ere randomly housed one bird per w ire cage (25.6 x 42.6 cm) in a w indow less, f an - ven t i l at ed h o u se. Th e t em p er at u r e w as controlled to get a uniform feed intake. It w as not allo w ed t o f all b elo w 2 6 .7 ºC an d w as alm o st const ant because t he experim ent w as conduct ed in February and M arch. They w ere given art if icial light (16h light :8h dark). Feed and w at er w ere provided ad libitum.
Previously, the hens w ere fed eight experimental diets w ith various deficient amino acids levels (Table 1) from
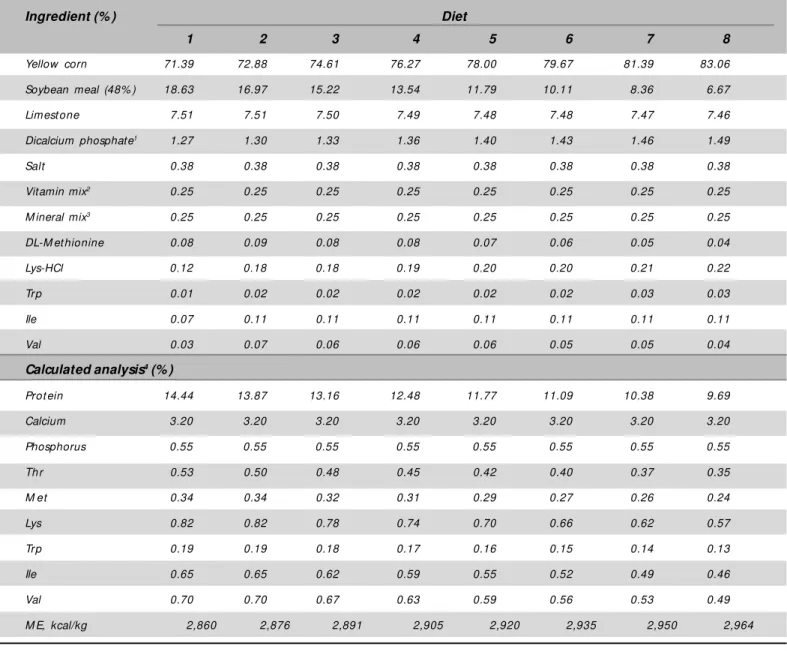
31 t o 38 w eeks of age. In t his previous st udy (Faria et al.,2002), Diet 1 w as a positive control diet containing 0.53% Thr and other amino acids previously found to support maximum performance (Harms & Russell, 1996). Diet 2 contained 0.50% Thr (95% of Diet 1) and other supplemental amino acids (AA), at levels equal to Diet 1 and expected to support maximum perf orm ance. Diet 3 cont ained 0.48% Thr (90% of Diet 1), and other AA w ere included at 95% of the levels in Diet 2. Diet 4 contained 0.45% Thr (85% of Diet 1), and other AA w ere included at 90% of the levels in Diet 2. Diet 5 contained 0.42% Thr (80% of Diet 1), and other AA w ere included at 85% of the levels in Diet 2. Diet 6 contained 0.40% Thr (75% of Diet 1), and other AA w ere included at 80% of the levels in Diet 2. Diet 7 contained 0.37% Thr (70% of Diet 1), and other AA w ere included at 75% of the levels in Diet 2. Diet 8 contained 0.35% Thr (65% of Diet 1), and other AA w ere included at 70% of the levels in Diet 2. At t he t erm inat ion of t he previous experiment the hens receiving Diets 2 to 8 w ere placed on Diet 1 for four w eeks (Table 1). The eight replicates of five hens, w hich w ere fed these diets for eight w eeks, w ere used to evaluate the performance recovery from each diet.
Perf o rm an ce o f t h e last w eek o f t h e p revio u s experiment is indicated as w eek –1. Feed consumption (FC), energy intake (EI), egg production (EP), egg w eight (EW), egg mass (EM ), and the final body w eight w ere u sed t o in d icat e t h e sever it y o f t h e am in o acid deficiency. Egg mass w as obtained for multiplying EP b y EW. Hen s w ere i n d i vi d u al l y w ei g h ed at t h e termination of the previous experiment and bi-w eekly during the next four w eeks. Body w eight (BW) change w as calculated biw eekly from initial BW during the four-w eek period. Weekly FC, EI, EP, EW, and EM four-w ere obtained and replicate values w ere used for statistical analyses. The data w ere subject to a one-w ay ANOVA using the general linear model procedure of SAS (SAS Inst it ut e, 1996). Duncan’s mult iple-range t est (1955) w as used to determine significant differences among t reat ment means.
RESULTS
FEED CONSUM PTION AND ENERGY INTAKE
w eek. How ever, FC and EI w ere equal to control after hens had received the control diet for tw o w eeks.
There w ere no differences in FC and EI among treatments during w eeks 3 and 4. This indicated that the severity of the amino acid deficiencies did not af f ect t he recovery f or t hese measurement s. This disagrees w ith a previous report (Harms & Russell, 1998) that hens fed a diet w ith a very low level of Trp signif icant ly increased FC during t he f irst t w o w eeks after they w ere fed the control diet. Possibly, it indicat es t hat t he hen responds dif f erent ly t o deficiencies of various amino acids.
EGG PRODUCTION
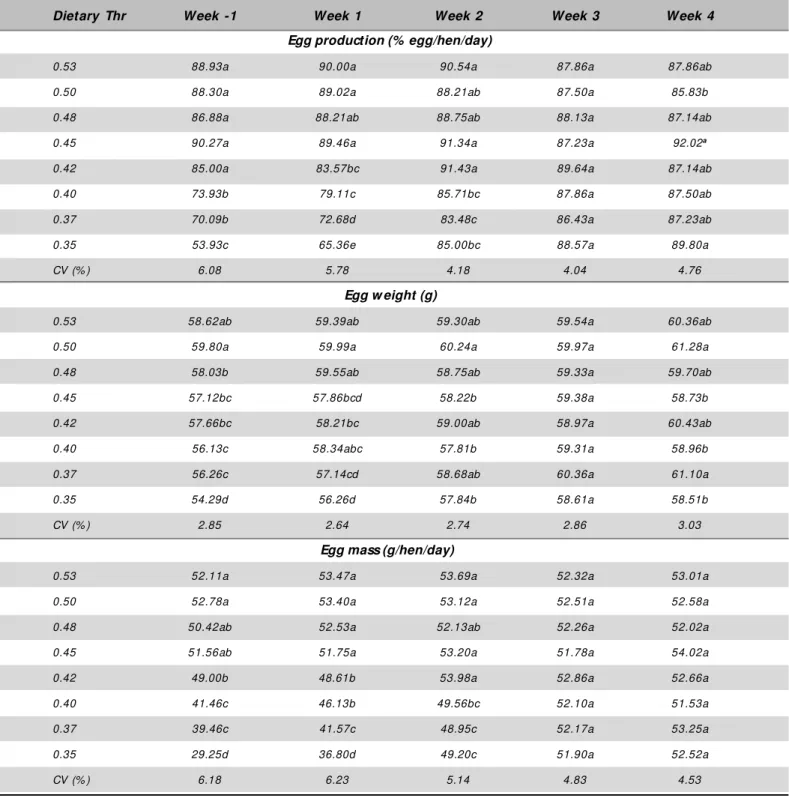
Egg production w as significantly reduced for hens fed the three diets containing the low est levels of amino acids in w eek -1 (Table 3). Egg product ion gradually increased during the first tw o w eeks after returning the hens to the control diet. During w eeks 3 and 4 there w ere no significant differences in EP am ong t he t reat m ent s. The recovery in EP w hen the hens w ere previously fed a diet extremely low in amino acids is the same response as previously found for Trp (Harms & Russell, 1998). The lack of an i n cr ease d u r i n g t h e f i r st t w o w eek s w as expect ed because t he num ber of ova t hat had started to mature w hen the hens w ere returned to t he cont rol diet det erm ined t he num ber of eggs during this period.
EGG WEIGHT
Egg w eight w as significantly reduced for hens fed the three diets containing the low est levels of amino acids in w eek -1 (Table 3). There w as an increase in EW after the hens received the control diet for one w eek. Egg w eight continued to increase during the second w eek. During the third w eek there w as no differences in EW among treatments. The recovery in EW from hens previously fed a diet extremely low in amino acids agrees w ith a previous report (Harms & Russell, 1998) that hens fed a diet extremely low in Trp restored EW in three w eeks.
EGG M ASS
Egg mass w as significantly reduced for hens fed the three diets containing the low est levels of amino acids in w eek -1 (Table 3). Egg m ass f rom hens previously f ed diet s def icient in am ino acids w as
increased at the end of one week. The EM continued to increase during w eek 2. There w ere no signif icant differences in EM among all treatments during weeks 3 and 4.
BODY WEIGHT AND BODY WEIGHT CHANGE
Body w eight w as significantly reduced w hen the hens p revio u sly received d iet s d ef icien t in am in o acid s (Table 4). Hens previously fed amino acids deficient diets gained significantly more w eight during the first tw o w eek s af t er receivin g t h e co n t ro l d iet . Th ey also continued to gain more w eight during the second tw o w eeks. Hens previously f ed t he diet cont aining t he low est level of amino acids w eighed significantly less at the end of fourth w eek than control hens.
DISCUSSION
Hens previously fed the three diets containing the low est levels of amino acids during eight w eeks (Faria et al., 2002) show ed a reduction in feed consumption and energy intake about 21 and 16% , respectively, in comparison to control diet. Also, egg production, egg w eight, egg mass, and body w eight w ere reduced about 27, 7, 30, and 13% , respectively. The findings about reductions in EP and EW are in agreement w ith findings of M orris & Gous (1988). They stated that the egg size does not decrease below 90% of its maximum value until amino acid intake is w ell below 50% of the optimum value, w hereas; rate of lay is only 70% of its potential value w hen amino acid intake is half the optimum.
The results of this experiment indicated that hens fed a diet deficient in amino acids will return to normal performance in three weeks when fed a nutritionally adequate diet . Figure 1 shows the length of time needed for hens to recover FC, EP, EW, and BW, and the recovery percentage each week after hens have received the control diet.
Egg production and EW gradually increased, and by the end of w eek 3 w as equal to the EP and EW of control hens. The small increase in EP during the first tw o w eeks w as a result of the grow th of ova, w hich had started during the previous experiment w hen hens w ere fed deficient diets. A more rapid increase in EW w as observed as FC increased, w hich furnished more amino acids for formation of yolks. The increase in EM during the first tw o w eeks w as due to the increase of EP and EW.
t reat m ent s af t er f our w eeks, except in BW. This indicates no permanent damage w as done to the reproduct ive syst em f rom f eeding an am ino acid deficient diet for eight w eeks. This is important w hen reducing t he m argin of saf et y f or am ino acids. A new program has recently been developed to m ore precisely calculat e t he needed am ino acids (Harms & Faria, 2001). This program also allow s for the early detection of an amino acid deficiency, w hich can be rapidly corrected.
CONCLUSIONS
Feeding of diet s def icient in amino acids reduces egg production, egg w eight, egg mass, and body w eight ab o u t 2 7 , 7 , 3 0 , an d 1 3 % , r esp ect ively. Hens returned to a complete diet rapidly return to normal production parameters. Feed consumption w as recovered w it hin t w o w eeks; egg product ion, egg w eight , and egg m ass w ere recovered w it hin t hree w eeks. Body w eight w as recovered w ithin four w eeks, except for hens fed the diet w ith extremely low level of am ino acids. Theref ore, t here is no perm anent damage to the reproductive system w hen hens w ere fed amino acid deficient diets for eight w eeks.
Table 1 - Composition of experimental diets.
1 - Contains 18.5% P and 21% Ca. 2,3 - See Harms & Russell (2000).
4 - Based on analysis of corn and soybean meal
Ingredient (% ) Diet
1 2 3 4 5 6 7 8
Yellow corn 71.39 72.88 74.61 76.27 78.00 79.67 81.39 83.06 Soybean meal (48% ) 18.63 16.97 15.22 13.54 11.79 10.11 8.36 6.67 Lim est one 7.51 7.51 7.50 7.49 7.48 7.48 7.47 7.46 Dicalcium phosphate1 1.27 1.30 1.33 1.36 1.40 1.43 1.46 1.49
Salt 0.38 0.38 0.38 0.38 0.38 0.38 0.38 0.38 Vitamin mix2 0.25 0.25 0.25 0.25 0.25 0.25 0.25 0.25
M ineral mix3 0.25 0.25 0.25 0.25 0.25 0.25 0.25 0.25
DL-M et hionine 0.08 0.09 0.08 0.08 0.07 0.06 0.05 0.04 Lys-HCl 0.12 0.18 0.18 0.19 0.20 0.20 0.21 0.22 Trp 0.01 0.02 0.02 0.02 0.02 0.02 0.03 0.03 Ile 0.07 0.11 0.11 0.11 0.11 0.11 0.11 0.11 Val 0.03 0.07 0.06 0.06 0.06 0.05 0.05 0.04
Calculated analysis4 (% )
Table 2 - Feed consumption and energy intake of commercial laying hens.
a-d: M eans w ith the same superscript w ithin a column do not differ significantly (p<0.05).
Dietary Thr Week -1 Week 1 Week 2 Week 3 Week 4
Feed consumption (g/hen/day)
0.53 97.77a 100.12a 93.31a 97.68a 93.63a 0.50 100.12a 100.60a 92.99a 101.09a 94.18a 0.48 95.33a 97.68ab 91.85a 94.93a 93.31a
0.45 96.21a 99.39a 93.80a 96.35a 93.07a
0.42 94.44a 99.30a 94.12a 97.68a 96.09a
0.40 85.62b 91.69c 93.31a 97.68a 95.42a
0.37 83.02b 92.70bc 89.91a 95.13a 93.96a
0.35 69.74c 86.18d 92.66a 97.20a 94.61a
CV (% ) 5.80 5.54 5.53 6.55 4.76
Energy intake (kcal M E/hen/day)
0.53 280a 286a 267a 279a 268a
0.50 288a 289a 267a 291a 271a
0.48 276a 282ab 266a 274a 270a
0.45 280a 289a 273a 280a 270a
0.42 276a 290a 275a 285a 281a
0.40 251b 269bc 274a 287a 280a
0.37 245b 273ab 265a 281a 277a
0.35 207c 255c 275a 288a 280a
a-d: M eans w ith the same superscript w ithin a column do not differ significantly (p<0.05).
Table 3 - Egg Production, egg w eight, and egg mass from commercial laying hens.
Dietary Thr Week -1 Week 1 Week 2 Week 3 Week 4
Egg production (% egg/hen/day)
0.53 88.93a 90.00a 90.54a 87.86a 87.86ab 0.50 88.30a 89.02a 88.21ab 87.50a 85.83b 0.48 86.88a 88.21ab 88.75ab 88.13a 87.14ab 0.45 90.27a 89.46a 91.34a 87.23a 92.02a
0.42 85.00a 83.57bc 91.43a 89.64a 87.14ab 0.40 73.93b 79.11c 85.71bc 87.86a 87.50ab 0.37 70.09b 72.68d 83.48c 86.43a 87.23ab 0.35 53.93c 65.36e 85.00bc 88.57a 89.80a
CV (% ) 6.08 5.78 4.18 4.04 4.76
Egg w eight (g)
0.53 58.62ab 59.39ab 59.30ab 59.54a 60.36ab
0.50 59.80a 59.99a 60.24a 59.97a 61.28a
0.48 58.03b 59.55ab 58.75ab 59.33a 59.70ab 0.45 57.12bc 57.86bcd 58.22b 59.38a 58.73b 0.42 57.66bc 58.21bc 59.00ab 58.97a 60.43ab 0.40 56.13c 58.34abc 57.81b 59.31a 58.96b 0.37 56.26c 57.14cd 58.68ab 60.36a 61.10a
0.35 54.29d 56.26d 57.84b 58.61a 58.51b
CV (% ) 2.85 2.64 2.74 2.86 3.03
Egg mass (g/hen/day)
0.53 52.11a 53.47a 53.69a 52.32a 53.01a
0.50 52.78a 53.40a 53.12a 52.51a 52.58a
0.48 50.42ab 52.53a 52.13ab 52.26a 52.02a 0.45 51.56ab 51.75a 53.20a 51.78a 54.02a
0.42 49.00b 48.61b 53.98a 52.86a 52.66a
0.40 41.46c 46.13b 49.56bc 52.10a 51.53a
0.37 39.46c 41.57c 48.95c 52.17a 53.25a
0.35 29.25d 36.80d 49.20c 51.90a 52.52a
Table 4 - Body w eight and body w eight change of commercial laying hens.
a-e: M eans w ith the same superscript w ithin a column do not differ significantly (p<0.05).
Dietary Thr Initial body w eight Week 2 Week 4
Body w eight (g)
0.53 1,521ab 1,550ab 1,556b
0.50 1,589a 1,613a 1,650a
0.48 1,485bc 1,530ab 1,507b
0.45 1,492bc 1,539ab 1,537b
0.42 1,498bc 1,554ab 1,564b
0.40 1,419cd 1,486b 1,492b
0.37 1,385d 1,468b 1,493b
0.35 1,258e 1,384c 1,391c
CV (% ) 5.44 5.46 5.44
Body w eight change (g)
0.53 1,521ab 29.0ed 7.6bc
0.50 1,589a 25.0e 25.3abc
0.48 1,485bc 45.0cde 3.6c
0.45 1,492bc 47.0cde 13.5bc
0.42 1,498bc 56.0bcd 14.8bc
0.40 1,419cd 67.0bc 33.5ab
0.37 1,385d 82.0b 25.8abc
0.35 1,258e 126.0a 43.3a
CV (% ) 5.44 42.94 120.61
REFERENCES
Bohnsack C, Harms RH. You can increase early egg w eight. In: Proceedings of 2000 Florida Poultry Institute; Gainesville, Florida, USA. 2000; p.17-18.
Duncan DB. M ultiple range and multiple F tests. Biometrics 1955; 11:1-42.
Faria DE, Harms RH, Rusell GB. Threorine requirement of comercial laying hens fed a corn-soybean meal diet. Poultry Science 2002; 81:809-814.
Harms RH. Specifications for feeding commercial layers based on daily feed intake. Feedstuffs 1981; 53(47):40-41.
Harms RH. You may be able to reduce egg w eights by low ering methionine content of the diet. In: Proceedings of 2000 Florida Poultry Institute; Gainesville, Florida, USA. 2000; p.19-21.
Harms RH, Faria DE. Energy and amino acids in layers: Time to reevaluate? Feed M anagement 2001; 52 (10): 28,30.
Harms RH, Douglas CR, Christmas RB, Damron BL, M iles RD. Feeding commercial layers for maximum performance. Feedstuffs 1978; 50(8):23-24.
Harms RH, Ivey FJ. Performance of commercial laying hens fed various supplemental amino acids in a corn-soybean meal diet. Journal of Applied Poultry Research 1993; 2:273-282.
Harm s RH, Russell GB. A re-evaluat ion of t he m et hionine requirement of the commercial layer. Journal of Applied Animal Research 1996; 9:141-151.
Harms RH, Russell GB. Evaluation of the isoleucine requirement of the commercial layer in a corn-soybean meal diet. Poultry Science 2000; 79:1154-1157.
Harms RH, Russell GB. Layer performance w hen returned to a practical diet after receiving an amino acid-deficient diet. Journal of Applied Poultry Research 1998; 7:175-179.
Kuchinski KK, Harms RH. Feeding reduced nutrient diets for short periods to commercial layers. Journal of Applied Poultry Research 1993; 2:307-313.
National Research Council. Nutrient requirements of poultry. 9t h ed. Washington (DC): National Academy Press; 1994; p.155.
M orris TR, Gous RM . Part it ioning of t he response t o prot ein betw een egg number and egg w eight. British Poultry Science 1988; 29:93-99.
Roland DA, SR. Egg shell quality. I. Effect of dietary manipulations of protein, amino acids, energy, and calcium in aged hens on egg w eight, shell w eight, shell quality, and egg production. Poultry Science 1980a; 59:2038-2046.
Roland DA, SR. Egg shell quality. II. Effect of dietary manipulations of protein, amino acids, energy, and calcium in young hens on egg w eight, shell w eight, shell quality, and egg production. Poultry Science 1980b; 59:2047-2054.
SAS Institute. SAS User’s Guide. Statistics. SAS Institute Inc., Cary, NC. 1996.