ABSTRACT
The Passaúna catchment is part of the Upper Iguaçu watershed and includes a water supply reservoir for over 500,000 inhabitants of Curitiba metropolitan region. The aim of this study was to establish the state of reservoir water quality, and whether it has undergone any recent medium- and long-term variations. A physical-chemical-biological assessment was undertaken using nine indicators and three indexes: Water Quality Index (WQI), Trophic State Index (TSI) and Shannon-Weaver Index (H’) for macroinvertebrate diversity. Compliance with the prescribed quality standards for the water body was verified using frequency curves. Two WQI calculation approaches were contrasted to test for conditions of partial data unavailability. Temporal trends in key parameters were assessed using Spearman’s rank correlation coefficient. WQI results from 1991-2014 indicated that the water quality may be classified as good and improved in the final decade of such period, while most TSI results were in the oligotrophic/mesotrophic range, but with no significant temporal trend. The biodiversity result of H’=1.6 obtained with data acquired in 2014 indicated a moderately degraded ecosystem that is typically associated with flow regulation and a degree of water quality impairment. Such a multi-indicator integrated physical-chemical-biological monitoring approach comprised a robust framework for assessments of medium-long term aquatic health.
Keywords: water supply reservoir; water quality indicator; compliance assessment; Shannon-weaver index; trophic state index; water quality index.
1Universidade Positivo – Curitiba (PR), Brazil. *Corresponding author: wbrauen@gmail.com
Received: 06/04/2018 – Accepted: 09/05/2018 – Reg. ABES: 20180002
Index-based and compliance assessment of
water quality for a Brazilian subtropical reservoir
Avaliação da qualidade da água baseada em índices e da
conformidade ao enquadramento de um reservatório subtropical brasileiro
William Bonino Rauen
1* , Ana Camila Ferraresi
1, Leila Maranho
1,
Edinalva Oliveira
1, Rudhy Costa
1, Jessica Alcantara
1, Mauricio Dziedzic
1RESUMO
A bacia do rio Passaúna situa-se na parte superior da Bacia do Rio Iguaçu e inclui um reservatório de águas de abastecimento público para mais de 500 mil habitantes da região metropolitana de Curitiba. O objetivo deste estudo foi avaliar a qualidade das águas desse reservatório e identificar eventuais ocorrências de tendência temporal de variação. O estudo de características físicas, químicas e biológicas do corpo de água envolveu dados históricos e recém-adquiridos de nove indicadores e três índices: Índice de Qualidade das Águas (WQI), Índice de Estado Trófico (TSI) e Índice de Diversidade de Shannon-Weaver (H’) para diversidade de macroinvertebrados. A conformidade aos padrões de qualidade prescritos foi analisada com base em curvas de permanência de qualidade de água. Duas formas de cálculo do WQI foram contrastadas para averiguar o efeito de disponibilidade incompleta de dados. Tendências temporais em parâmetros-chave foram buscadas com o teste de correlação de Spearman. Os resultados do WQI, entre 1991 e 2014, indicaram que a qualidade da água do reservatório pode ser classificada como “boa”, apresentando tendência estatisticamente significativa de melhoria na última década de tal período. Os resultados obtidos para o TSI ficaram na faixa oligotrófico/mesotrófico e sem tendência significativa de variação temporal. O resultado de biodiversidade do H’=1,6, obtido com dados adquiridos em 2014, indicou um ecossistema aquático moderadamente degradado, tipicamente associado com o represamento de cursos de água e com um certo grau de comprometimento da qualidade da água. A abordagem integradora multi-indicadores de aspectos físicos, químicos e biológicos adotada neste estudo conferiu robustez à avaliação realizada da qualidade de água do corpo de água no médio-longo prazo.
INTRODUCTION
Water quality assessments of rivers and reservoirs may support
man-agement decision-making and is key for achieving the sustainable bal-ance of multiple water resource uses (VON SPERLING, 1999). Habitat
degradation can be monitored based on physical, chemical, and
bio-logical indicators and can be contrasted with established standards (e.g., BRASIL, 2005). Context-specific assessments usually involve
indexes formed by the aggregation of a number of such indicators. For example, the Water Quality Index (WQI) was developed by the
United States National Sanitation Foundation (NSF) for assessing the quality of source waters prior to treatment for public supply, being
adapted to suit a variety of application contexts (e.g., ABTAHI et al., 2015; FINOTTI et al., 2015; SUN et al., 2016), including a version for
reservoirs (IAP, 2004; 2009; 2017). Several Trophic State Index (TSI) versions have been developed to assess the eutrophication risk or state
of a water body (CARLSON, 1977; LAMPARELLI, 2004). The trophic response of temperate reservoirs may differ significantly from that of
their tropical or subtropical counterparts (CUNHA et al., 2013).
Biomonitoring complements the assessments of environmental
quality based on physical and chemical data. Thus, macroinvertebrates have been used in river and reservoir water quality assessments due to
their responsiveness to different stressors, to having a cosmopolitan distribution, to being relatively immobile, and to their relatively long
lifecycles (MANDAVILLE, 2002). Macroinvertebrate-related indexes tuned into local conditions can reflect the overall degradation state of a
water body, particularly when representing aquatic ecological diversity, as indicated by the Shannon-Weaver Index (H’) (CETESB, 2012; GHOSH;
BISWAS, 2015). Low macroinvertebrate diversity has been associated with water quality deterioration (WILHM; DORRIS, 1968; GHOSH;
BISWAS, 2015), physical alterations, changes in sediment composition, vegetation cover and water levels at the photic zone (MANDAVILLE,
2002; BAPTISTA, 2008). A large proportion of these organisms tends
to live in association with the substrate and any macrophytes present, usually, in the littoral zone of reservoirs (TUNDISI; TUNDISI, 2008;
THORP; ROGERS, 2015).
Water supply for the city of Curitiba largely relies on four
reser-voirs, one of which was implemented in the mid-to-low reaches of the Passaúna river (impoundment location: UTM 7175247, 661689).
For management purposes and in line with the Brazilian National Water Resources Policy, the Passaúna reservoir water should be
con-trolled in terms of the levels of key physical, chemical and biological parameters, which should not exceed certain limits prescribed by Brasil
(2005) for source waters directed for public consumption after conven-tional treatment, under the responsibility of the State Water Company
(SANEPAR). This means that land use and occupation around the reservoir and its affluent streams should be managed to reduce
con-taminant input and to promote conservation. However, maintaining
water quality in reservoirs situated near urban areas, such as Passaúna, is usually a challenge. In locations where this is not achieved, serious
implications follow to ecosystem services and health.
Previous water quality assessments for the Passaúna reservoir based
on WQI and TSI versions (e.g., IAP, 2004; 2009; 2017) indicated that it is a moderately degraded and oligomesotrophic water body, with a tendency
to undergo eutrophication. IAP (2009) reported a trend of water quality
improvement for the period from 1999 to 2008, with unconfirmed statistical significance. In contrast, according to Carneiro et al. (2016), a set of
unpublished SANEPAR data indicated water quality reduction in the decade leading up to 2015. Otherwise, only short-term compliance assessments
of water quality parameters seem to have been conducted for the reservoir (e.g., SILVA FILHO, 2010; SILVA et al., 2011), which prevents a robust
determination of medium-long term conditions from being achieved. In addition, a considerable amount of publicly available data in HidroWeb —
Brazil’s main repository of water resources data, maintained by the National Water Agency on physical, chemical and biological parameters, had yet
to be used as part of a comprehensive medium-long term assessment of Passaúna water quality. Such previous assessments also did not include
any macroinvertebrate data or related biodiversity indexes.
Hence, the general aim of this study was to establish the state and
temporal trend of chronic anthropogenic impacts on water quality in the Passaúna reservoir, using indicators and indexes in an integrated
physical-chemical-biological approach. The specific objectives were: to characterize water quality in the Passaúna reservoir based on historical
data using WQI and TSI, as well as novel macroinvertebrate data for H’; and to assess the level of compliance of water quality parameters with
the Brazilian regulatory standards, also from a historical perspective for the reservoir.
MATERIAL AND METHODS
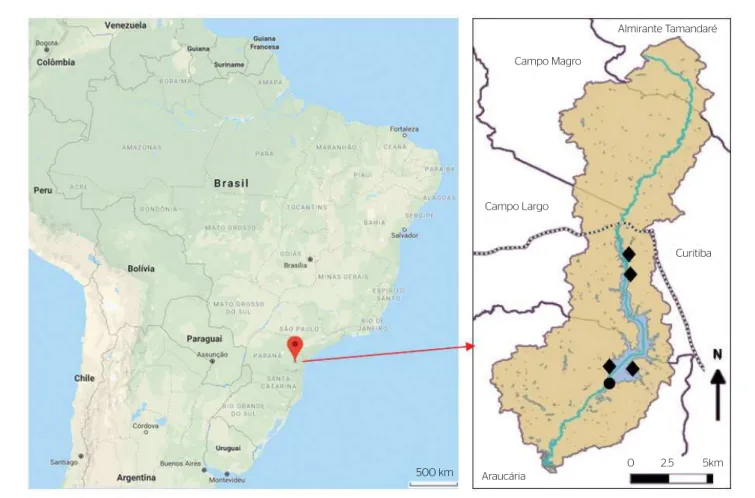
The Passaúna Basin is a sub-basin of the Upper Iguaçu watershed, located in the Southern Brazilian, state of Parana, as shown in Figure 1. The
reservoir is used primarily for public water supply to around half a million inhabitants of Curitiba metropolitan region, for a regularized uptake
of 2.0 m3.s-1. The reservoir lies on the border of the municipalities of
Curitiba, Campo Largo and Araucaria, with a minimum normal volume
of 71.6 hm3, surface area of 9 km2, mean depth of 8 m, maximum depth
of 17 m, mean river inflow of 2.36 m3.s-1, and drainage area of 143.6 km2.
The reservoir watershed area comprises a mixture of urban and rural land use and activities, which include paper and fertilizer
indus-tries, building companies, slaughter houses, mining, cemeteries and a closed controlled dump site, in addition to agriculture (mostly
corn, beans and potato) (ANDREOLI et al., 2003; CARNEIRO et al.,
2016). An Environmental Protection Area (EPA) established in 1991
reservoir drainage area and has controlled and limited land use on the watershed. There is no recorded domestic effluent disposal onto
the Passaúna river-reservoir system. However, there are underdevel-oped areas in the watershed where unregulated sewage contamination
reportedly occurs due to septic tank effluents and irregular disposal
onto the drainage network. There have been investments to improve sewage collection, pumping and treatment generally in the Upper
Iguaçu watershed, as shown by Castro et al. (2017) for the decade of
2000–2010, so that water quality improvement is possible in some
more protected water bodies.
Water quality data of the reservoir used in this study covered the
period from 1991 to 2014, i.e. shortly after reservoir filling following dam construction. Official monitoring data provided in HidroWeb at
the station closest to the dam covered the period from 1991 to 2012. The dataset also included measurement results obtained by the research
group for the period from 2012 to 2014. The following nine indicators were selected, considering available data and information for
calculat-ing WQI and TSI: biochemical oxygen demand (BOD) (mg.L-1);
ther-motolerant coliform or E. coli (TC) (MPN.100 mL-1); total
phospho-rous or total phosphate (TP) (mg.L-1); total (Kjeldahl) nitrogen (TN)
(mg.L-1); dissolved oxygen (DO) (mg.L-1), pH; total solids (TS) (mg.L-1);
temperature (T) (ºC) and turbidity (Tu) (NTU).
Water quality results used herein were gathered for the lentic part of the reservoir and just downstream of the impoundment. For own group
data, at each station, T and DO were measured in situ using a portable
multiparameter probe (YSI Professional Plus, USA). Water samples were collected and analyzed in the laboratory to determine BOD, TC, TP, TN,
pH, TS and Tu based on APHA (1998). In total, datasets acquired in 121 sampling dates were involved in the analyses, 60% of which comprised
all nine indicators; 17%, eight; 9%, seven; and 14%, six or less indica-tors. There was a monitoring gap between October 2001 and April 2004.
Water quality compliance for the reservoir was assessed using seven of such physical-chemical-biological indicators — those regulated by
Brasil (2005), as: BOD: 5 mg.L-1 (upper limit); TC: 1,000 MPN.100 mL-1
(upper limit); TP: 0.03 mg.L-1 (upper limit); TN: 1.27 mg.L-1 (upper limit);
DO: 5 mg.L-1 (lower limit); pH: between 6,0 and 9,0; and Tu: 100 NTU
(upper limit). The full time series of each indicator was contrasted with
its corresponding limit(s) using frequency curves of water quality data. Water quality frequency curves have been gradually adopted as a water
resource management tool to help identify the exceedance probability
Araucária Campo Largo
Campo Magro
Almirante Tamandaré
Curitiba
N
0 2.5 5km 500 km
of the prescribed parameter limits (CUNHA et al., 2012). The associated indicator was the proportion of non-compliant samples.
The WQI calculation approach of the Brazilian National Water Agency was adapted from the NSF formulation, and it involves the
following nine indicators in a weighed multiplication (individual
weights expressed in brackets): BOD (10%), TC (15%), TP (10%), TN (10%), DO (17%), pH (12%), TS (8%), T (10%), and Tu (8%). The WQI
equation (Equation 1) reads:
WQI = qWi
i n
i=1
Π (1)
In which:
i = each parameter in turn;
w = the parameter weight;
q = a quality factor, i.e., a value from 100 (best) to 0 (worst) associated
with the indicator monitoring results by means of a pre-defined conversion curve.
A WQI result thus calculated is interpreted in the state of Paraná,
Brazil, as: very good for 100>WQI>91; good for 90>WQI>71; average for 70>WQI>51; poor for 50>WQI>26; very poor for 25>WQI.
Alternative WQI formulations have been developed and used in different contexts, which vary in terms of specific parameters
included, as well as the relative weight distribution among indicators (e.g., HOU et al., 2016; SUN et al., 2016; TOMAS et al., 2017). When
using a WQI formulation, such as outlined above to diagnose water quality for a given location, the effect of partial data unavailability on
the indicating ability of the index is unknown, in principle. It likely depends on which parameters are excluded (e.g., due to monitoring
and/or analysis constraints) in terms of local relevance and relative contribution (weight) to WQI computation. Hence, Abtahi et al. (2015)
undertook a sensitivity analysis of alternative WQI formulations, and
found little effect of individual parameters on the overall index result for a given application, which was explained by the index robustness.
In this study, WQI calculation for complete samples for the Passaúna reservoir followed the WQI calculation approach of the Brazilian
National Water Agency and is referred to herein as the standard index composition. For incomplete samples, the weights of any missing
parameters were redistributed amongst the others, by observing the original weight proportion to maintain the relative importance of
the remaining parameters as per the standard formulation. Then, a sensitivity analysis of the WQI results was conducted to infer on the
effect of using adjusted WQI values amidst a dataset mostly comprising WQI results obtained using the standard index composition.
Analysis of the eutrophication potential of the reservoir with TSI was carried out using historical TP data and Equation 2
(LAMPARELLI, 2004):
TSI =10 6–[1,77–0,42In(1000TP)]
In(2)
⎧ ⎨ ⎩
⎫ ⎬
⎭ (2)
In which:
The trophic state classification follows ultraoligotrophic for TSI<47;
oligotrophic for 47<TSI<52;
mesotrophic for 52<TSI<59; eutrophic for 59<TSI<63;
super-eutrophic for 63<TSI<67; hypereutrophic for TSI>67.
Equation 2 has been selected instead of the classical formulae (e.g., by CARLSON, 1977), because it is more suitable to subtropical reservoirs
(CUNHA et al., 2013).
Correlation analysis based on Spearman’s rank correlation coefficient (ρ) was applied to the time series results of water quality indicators, WQI
and TSI. This analytical step was undertaken for the last ten years of the analysis period (2004–2014), to avoid the 2001–2004 monitoring gap
and to infer on change patterns owing to more contemporary influences. Macroinvertebrate data acquired in 2014 were used to calculate the H’
index and infer on medium-term water quality effects, as associated with the lifecycle of such organisms and their habitat suitability. The macroinvertebrate
community characterization results used were those obtained by Ferraresi (2015) for dry and wet conditions, in 2014. Such conditions were determined
based on the daily precipitation record for Curitiba in 2014, as provided by the National Institute of Meteorology (INMET), and the classification
method of Pereira et al. (2008) for the study region. The sampling stations were situated in the lentic littoral portion of the reservoir, were accessible
on foot from nearby roads, and had margins vegetated with grass and trees.
Both benthic and Eicchornia crassipes macrophyte-associated
communities were monitored following appropriate protocols (CETESB,
2012). They were later subjected to laboratorial identification to the level of family. Sampling of benthic organisms took place over four
campaigns, with two of them being in dry conditions and two in wet ones. A further wet campaign was undertaken for sampling
macrophyte-bound organisms, to assess H’ correspondence in another compartment. To determine habitat diversity, H’ was computed as Equation 3:
H’ = Spi .lnpi i=1
–Σ (3)
In which:
pi = the relative abundance of a macroinvertebrate family i;
s = the total number of families in a sample.
Values of H’<1.0 have been associated with highly polluted waters, H’>3.0
with unpolluted waters, and the range of 1.0<H’<3.0 has been linked with moderately polluted waters (WILHM; DORRIS, 1968), where pollution was
some organisms are sensitive to habitat change, while others can be classed as tolerant or resistant (GOULART; CALLISTO, 2003). A prevalence of these
two types of macroinvertebrates in reservoirs undergoing degradation has been reported by Silva et al. (2009), Dornfeld (2002), Pamplin et al. (2006),
Barbola et al. (2011) and Piedras et al. (2006). It was linked with community
change caused by disruption of the nutrient cycles (DORNFELD, 2002).
RESULTS AND DISCUSSION
Compliance Assessment
From the 121 time series samples (1991–2014), 55% were fully compliant in terms of the seven parameters considered in this analysis. The most
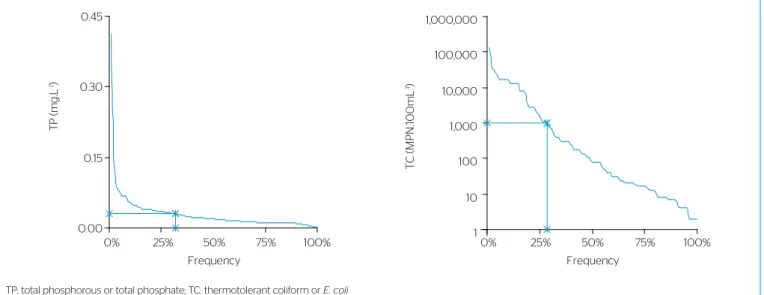
frequently compliant parameters were pH and Tu, with 100% of samples, followed by DO with 99%, BOD with 93% and TN with 91%. Historically,
the least compliant parameters were TP (68%) and TC (72%), with the corresponding frequency curves being illustrated in Figure 2.
As physical, chemical and biological data can help identifying habitat degradation causes, non-compliance of either or both parameters suggests
possible contamination by domestic effluents. For instance, Silva et al. (2011) showed that non-compliant TC results are not uncommon in
Passaúna river upstream of the reservoir. Excess phosphorous could also be originated in uncontrolled agricultural activities in the watershed and
enter the reservoir primarily via Passaúna river (VEIGA; DZIEDZIC, 2010). IAP (2017) reported eight TP samples above the standard of
0.03 mg.L-1 out of 26 samples for the period from 1998 to 2013. The
corresponding exceedance probability of 31% is remarkably close to
the one calculated herein, using a different, longer and larger dataset. The present compliance analysis generally corroborates earlier
assess-ments of Passaúna reservoir as one of the best preserved large public
water supply sources not only in the state of Paraná (e.g., IAP, 2017), but also in the context of water bodies situated in densely populated urban
regions in Brazil (e.g., ANA, 2017). This is likely a beneficial long-term effect of management and regulatory instruments implemented in the
watershed, such as the EPA and EEZ. However, it may also result from
improved sanitation in the region (CASTRO et al., 2017).
Water Quality Index and
Trophic State Index Assessments
The WQI results for the 1991–2014 period were firstly evaluated in terms of the percentage of samples in each category, which resulted in
very poor (0%), poor (2%), average (17%), good (63%), and very good (18%). A direct comparison with index results reported in IAP (2017)
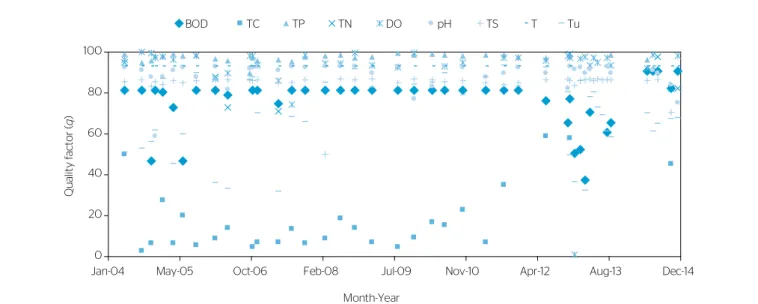
could not be made due to discrepant index versions and corresponding quality classes. Historically and in terms of WQI quality factors (q), TC
was the most critical water quality parameter for the reservoir, followed by turbidity and, occasionally, BOD. This can be observed in Figure 3,
which shows time series of q values for parameters that made up WQI
over the last 10 years of the analysis period (2004–2014). Low q values
indicated low relative quality of the corresponding parameter.
A significant (α=0.05) change pattern was only detected in TC
data, for which Spearman’s ρ=-0.42 with two-tailed p=0.02 suggested a moderate decrease of TC concentrations in the reservoir water over
such a more recent analysis period. This result suggested a positive influence of sanitation measures implemented in the region at the time.
Figure 4A illustrates WQI variation in the 2004–2014 period. A cor-relation analysis of all such WQI results (45 sampling dates) indicated
a significant overall trend of moderate increase with respect to time
(Spearman’s ρ=0.62 with two-tailed p≈0). Such set included 27 WQI
results calculated in the standard manner and 18 adjusted WQI results
0.00 0.15 0.30 0.45
0% 25% 50% 75% 100%
Frequency
T
P
(m
g.
L
-1)
1 10 100 1,000 10,000 100,000 1,000,000
0% 25% 50% 75% 100%
Frequency
T
C
(M
P
N
.10
0
m
L
-1)
Figure 2 – Water quality frequency curves for the least compliant parameters, for data in the period from 2004 to 2014 (exceedance probabilities — 32% for TP and 28% for TC).
(calculated using less than nine parameters, as explained above). When only standard WQI results were considered over the same period,
a significant overall trend of moderate increase regarding time was also observed (Spearman’s ρ=0.52 with two-tailed p=0.005). Thus, the
analy-sis based on WQI results suggested a significant trend of water quality
improvement in the 2004–2014 period, irrespective of the inclusion of adjusted index values in the dataset. This is in overall agreement with the
trend identified by IAP (2009) for the 1999–2008 period, even though it had other index version and different datasets. Therefore, this finding
points towards index robustness, as identified by Abtahi et al. (2015), but further studies are required to establish more definitive conclusions
for Passaúna reservoir in terms of alternative index compositions. Only
the water quality improvement rate would be considered lower using only standard WQI values (correlated with ρ=0.52) vis-à-vis including
adjusted WQI values in the dataset (correlated with ρ=0.62).
The results obtained for TSI indicated that the trophic potential of the
reservoir in the 1991–2014 period oscillated between oligotrophic and
mesotrophic in 84% of the samples, with an equal proportion between these classes. Only 8% of the samples suggested ultraoligotrophy, and only
a further 8% suggested the risk of eutrophy, supereutrophy or hypereutro-phy. Over the 2004–2014 period, as shown in Figure 4B, no significant
trend was detected for the trophic potential results with respect to time, as a correlation analysis of such results gave Spearman’s ρ=-0.17 with
two-tailed p=0.34. The present assessment is in overall agreement with
0 20 40 60 80 100
A B
Jan-04
May-05
Oct-06
Feb-08
Jul-09
Nov-10
Apr-12
Aug-13
Dec-14 Month-Year
W
Q
I
Very poor Poor
40 50 60 70
Jan-04
May-05
Oct-06
Feb-08
Jul-09
Nov-10
Apr-12
Aug-13
Dec-14 Month-Year
T
S
I
Ultraoligotrophic Oligotrophic
Mesotrophic Eutrophic Supereutrophic Hypereutrophic
Average Good Very good
Figure 4 – Variation of Water Quality Index (WQI) and Trophic State Index (TSI) results in the 2004–2014 period. 0
20 40 60 80 100
Jan-04 May-05 Oct-06 Feb-08 Jul-09 Nov-10 Apr-12 Aug-13 Dec-14
Month-Year
Q
u
al
it
y
fa
ct
o
r
(
q
)
BOD TC TP TN DO pH TS T Tu
BOD: biochemical oxygen demand; TC: thermotolerant coliform or E. coli; TP: total phosphorous or total phosphate; TN: total (Kjeldahl) nitrogen; DO: dissolved oxygen; TS: total solids; T: temperature; Tu: turbidity.
IAP (2009; 2017) in confirming the oligomesotrophic condition of the reservoir. With no statistically significant longer-term trend identified,
TSI oscillation is probably related to seasonal and other short-term effects.
Shannon-Weaver Index Assessment of
Macroinvertebrate Diversity
The macroinvertebrate communities taken together had H’=1.6, a value which
was also obtained for the periphytic macroinvertebrate community alone. The benthic community was slightly less diverse under both wet (H’=1.4)
and dry conditions (H’=1.2), probably due to more habitat opportunities offered by the macrophytes compared to the benthos. Similar H’ results were
obtained by Piedras et al. (2006) for another Brazilian reservoir with subtropical characteristics and subjected to urban influence, for which H’=1.7 for the wet
season and H’=1.4 for the dry season. Both results were indicative of higher macroinvertebrate diversity than reported by Barbola et al. (2011), for H’
values between 0.3 and 1.0 in a subtropical reservoir reportedly impacted by deforested margins, organic pollution and cyanobacteria growth.
According to Wilhm and Dorris (1968) classification scheme and based on the diversity level observed herein, the Passaúna reservoir
falls under the ‘moderately impacted’ category. Possible causes are water quality issues and modified flow regimes associated with flow
regulation, in addition to any localized natural effects. Further studies are required to establish the relative contribution of each possible cause.
The levels of DO, considered a limiting factor for community composition, remained within the acceptable range for the analysis period. Thus, these
H’ results may have happened due to altered levels of other chemicals and/or physical habitat issues. This will be investigated further through
a more in-depth assessment of the macroinvertebrate community
composition and extension of a water quality monitoring program to enhance spatial and temporal coverage and resolution.
CONCLUSION
The analyses showed that, for most samples, the reservoir water quality
was mostly good, while the trophic state oscillated between mesotrophic and oligotrophic. The reservoir was also found to be moderately impacted
in terms of macroinvertebrate diversity, and mostly compliant with its specified water body classification in terms of the results for seven
regulated water quality indicators. Chronic impacts probably caused by domestic and agricultural effluent pollution were linked with some aquatic
biodiversity loss, reflecting on the understanding of the relationships between macroinvertebrates and their habitat as fundamental to the
knowledge of the functioning of ecosystems. A moderate water quality improvement was detected for the 2004–2014 period, but potentially
detrimental activities should be more controlled within the basin to reduce impact risks and to help promoting water security in the study region.
ABTAHI, M.; GOLCHINPOUR, N.; YAGHMAEIAN, K.; RAFIEE, M.; JAHANGIRI-RAD, M.; KEYANI, A.; SAEEDI, R. (2015) A modified drinking water quality index (DWQI) for assessing drinking source water quality in rural communities of Khuzestan Province, Iran.
Ecological Indicators, v. 53, p. 283-291.
AGÊNCIA NACIONAL DE ÁGUAS (ANA). (2017) Conjuntura dos
Recursos Hídricos no Brasil 2017: Relatório Pleno. Brasília: ANA.
169 p.
AMERICAN PUBLIC HEALTH ASSOCIATION (APHA). (1998) Standard methods for the examination of water and wastewater. Washington, D.C.: APHA. 1220 p.
ANDREOLI, C.V.; HOPPEN, C.; PEGORINI, E.S.; DALARMI, O.A. (2003) Crise da água e os mananciais de abastecimento: a disponibilidade
de água na região metropolitana de Curitiba. In: ANDREOLI, C.V. (Org.).
Mananciais de abastecimento: planejamento e gestão. Estudo de caso
do Altíssimo Iguaçu. Curitiba: SANEPAR/FINEP. 494 p.
BAPTISTA, D.F. (2008) Uso de macroinvertebrados em procedimentos de biomonitoramento em ecossistemas aquáticos.
Oecologia Brasiliensis, v. 12, n. 3, p. 425-441.
BARBOLA, I.F.; MORAES, M.F.P.G.; ANAZAWA, T.M.; NASCIMENTO, E.A.; SEPKA, E.R.; POLEGATTO, C.M.; MILLÉO, J.; SCHÜHLI, G.S. (2011)
Avaliação da comunidade de macroinvertebrados aquáticos como ferramenta para o monitoramento de um reservatório na bacia do
rio Pitangui, Paraná, Brasil. Iheringia, Série Zoologia, v. 101, n. 1-2, p.
15-23. http://dx.doi.org/10.1590/S0073-47212011000100002
BRASIL. (2005) Resolução CONAMA 357. Brasília: Ministério do
Meio Ambiente. 27 p.
CARLSON, R.E. (1977) A trophic state index for lakes. Limnology
& Oceanography, v. 22, n. 2, p. 361-369. https://doi.org/10.4319/
lo.1977.22.2.0361
CARNEIRO, C.; KELDERMAN, P.; IRVINE, K. (2016) Assessment of phosphorus sediment-water exchange through water and mass
budget in Passaúna Reservoir (Paraná State, Brazil). Environmental
Earth Sciences, v. 75, n. 7, p. 564-577. http://dx.doi.org/10.1007/
s12665-016-5349-3
CASTRO, C.O.; LOUREIRO, O.C.S.; SANTOS, A.V.; SILVA, J.; RAUEN, W.B. (2017) Water sustainability assessment for the region of Curitiba.
International Journal of Sustainable Building Technology and Urban
Development, v. 8, n. 2, p. 184-194. https://doi.org/10.12972/susb.20170016
COMPANHIA AMBIENTAL DO ESTADO DE SÃO PAULO (CETESB). (2012)
Protocolo para o biomonitoramento com as comunidades bentônicas
dos rios e reservatórios do Estado de São Paulo. São Paulo: CETESB. 113 p.
CUNHA, D.G.F.; CALIJURI, M.C.; LAMPARELLI, M.C. (2013) A
trophic state index for tropical/subtropical reservoirs (TSItsr).
Ecological Engineering, v. 60, p. 126-134. https://doi.org/10.1016/j.
ecoleng.2013.07.058
CUNHA, D.G.F.; CALIJURI, M.C.; MENDIONDO, E.M. (2012) Integration between cumulative frequency curves for water quantity and quality as a tool for effective water resources management.
Engenharia Sanitária e Ambiental, v. 17, n. 4, p. 369-376. http://dx.doi.
org/10.1590/S1413-41522012000400003
DORNFELD, C.B. (2002) Utilização de análises limnológicas, bioensaios
de toxicidade e macroinvertebrados bentônicos para o diagnóstico
ambiental do reservatório de Salto Grande (Americana, SP). 211 f.
Dissertation (Mastering Course) – Universidade de São Paulo, São Paulo.
FERRARESI, A.C.S. (2015) Macroinvertebrados como indicadores de
qualidade de água no reservatório do rio Passaúna, PR, Brasil. 100
f. Dissertation (Mastering Course) – Universidade Positivo, Curitiba.
FINOTTI, A.R.; FINKLER, R.; SUSIN, N.; SCHNEIDER, V.E. (2015) Use of Water Quality Index as a tool for urban water resources
management. International Journal of Sustainable Development
and Planning, v. 10, n. 6, p. 781-794.
GHOSH, D.; BISWAS, J.K. (2015) Macroinvertebrate diversity indices: A quantitative bioassessment of ecological health status of an oxbow
lake in Eastern India. Journal of Advances in Environmental Health
Research, v. 3, n. 2, p. 78-90. http://dx.doi.org/10.22102/jaehr.2015.40190
GOULART, M.D.C.; CALLISTO, M. (2003) Bioindicadores de qualidade de água como ferramenta em estudos de impacto
ambiental. Revista da FAPAM, v. 2, n. 1, p. 156-164.
INSTITUTO AMBIENTAL DO PARANÁ (IAP). (2004) Monitoramento
da qualidade das águas dos reservatórios do estado do Paraná no
período de 1999 a 2004. Curitiba: IAP. 13 p.
______. (2009) Monitoramento da qualidade das águas dos
reservatórios do estado do Paraná no período de 2005 a 2008.
Curitiba: IAP. 120 p.
______. (2017) Qualidade das águas dos reservatórios do estado do
Paraná. Curitiba: IAP. 150 p.
LAMPARELLI, M.C. (2004) Graus de trofia em corpos de água do
Estado de São Paulo: Avaliação dos métodos de Monitoramento.
238 f. Thesis (Doctoring) – Universidade de São Paulo, São Paulo.
MANDAVILLE, S.M. (2002) Benthic macroinvertebrates in
freshwaters - Taxa tolerance values, metrics, and protocols. Soil &
Water Conservation Society of Metro, Halifax. 128 p.
PAMPLIN, P.A.Z.; ALMEIDA, T.C.M.; ROCHA, O. (2006) Composition and distribution of benthic macroinvertebrates in
Americana Reservoir (SP, Brazil). Acta Limnologica Brasiliensia,
v. 18, n. 2, p. 121-132.
PEREIRA, M.P.; CARAMORI, P.H.; RICCE, W.S.; SILVA, D.A.; CAVIGLIONE, J.H. (2008) Determinação do início e término da
estação chuvosa no estado do Paraná. Geografar, v. 3, n. 2, p. 1-12.
http://dx.doi.org/10.5380/geografar.v3i2.13586
PIEDRAS, S.R.N.; BAGER, A.; MORAES, P.R.R.; ISOLDI, L.A.; FERREIRA, O.G.L.; HEEMANN, C. (2006) Macroinvertebrados bentônicos como indicadores de qualidade de água na Barragem Santa Bárbara,
Pelotas, RS, Brasil. Ciência Rural, v. 36, n. 2, p. 494-500. http://dx.doi.
org/10.1590/S0103-84782006000200020
SILVA, F.L.; TALAMONI, B.J.L.; BOCHINI, G.L.; RUIZ, S.S.; MOREIRA, D.C. (2009) Macroinvertebrados aquáticos do reservatório do rio Batalha para a captação das águas e abastecimento do Município
de Bauru, SP, Brasil. Ambiente & Água, v. 4, n. 2, p. 66-74. http://
dx.doi.org/10.4136/1980-993X
SILVA, T.F.B.X.; RAMOS, D.T.; DZIEDZIC, M.; OLIVEIRA, C.M.R.; VASCONCELOS, E.C. (2011) Microbiological quality and antibiotic
resistance analysis of a Brazilian water supply source. Water, Air &
Soil Pollution, v. 218, n. 1-4, p. 611-618.
https://doi.org/10.1007/s11270-010-0672-x
SILVA FILHO, L.V. (2010) Qualidade e percepção ambiental: estudo
de caso da bacia hidrográfica do rio Passaúna. 202 f. Dissertation
(Mastering Course) – Universidade Federal do Paraná, Curitiba.
SUN, W.; XIA, C.; XU, M.; GUO, J.; SUN, G. (2016) Application of modified water quality indices as indicators to assess the spatial and temporal trends of water quality in the Dongjiang River.
Ecological Indicators, v. 66, p. 306-312.
THORP, J.H.; ROGERS, D.C. (2015) Thorp and Covich’s Freshwater
Invertebrates. 4. ed. London: Elsevier. 1148 p.
TOMAS, D.; ČURLIN, M.; MARIĆ, A.S. 2017. Assessing the surface water status in Pannonian ecoregion by the water quality index
model. Ecological Indicators, v. 79, p. 182-190.
TUNDISI, J.G.; TUNDISI, T.M. (2008). Limnologia. São Paulo: Oficina
de Texto. 632 p.
VEIGA, B.V.; DZIEDZIC, M. (2010) Estimating nutrient loads in the
Passaúna reservoir with FLUX. Water International, v. 35, n. 2, p.
210-222. https://doi.org/10.1080/02508061003664005
VON SPERLING, E. (1999) Morfologia de lagos e represas. Belo
Horizonte: DESA/UFMG. 137 p.
WILHM, J.; DORRIS, T. (1968) Biological parameters for water
quality criteria. Biological Science, v. 18, n. 6, p. 477-481. https://doi.
org/10.2307/1294272