Understanding Smart-Speakers Adoption in Portugal: A Unified
Theory of Acceptance and Use of Technology applied in the
Portuguese Consumer Market
Gonçalo Filipe Mendes Afonso
Dissertation submitted as partial requirement for the conferral of
Master in Marketing
Supervisor:
Prof. Daniela Langara da Silva do Souto, Prof. Auxiliar Convidada, ISCTE Business School, Departamento de Marketing, Operações e Gestão Geral
2 Understanding Smart-Speakers Adoption in Portugal: A Unified Theory of
Acceptance and Use of Technology applied in the Portuguese Consumer Market
Gonçalo Filipe Mendes Afonso
Dissertation submitted as partial requirement for the conferral of
Master in Marketing
Supervisor:
Prof. Daniela Langara da Silva do Souto, Prof. Auxiliar Convidada, ISCTE Business School, Departamento de Marketing, Operações e Gestão Geral
iii ~ U nder st and ing S m ar t-Spe aker s Ado pt ion in Po rt ug al : A U ni fi ed The or y o f A cc ep tanc e a nd use o f Tech nol o gy appli ed in t he P ortugue se C onsum er Ma rke t G onça lo F il ipe Me nd es Af onso
iv Acknowledgments
Before making any acknowledgments, I would like to say that I am proud to see this project coming to an end. Achieving it, required a great sense of duty, responsibility, and above all a tremendous effort on my part.
The dedication given to this project was only possible because those who accompany me did not let me give up when despair was the only feeling that plagued me. I want to leave a special thank you to my parents and my girlfriend who were my pillar of support throughout the process. I want to leave a message of gratitude to my brother too, for knowing how to ask me about the thesis and for all the times that helped me directly or indirectly.
I devoted myself to the project because I believed that my hard work would add something to me as a person and that a more complete professional would emerge than the one who in September faced the most diverse search engines looking for ideas on which he could work. A special word of gratitude for my closest friends that for many times were able to sit with me working and pushed me forward.
The culmination of this project could not have been achieved without the help of my supervisor, who sought to refine my work by making me think and rethink it, and by questioning every detail, so it would not be forgotten.
Before finishing it, I want to quote on Dogg S. (2018) "I wanna thank me for having no days off. I wanna thank me for never quitting. I wanna thank me for always been a giver and trying to give more than I receive. I want to thank me for trying to do more right than wrong. I want to thank me for just being me at all times”.
v Abstract
The technology market has been undergoing unprecedented changes and growth. From day to day new products, new concepts or new ideas arise on a rhythm like never. One of the most prominent trends in this evolution is the so-called Internet of Things.
Technological gadgets no longer require human intervention to communicate with each other, they do it autonomously and without requiring a direct command. Smart cities, smart homes, smart objects are a trend in the technological market, and it is impossible to be present at a technology fair without being approached by a new product that will revolutionize human life by increasing the use of technology.
In this product segment, we have seen the growth of smart speakers. Speakers that are not limited to reproducing music, but became a complementary object of human life, enhancing the efficiency and automated interaction of smart elements.
In this dissertation project, we propose to investigate the acceptance of smart speakers in Portugal.
To gather data on which we could withdraw conclusions, a questionnaire was developed, adapted from the one developed by Venkatesh et al. (2012). This questionnaire provided insights on which constructs the Portuguese consumer found important or not, in their decision-making process.
The results show that the Portuguese consumers do not look at these products as a product that helps to improve their lives, but as a product for entertainment and leisure use. Besides this, the Portuguese consumer identifies social influence as an important factor to increase their use of this technology.
Key Words: Smart Speakers; Information Systems; UTAUT; Behavioral Intention; Use Behavior.
vi Resumo
O Mercado tecnológico tem vindo a sofrer alterações e um crescimento, sem precedentes. De dia para dia aparece um novo produto, um novo conceito ou uma nova ideia, a um ritmo como nunca se viu. Uma das tendências em maior destaque nesta e evolução é o Boom da chamada Internet das Coisas.
Os gadgets tecnológicos, deixaram de precisar de intervenção humana para comunicar entre si, eles fazem-no autonomamente, sem precisar de um comando direto. Cidades inteligentes, casas inteligentes, objetos inteligentes são a tendência do mercado tecnológico e é impossível estar presente numa feira tecnológica sem ser abordado um novo produto que irá revolucionar a vida humana.
Neste segmento de produtos, vimos o crescer das colunas inteligentes. Colunas que deixaram de apenas dar som, mas a ser um objeto complementar da vida humana, potenciando a eficiência e a interação automatizada de elementos.
Neste projeto de dissertação propomo-nos a investigar a aceitação das colunas inteligentes em Portugal.
Para obter dados, foi desenvolvido um questionário com base no estudo de Venkatesh et al. (2012). Deste questionário obtivemos insights sobre o que o consumidor português considera importante, ou não, na adoção deste produto.
Os resultados obtidos revelaram que público consumidor português, não olha para estes produtos como um produto que os irá ajudar a melhorar a sua vida, mas como um produto de utilização para entretenimento e lazer. O público considera ainda como fundamental, para a expansão deste produto a nível nacional, a presença de influenciadores que usem os mesmos.
Palavras chave: Smart Speakers; Sistemas de informação; UTAUT; Intenção Comportamental; Comportamento de Uso
vii Table of Contents
Acknowledgments ... iv
Abstract ... v
Resumo ... vi
Table Of Contents ... vii
List of Figures ... ix
List of Tables ... x
1. Introduction ... 1
1.1 Research Problem ... 5
2. Literature Review ... 6
2.1 Theory of Reasoned Action (TRA) ... 7
2.2 Technology Acceptance Model (TAM) ... 8
2.3 Motivation Model (MM) ... 9
2.4 Theory of Planned Behaviour (TPB) ... 9
2.5 Combined TAM and TPB (Augmented TAM) ... 10
2.6 Model of PC Utilization (MPCU) ... 11
2.7 Innovation Diffusion Theory (IDT) ... 12
2.8 Social Cognitive Theory (SCT)... 13
2.9 Unified Theory of Acceptance and Use of Technology ... 14
2.10 In sum ... 16
2.11 Formulation of Hypothesis ... 17
3. Research Methodology ... 22
4. Results ... 25
4.1 Procedure for data analysis ... 27
4.2 Measurement Model ... 29
viii
4.4 Path Coefficient Significance ... 33
4.5 Hypothesis Validity ... 34
4.6 Discussion on results. ... 35
5. Conclusion ... 39
5.1 Managerial Implications ... 40
5.3 Limitations and Future Research... 41
6. References ... 42
Appendix ... 45
A - Survey ... 45
ix List of Figures
Figure 1- Smart speaker unit shipments by brand ... 4
Figure 2 - Smart speakers unit sales predictions (2019) ... 5
Figure 3 - Gender Distribution ... 25
Figure 4 - Age Range ... 25
Figure 5 - Professional Occupancy ... 26
Figure 6 - Scholarship ... 26
Figure 7 - Experience with Smart Speakers ... 26
x List of Tables
Table 1 - Adaptation of Venkatesh et al. (2012) survey ... 22
Table 2- Item Loadings... 29
Table 3 - CA, CR and AVE ... 30
Table 4 - Discriminant Validity - Fornell-Larker ... 31
Table 5 - Loadings and Cross Loadings ... 31
Table 6 - R-Square of Behaviour Intention ... 32
Table 7 - Collinearity Statistics (VIF) ... 32
Table 8 - Bootstrapping Path Coefficients ... 33
1 1. Introduction
The Internet of things (IoT) is one of the leading topics in scientific development nowadays. According to the International Data Corporation market study from 2018, worldwide spendings with the Internet of things will grow at a CAGR (compound annual growth rate) of 13,6% from 2017 to 2022, when it will reach a market value of $1.2 trillion.
Nearly one-quarter of a century after the commercialization of the Internet, the world business landscape has changed (Kannan et al, 2017). Present in their pockets, in their houses, in their life, the internet has become a significant tool in the daily life of any urban citizen. The connection of the world to an entirely unprecedented network of information, as well as unparalleled dissemination of communication tools, has become a reality with which the world has learned to cope and to live by.
Internet of things itself is a computing concept that describes the idea of ordinary physical objects, connected amongst themselves, recognizing one another through the internet connection (in https://www.techopedia.com/definition/28247/internet-of-things-iot). In 1999, on a presentation for P&G, Kevin Ashton first introduced this concept to describe how a universal network of sensors connected to the internet, could process and understand information about the surrounding environment, without human intervention. Simplifying the concept, the Internet of things is about a network of objects connected through the internet, with autonomous communication functions (Park et al, 2017; Jayavard et al., 2013).
Differently from the first definition of the Internet, where data is gathered by people and by people connections, the Internet of things is about data created by “things”. The idea behind this concept is that objects connected through “Radio-Frequency Identification tags (RFID), sensors, actuators, mobile phones, etc” are able to interact with each other to fulfill a determined goal (Atzori L. et al., 2013; Canhoto A. et al., 2017).
With such potential, specialists predict that IoT will have a major impact both on everyday-life for consumers as well as on the business landscape. According to
www.statista.com market studies, by 2025 there will be 75,44 billion devices connected around the world.
2 Following the https://iot-analytics.com/ market analysis, we split the IoT market into two different segments: Consumer IoT and Business IoT. Consumer IoT is about the impact that these devices will have on the consumers daily life, and it can be divided into four different categories: i) home, which represents home automation, home improvement, and energy efficiency; ii) lifestyle, which represents wearables, entertainment, family and leisure; iii) health, which represents fitness and health monitoring, measurement and diagnosis; and iv) mobility, which regards to the smart cars, and smart-cities (IoT Analytics 2019).
The business IoT segment is about the impact of having connected devices sharing information between them and providing more efficient methodologies and processes on the managerial environment. From the production and storage to distribution or store shelving, IoT will provide more accurate data and real-time visibility into the flows of materials and products (Lee I. et al., 2015). It will have an impact on numerous areas such as retail, health, energy, mobility, cities, manufacturing, public services, and others.
In this study, our goal will be to focus on the consumer IoT environment, specifically in Smart Speakers and their acceptation amongst the Portuguese population.
Smart home or smart-house and home automation, as it can be read in many literature, refers to the use of information and communication technologies (ICT) in house control and maintenance, “ranging from controlling appliances to automation of home features” (Stojkoska B. et al, 2017). These include remote control of windows, temperature, locks and all the connected devices such as home theater. Investopedia (2019) defines Smart home as a “convenient home setup where appliances and devices can be automatically controlled remotely from any internet-connected place in the world using a mobile or other networked device”.
It is on the segment of the smart home that we find the Smart Speakers devices, which will be the focus of this study. Although the concept of Smart Speakers is not properly investigated or has a relevant academic research background, a smart speaker is a smart device (a device connected to the internet), that by being connected can perform a set of other tasks besides the one it was created to (Tech Target, 2019). Some smart speakers feature voice assistants, which provide these speakers’ other capabilities besides playing music.
3 Voice Assistants are interfaces that can be used to communicate with all the other smart home devices, as well as perform many other tasks. On an earlier age of Voice Assistant devices, the voice-activated technologies relied on a smaller set of “built-in” commands that originated certain responses. Nowadays, voice assistants are connected to the internet, with each interaction being analysed on a central computing system, that provides the proper reaction (Hoy M, 2018).
The most famous voice assistant interfaces are Siri, from Apple, Cortana, from Windows, Alexa, from Amazon, Google Assistance, from Google, and Bixby, from Samsung. These interfaces rely on natural language processing (which is computational linguistics), to create meaningful responses quickly. Hirscheberg J. et al (2015) state that the improvements in natural language recognition happened due to the combination of the following four factors:
• Increase in computing power;
• Availability of large amounts of linguistic data;
• Development of highly successful machine learning methods;
• A richer understanding of human language and its deployment in social contexts.
Smart speakers that work with voice-assistants, are on a permanent “listen-mode” and are activated by voice control when the user expresses a “wake word” (McCue, 2018). Following on Hoy M. (2018) paper, the main functionalities of these integrated voice assistants are:
• Send and read text messages, make phone calls, and send and real e-mail messages;
• Answer basic informational queries; • Set timers, alarms and calendar entries;
• Set reminders, make lists and do basic math calculations;
• Control media playback from connected services such as Amazon, Google Play, iTunes, Pandora, Netflix, and Spotify;
• Control IoT enabled devices such as thermostats, lights, alarms, and locks;
4 • Other features, called “skills” that expand their abilities by interfacing
with other programs via voice commands.
Overviewing the smart speakers’ market, it has been growing with tremendous potential. In the US, more than 25% of the households already have a smart speaker, and the predictions aim to double this number by 2022 (Radhika G. 2019). On the other hand, in China, in just one year the smart speaker market share went from almost non-existing to 30% with the market being evaluated at over 7 billion dollars (Routley, 2019). According to the same author, USA and China hold around 70% of the smart speakers’ market, with the rest of the world owning the other 30%
The first smart speaker on the market was Amazon Echo, back in 2014, followed by the Google Home in 2016. From 2017 on, more brands were introduced to the market, mainly influenced by the sales increase in the Chinese market. According to
www.statista.com analysis on smart speakers’ market share quarterly, the biggest players on the market nowadays, are Amazon, Google, and Alibaba as it can be seen on the following table
Figure 1- Smart speaker unit shipments by brand
5 1.1 Research Problem
As we above mentioned, smart speakers are making quite a success in some markets but have not quite made it on others. USA and China represent 70% of the smart speakers market share, with the rest being divided for the rest of world, but as it can be seen on the table below, withdrawn from Statista.com, in 2019 the predictions aim to a reduction of this gap between Europe and the USA and the Asia Pacific sales.
In the current study, we will investigate the user’s acceptance of this new information technology, in Portugal, a market that is still flourishing. You can now buy smart speakers on some physical retailers, and you will be able to order them online, yet it is not a so widely spread product, and there is still a lot of room for it to grow and to establish in the market.
The main Research Question of this study will be: What are the main motivations and the main barriers to the acceptance of this new information technology in Portugal?
There are several models that try to explain a user’s acceptance behavior of new Information technology and Information System. In the following literature review, we will contextualize the most prominent models, reviewing the same, and concluding which one will be more suitable to the current study.
On our path to find the answer to the main research question, we will aim to understand which constructs do the Portuguese consumer most value on smart speakers, and which constructs will mostly impact the usage behavior.
Figure 2 - Smart speakers unit sales predictions (2019)
6 2. Literature Review
Individual acceptance and use of information technologies has been subject of large amount of researches, with various theories and models being developed to understand individuals´ intentions to adopt a new technology, with the psychology and sociology fields being key contributors to this development (Venkatesh et al., 2003; Venkatesh et al, 2012; Benbasat et al. 2007; Hu et al., 1999).
Each model has its own characteristics, however, it is possible to find some similarities across them (Venkatesh et al, 2003). Considering the main question, we pursue the answer to, our aim in our literature review will be, to determine which model is more suitable to perform data analysis on the Portuguese consumers' behavior regarding a new technology.
Between all the models created to better understand users´ acceptance and use of new information technologies, eight of them were considered by Venkatesh (2003) as “prominent models” to consider when developing a unified view of technology acceptance models. This consideration is important for understanding, not only which models could be followed to conduct a proper user acceptance test on smart speaker usage intentions in Portugal, but also to determine which model would be more suited for the purpose of this investigation.
At the end of our literature review, we will conclude which model should be followed, developing the investigation according to its main constructs. In order, to conduct this analysis we will follow on Venkatesh et al. (2003) review of these same models.
The models that we are going to study are the following: Theory of Reasoned Action (TRA), Technology Acceptance Model (TAM), Motivational Model (MM), Theory of Planned Behavior (TPB), Combined TAM and TPB (C-TAM-TPB), Model of PC Utilization (MPCU), Innovation Diffusion Theory (IDT), Social Cognitive Theory (SCT) and Unified Theory of Acceptance and Use of Technology (UTAUT).
Following on Venkatesh et al. (2003) research, the authors positioned each model, over the influence of four moderators. On the models that we will review, these moderators were found to have an impact on the conclusions. Since we do not want to
7 exclude any variable, that we may find important for the decision on which one is the proper model to use, we will review each model and make considerations on these moderators' impact. The four moderators are Experience, Voluntariness, Gender, and Age.
2.1 Theory of Reasoned Action (TRA)
Developed by Ajzen and Fishbein (1975), and with its basis in social psychology, TRA is one of the most fundamental and influential theories of human behavior (Venkatesh et al. 2003). The core constructs of this Model are Attitude Towards Behaviour and Subjective Norm concerning behavior as a predictor of individual intention to perform a determined behavior (Ajzen and Fishbein 1975).
Attitude towards behavior is understood as individuals´ general favourableness or unfavourableness towards some stimulus object (Ajzen and Fishbein, 1975). In their study, the authors considered that the beliefs created around an object, lead to the creation of an attitude towards it which is a function of his/her evaluations of the object attributes.
On the other hand, subjective norm consists of the “perception that the people who surround him think he should or should not adopt a determined behavior” (Fishbein & Ajzen, 1975: 302). Following on the authors' theory analysis, Subjective Norm is determined by the perceived expectations of a referral group and by the individuals´ motivation to comply with that group expectations.
Regarding the moderators influencing the model, we can find references to Experience and Voluntariness in some literature. On the other hand, both Gender and Age have been used to enrich the present model.
The experience was not considered as a moderator in the original model, yet (Davis et al., 1989) examined the role of experience using a cross-sectional analysis, with no change in the salience of determinants. Kahanna (1999) found that as experience increased, the Attitude construct grew in importance while the Subjective norm construct would diminish its importance.
8 2.2 Technology Acceptance Model (TAM)
Developed by Fred D. Davis (1989) TAM was conceptualized for the Information Systems context. It was developed as a model to predict Information Technology Acceptance and usage, on in-job tasks. Originally, the key constructs of this model were Perceived Usefulness and Perceived Ease of Use, Davis (1989).
Perceived Usefulness is described as “the degree to which a person believes that using a particular system would enhance his or her performance” (Davis, 1989:320), which means that a person tends to use, or do not use, an application to the extent that the individual believes it will have a positive impact on his performance.
Perceived Ease of Use is described as “the degree to which a person believes that using a particular system would be free of effort” (Davis, 1989:320), which enrich the previous construct by considering that even if an application is perceived as useful, the applications´ complexity will influence the users´ acceptance of information technology.
Davis et al (2000) extended the original TAM model, adding more constructs on the influence of an individual’s acceptance of new information systems. In this model, the subjective norm was considered as another predictor of intention, in the case of mandatory settings, Venkastesh et al. (2003) apud Davis et al. (2000). In their research, Davis et al. (2000), followed on the TRA definition of Subjective Norm: “Person’s perception that most people who are important to him think he should or should not perform the behavior in question”, to develop the model.
Regarding the four moderators that Venkatesh et al. (2003) identified, the only one which was not tested in any further development of the model, was age. Even though the experience was not explicitly included in the original TAM, Davis (1989) and Szajna (1996), provided empirical evidence that with the increase of the experience the construct of ease of use becomes non-significant. In the original TAM, voluntariness was not included, however with the introduction of the subjective norm on TAM2, voluntariness was found to be salient only in mandatory settings with limited experience. Even though gender was not included in the original TAM, Venkatesh and Moore (2000) demonstrated that Perceived Usefulness was more salient for men and Perceived Ease of Use for
9 women. In the same research, subjective norm was identified as a more salient variable for women in the early stages of experience.
2.3 Motivation Model (MM)
Motivation theory has been used as an explanatory theory for human behavior, that had much support from the literature (Venkatesh et al. 2003). For its importance, the motivation model has been applied in several numbers of subjects, including as we are seeing here, Information Systems. David et al (1992) on a study on Extrinsic and Intrinsic Motivation to use computers in the workplace, corroborated the previous literature by identifying extrinsic and intrinsic motivation as key drivers for an individual’s intention to perform a certain behavior.
The core constructs of this theory are intrinsic and extrinsic motivation. Vallerand (1997) defined intrinsic motivation as a “behavior performed by itself, in order to experience pleasure and satisfaction inherent in the activity”, and extrinsic motivation as “performing a behavior in order to achieve some separable goal, such as receiving rewards or avoiding punishment”.
Regarding the four moderators identified on Venkatesh (2003), none of them was developed on the motivational model regarding Information Systems, as far as our research went.
2.4 Theory of Planned Behaviour (TPB)
Developed by Ajzen (1985), Theory of Planned Behaviour is an extension of the Theory of Reasoned Action, differing from this by taking into account perceived and actual control over the behavior into consideration. Regarding the purpose of this study, the Theory of Planned Behaviour has been successfully used to understand individual acceptance and usage of different technologies, Venkatesh et al. (2003).
Perceived Behavioural Control is considered by Ajzen, as the perceived ease or difficulty of performing a behavior, Ajzen (1991). Following on the same author
10 investigation, “expectancies regarding locus of control are likely to influence behavior only to the extent that they have an impact on perceived control over the specific behavior in question”, Ajzen (1991:188). In the context of Information Systems Research, Taylor et al. (1995 b) define the construct as the perception of internal and external constraints in behavior.
A related model of TPB is DTPB (decomposed theory of planned behavior), Venkatesh et al. (2003), which is the decomposition of the three main constructs of TPB into their underlying belief structure, within the technology adoption model.
Following on Venkatesh et al. (2003) analysis on moderators influencing the investigations, we have that even though experience was not explicitly included in the original model, some follow-on studies have demonstrated that. Just as Karahanna (1999) found in the context of TRA, experience has an impact on the relationship between subjective norm and behavioral intention. Voluntariness was also not included in the original research, yet, as noted on TRA, subjective norm is suggested to be influenced by Voluntariness (Venkatesh et al. 2003 apud Hartwick et al. 1994). Venkatesh et al. (2000) concluded that attitude was more salient on men while subjective norm and perceived behavioral control were more salient for women. The attitude was also more salient on youngsters while the subjective norm was more salient on older women, Venkatesh et al. (2000).
2.5 Combined TAM and TPB (Augmented TAM)
Taylor et al. (1995a), identified that the existing models to predict information systems acceptance had a lack of discrimination on whether the individual had prior experience with Information Systems or not.
This research was conducted by adopting both TAM and TPB, using four main constructs that had already been developed on those models: attitude toward behavior, subjective norm, perceived behavioral control and perceived usefulness.
The research concluded that the augmented TAM provided an adequate model for both experienced and inexperienced users.
11 Regarding the moderators’ impact on the research, experience was already included in the original model, and it was demonstrated that Perceived Usefulness, Attitude toward behavior and behavior control were more salient with increasing of the experience while subjective norm became less salient.
There has not been identified any further developments regarding the other three models using the Combined TAM and TPB model, neither has it been found by Venkatesh et al. (2003).
2.6 Model of PC Utilization (MPCU)
Developed by Thompson et al. (1991), MPCU is a derivation of the Triandis (1977) theory of human behavior, adapted for the information systems contexts. The nature of the model makes it particularly suited for the prediction of individuals' acceptance and use of information technologies. The focus of Thompson et al. (1991) model, was to predict usage behavior rather than intention, Venkatesh (2003).
The core constructs of this model are job fit, complexity, long-term consequences, affect towards use, social factors and facilitating conditions, Thompson et al. (1991).
Job-fit is the dimension that considers the extent to which an individual believes that using a computer enhances his performance, Thompson et al (1991). The current literature extent has created empirical support to claim that there is a positive relationship between perceived job fit and PC utilization.
On complexity, Thompson et al. (1991) adopted Rogers et al. (1971) definition as the “degree to which an innovation is perceived as relatively difficult to understand and use”, Thompson et al. (1991:128). According to Tornatzky et al. (1982), the more complex an innovation is, the lower will the adoption rate be.
Long-term consequences of use are the outcomes that have a pay-off in the future, Thompson et al (1991).
Regarding the affect towards use, Thompson at al (1991) adopt the Triandis (1977) definition as “an idea, charged with affect, that predisposes a class of action to a
12 particular class of social situations”, Thompson et al. (1991:127), that the individual considered to be an imprecise term which would be better for discussion.
The social factors construct was also derived from Triandis (1977), with Thompson et al. (1991) adopting the definition as the “the individual internalization of the reference groups subjective culture, and specific interpersonal agreements that the individual has made with other, in a specific social context” Thompson et al. (1991:126).
Finally, facilitating conditions definition was also adopted from Triandis's (1977) study as “objective factors, out-there in the environment, that several judges or observers can agree that makes an act easy to do” Thompson et al. (1991:129).
Positioning this model on the four moderators identified on Venkatesh et al. (2003) research, only experience can be found on the original Thompson et al. (1991) demonstrating that complexity, affect towards use, social factors, and facilitating conditions were more salient with less experience, while on the other hand, long-term consequences increased its importance with increase of experience levels.
2.7 Innovation Diffusion Theory (IDT)
Rogers (1962) developed the Innovation Diffusion Theory, which is one of the oldest social science theories. It has been used for a wide diversity of innovations, ranging from agricultural tools to organizational innovations, Venkatesh (2003).
Moore & Benbasat (1991) adopted the characteristics of innovation, present on Rogers (1962) model, and refined a set of constructs that could be used to study individual technology acceptance.
The core constructs of this model are relative advantage, ease of use, image, visibility, compatibility, results demonstrability and voluntariness of use.
Following on Rogers (1983) paper, Moore & Benbasat (1991) defined relative advantage as “the degree to which an innovation is perceived as being better than its precursor” and compatibility as “the degree to which an innovation is perceived as being consistent with the existing values, needs, and past experiences of potential adopters”, Moore & Benbasat (1991:195). Even though some researchers find image to be part of
13 the relative advantage construct, others consider image different enough to be a separate construct, Moore & Benbasat (1991). Accordingly, the authors accepted image as “the degree to which use of an innovation is perceived to enhance one’s image or status in one’s social system”. Voluntariness of use was deemed necessary for this study, and Moore & Benbasat (1991) defined it as “The degree to which use of innovation is perceived as being voluntary, or of free will”, Moore & Benbasat (1991:195). Venkatesh et al (2003:431) apud Moore and Benbasat (1991), defined the visibility construct as “the degree to which one can see others using the system in the organization”.
The last two constructs of this model were withdrawn from Davis (1986) TAM and are perceived ease of use and perceived usefulness.
On Venkatesh et al (2003) analysis, the authors found that the individual experience with information systems would have an impact on the constructs, Karahanna et al (1999) and that voluntariness would impact individuals’ intention to use.
2.8 Social Cognitive Theory (SCT)
Social Cognitive theory was developed by A. Bandura in the ’60s and is considered one of the “most powerful theories of human behavior”, Venkatesh et al (2003).
In 1995, Compeau and Higgins developed and extended the SCT model to the context of computer utilization, Venkatesh et al (2003). Even though the original study was on “computer use”, the nature of the model and its underlying theory allow it to be extended to acceptance and use of technology. Venkatesh et al (2003) overviewed the model, assuming the dependent variable as intention and usage of information systems. For the purpose of this study, we will follow the same streamline.
The core constructs of the SCT model, developed by Compeau & Higgins (1995) are outcomes expectations – regarding performance, outcomes expectations – regarding personal goals, self-efficacy, affect and anxiety.
Outcomes expectations are the consequences of the behavior, Venkatesh et al. (2003) apud Compeau & Higgins (1995). Compeau & Higgins (1995) differed it into performance – which are personal expectations of job-related outcomes – and personal –
14 which refers to the personal expectation regarding the individual esteem and sense of accomplishment.
According to their literature review, Compeau & Higgins (1995) adopted the definition of self-efficacy as the capability to perform a certain behavior. Affect refers to the individual’s affect for a particular behavior and the influence that it has on his actions, Compeau & Higgins (1995). Anxiety is the last construct, and it is about the emotional reactions that an individual evokes when considering performing a behavior, Compeau & Higgins (1995).
Regarding the four Moderators that Venkatesh considered in his study, besides the lack of consideration of those four factors on the original study, we did not find any further development on these on the following investigations.
2.9 Unified Theory of Acceptance and Use of Technology
Originally developed by Venkatesh et al. (2003), UTAUT is no more than the aggregation of the most influential streamlines of technology acceptance research. In this model, Venkatesh et al (2003) analyzed the same eight models that we have, with the purpose to find out which constructs better determine an individual’s behavioral intention to adopt, or not, a determined information system. The four main constructs of this model are performance expectancy, effort expectancy, social influence and facilitating conditions.
Following the authors definitions, performance expectancy is “the degree to which an individual believes that using the system will help him or her to attain gains in job performance”, Venkatesh et al. (2003:447), which means that performance expectancy stands for the perception that an individual has of how a new information system will impact his in-job performance, Venkatesh et al (2003).
Effort expectancy is considered “the degree of ease associated with the use of the system”, Venkatesh et al. (2003:450), which stands for the perception of ease that the individual will have to use a determined information system, Venkatesh et al (2003).
Social influence is defined as “the degree to which an individual perceives that important others believe he or she should use the new system” (Venkatesh et al.,
15 2003:451). This definition frames the third-party influence on an individual usage intention of a new information system (Venkatesh et al., 2003).
Facilitating conditions are defined as “the degree to which an individual believes that an organizational and technical infrastructure exists to support the system”, Venkatesh et al. (2003:453) that stand for the individual perception that his possible difficulties in adopting a system would be diminished by a proper CRM system, Venkatesh et al (2003).
Since the UTAUT model was designed with the incorporation of the four moderators that we have seen on all of the other models, moderators were all take into consideration. Performance expectations and effort expectancy are both found to be influenced by both gender and age, as well as experience, Venkatesh et al. (2003). The construct of social influence is contingent with all four moderators, being considered by the authors as almost nonsignificant if the moderators were not included. At last, facilitating conditions construct was only significant when analyzed in conjunction with the moderating effects of age and experience.
Understanding the limitations of the current literature in predicting the individual’s behavior intention on the consumers' environment, Venkatesh et al. (2012) extended the UTAUT model, developing UTAUT 2: a model created to the purpose of understanding consumers acceptance and use of information systems on the daily life.
Adapting the model to the consumer context, required some alterations on the original model as the dropping of voluntariness as a moderator. The definitions of the already included constructs also suffered some alterations with performance expectancy being defined as “the degree to which using a technology will provide benefits to consumers in performing certain activities”, effort expectancy is “the degree of ease associated with consumers’ use of technology”, social influence is “is the extent to which consumers perceive that important others (e.g., family and friends) believe they should use a particular technology” and at last facilitating conditions is “consumers’ perceptions of the resources and support available to perform a behavior”, Venkatesh et al. (2012:159).
Finally, the adaptation of the UTAUT to the consumer context led to the inclusion of three more constructs: hedonic motivation, price value, and habit.
16 By hedonic motivation, Venkatesh et al. (2012) adopt the definition of Brown and Venkatesh (2005) as “the fun or pleasure derived from using technology”, which has been shown to play an important role in determining technology acceptance and use, Venkatesh et al (2012).
Price value is defined as “consumers’ cognitive trade-off between the perceived benefits of the applications and the monetary cost of using it”, Venkatesh et al. (2012:161), derived from Dodds et al (1991) definition, and this regards to the extent that an individual has to pay to acquire a new information system instead of what we have seen until now.
At last, experience and habit have also been included as constructs on this model. Experience “reflects an opportunity to use a target technology and is typically operationalized as the passage of time from the initial use of a technology by an individual” and habit is defined as “the extent to which people tend to perform behaviors automatically because of learning”, Venkatesh et al (2012:161).
2.10 In sum
The above-mentioned models all present a proper form of understanding of individuals’ intention to use a determined technology. Yet, to the purpose of this research, is important to understand which one is better.
Moving away from what could be purely an empirical analysis, on the Venkatesh et al. (2003) research to build a unified view of models, the nine models were tested to understand which one represented the biggest variance of the variable “Intention” (Venkatesh et al. 2013; Venkatesh et al. 2012).
There were conducted four studies: two for voluntary settings and two for non-voluntary settings. In all these studies, the constructs were evaluated three times: post-training of using a new information system, one month after the implementation of the system and three months after the implementation of the systems. Afterward, the data was treated for each one of the first eight models, creating a pooled analysis of the same.
Comparing these results to the ones obtained from the UTAUT research, which after its formulation was again tested, the model that represented better the variance as
17 Intention predictor was by large the Unified Theory of Acceptance and Use of Technology, with an adjusted R2 of 69%, Venkatesh et al. (2003).
Furthermore, the Venkatesh et al (2012) investigation is directed exclusively to the consumer environment, which is in fact what we will approach in this study, resulting in an increase of the variance explained in behavioral intention (74%) and use behavior (52%). Venkatesh et al. (2012) also tested the validity of the UTAUT2 model without the influence of the four moderators. This model outcomes revealed a variance explanation of 44% for Behavioural Intention and of 35% for use behavior, Venkastesh et al. (2012).
There forth the model we will follow to perform our research will be the Unified Theory of Acceptance and Use of Technology since it is the most proper model to apply to the consumer context.
2.11 Formulation of Hypothesis
Positioning our research question on these models (“What are the main motivations and the main barriers for the acceptance of this new information technology in Portugal?”), our research aims to understand which constructs would be more important for the Portuguese consumer. With that in mind we will evaluate the impact of the Performance Expectancy, Effort Expectancy, Social influence, Facilitating conditions, Hedonic Motivations, Price Value and Habit on the Portuguese consumers Behavioural Intention and Use Behaviour.
Performance Expectancy is the construct that addresses the individual's expectations of personal fulfillment through the use of certain technology (Venkatesh et al. 2003).
The importance of this variable is present in all the previously discussed models. In the TAM model the influence of this construct is present in the perceived usefulness construct; in the motivation model, this variable is present in the extrinsic motivation construct; in the MPCU model this construct is reflected in the job-fit variable; in the IDT model it is represented by the relative advantage variable; finally, in the SCT model is present in the outcome expectations variable. In all of these models, performance
18 expectancy is Behavior Intention's strongest predictor, whether technology is used voluntarily or not.
H1 – Performance expectancy has a significant and positive impact on behavioral
intentions regarding the adoption of smart speakers;
Effort Expectancy, as the name suggests, is the ease-of-use technology (Venkatesh et al. 2003). Other models that also use this concept in their variables are TAM (through the perceived ease of use variable), MPCU (defined in the complexity variable) and IDT (which alongside TAM also uses the ease of use variable) (Venkatesh et al. 2003).
In any of these models, the influence of this construct is noticeable, especially when there is little or no experience of using the technology. In these same models, it is noted that as the user experience increases, the impact of this variable tends to decrease (Venkatesh et al. 2003). For the extent of our study, and since the adoption of smart speakers in Portugal is not well established, we will consider a positive impact of effort expectancy in behavior intention.
H2 – Effort Expectancy has a significant and positive impact on behavioral
intentions regarding the adoption of smart speakers;
Social Influence is the construct that assesses the impact of the opinion of people that the user values on whether or not to use technology (Venkatesh et al. 2003).
Despite being present under different names, the TRA, TAM2, TPB / DTPB, C-TAM-TPB, MPCU, and IDT models all have a variable that recognizes the impact of third parties on user attitudes. In environments of voluntary use of a technology, third party influence is seen as influencing the user's perception of the technology in question (Venkatesh and Davis 2000). For the extent of our research, we will consider the social influence construct has a positive variable impacting behavior intention.
H3 – Social Influence has a significant and positive impact on behavioral
19 Facilitating conditions, in turn, represent the individual's belief that there is a support structure for their use of a certain technology (Venkatesh et al. 2003). This definition can be found in other models in the form of perceived behavioral control (TPB / DTPB and C-TAM-TPB), facilitating conditions (MPCU) and compatibility (IDT). In each of these models, the variables are equated to the extent that there are organizational aspects that are created to reduce the barriers to technology adoption (Venkatesh et al. 2003). According to the author, the presence of the effort expectancy and performance expectancy variables reduces the impact of the facilitating conditions variable on Behavioral Intention. However, Venkatesh et al. (2003) also reflect on the increased impact of this variable as the user experience increases.
H4 – Facilitating conditions has a significant and positive impact on behavioral
intentions regarding the adoption of smart speakers;
H5 – Facilitating conditions has a significant and positive impact on use behavior
regarding the adoption of smart speakers;
Hedonic Motivation is the variable that considers the pleasure and fun that the user derives from the use of technology (Venkatesh et al. 2012). Other authors, such as Heijden V. (2004) or Thong et al. (2006) analyzed the impact of this variable and found that it has a significance regarding the use and adoption of a particular technology (Venkatesh et al. 2012).
Venkatesh et al. (2012) successfully use this variable as an influencer of behavior Intention on the consumer market. For the extent of our research, we will follow on the author's tail, and also consider that this variable will have a positive impact on behavior intention.
H6 – Hedonic motivation has a positive and significant impact on behavioral
intentions regarding the adoption of smart speakers;
Price Value is the variable that defines the cognitive trade-off that the user forms between the benefits provided by the use of technology and its cost (Doods et al. 1991). This figure tends to have a significant impact on behavior intention when analyzing the
20 consumer market, as opposed to a business market analysis where costs are usually borne by the company (Venkatesh et al. 2012).
In this study, such as Venkatesh et al. (2012) did, we consider that this variable will impact behavior intention. Venkatesh et al. (2012) theorize that this impact will be positive when the benefits of using technology outweigh the cost of technology. Given the added value of the product and the wide range of prices on the market, for our study, we will consider that price value will have a positive impact on behavior intention.
H7 – Price value has a significant and positive impact on behavioral intentions
regarding the adoption of smart speakers;
Habit is a construct defined as the phenomenon of user automation of tasks (Kim et al 2005). One of the constructs that influence this variable is the existence of previous experience in the use of a certain technology (Venkatesh et al 2012). Kim et al (2005) concluded that the past use of a particular technology will influence the adoption of that technology.
Venkatesh et al. (2012) conceptualize that habit, influenced by the experience of use, influences not only behavior intention as well as use behavior. For our investigation, we will consider the effect of habit, without the influence of moderators, on both behavioral intention and use behavior.
H8 – Habit has a significant and positive impact on behavioral intentions regarding
the adoption of smart speakers;
H9 – Habit has a significant and positive impact on use behavior regarding the
adoption of smart speakers;
Behavioral Intention is the construct that is proposed to be influenced by the performance expectancy, effort expectancy, social influence, facilitating conditions, hedonic motivations, price value and habit (Venkatesh et al. 2012). Following on Sheppard et al. (1988) research, behavioral intention is formed by all the factors that the decision-maker considers influencing his behavior, at the time of the decision.
21 Consistent with the theories of all models presented in the literature review, Venkatesh et al. (2003) proposed that behavioral intention would have a significant and positive impact on use behavior.
For the purpose of our research, we will follow on Venkatesh et al. (2012) research and also purpose that this construct will have a significant and positive impact on use behavior.
H10 – Behaviour intention has a significant and positive impact on use behavior
22 3. Research Methodology
For this research, we made a quantitative analysis with primary data collection, so that we could evaluate the validity of the proposed hypotheses.
After conducting a literature review of models evaluating the adoption of new technologies, we adapted the questionnaire developed by Venkatesh et al. (2012) for the acceptance of smart speakers in Portugal.
Since the goal of this research is to evaluate the Portuguese population intention to use smart speakers, after adapting the original questionnaire to the theme of this research, it was translated to Portuguese and afterward translated back to English by a professional translator, to guarantee the validity of the same. The measurement items (the scales of each construct) were adopted and adapted from the Venkatesh et al. (2012) questionnaire. Table 1 shows the items used by the author, and the respective scale used.
Table 1 - Adaptation of Venkatesh et al. (2012) survey
Variable Original Question Adaption to the Research Scale
PE 1 I find mobile Internet useful in my daily life
I think a Smart Speaker could be
useful in my daily life 7 Likert-Scale
PE 2
Using mobile Internet increases my chances of achieving things that are
important to me
I think using a Smart Speaker would increase my chances of
achieving personal goals
7 Likert-Scale
PE 3 Using mobile Internet helps me accomplish things more quickly
Using a Smart Speaker would help
me complete my tasks faster 7 Likert-Scale PE 4 Using mobile Internet increases my
productivity
Using a Smart Speaker would
increase my productivity 7 Likert-Scale EE 1 Learning how to use mobile Internet
is easy for me
Learning to use a Smart Speaker
seems easy to me 7 Likert-Scale EE 2 My interaction with mobile Internet
is clear and understandable
Interacting with a Smart Speaker
would be easy and understandable 7 Likert-Scale EE 3 I find mobile Internet easy to use I think using a smart speaker would
be easy 7 Likert-Scale
EE 4 It is easy for me to become skillful at using mobile Internet
I find it easy to become good at
using a Smart Speaker 7 Likert-Scale
SI 1
People who are important to me think that I should use mobile
Internet
People important to me think I
should use a Smart Speaker 7 Likert-Scale
SI 2
People who influence my behavior think that I should use mobile
Internet
People who influence my behavior
23 SI 3 People whose opinions that I value
prefer that I use mobile Internet
People whose opinion I value think
I should use a Smart Speaker 7 Likert-Scale FC 1 I have the resources necessary to
use mobile Internet - 7 Likert-Scale
FC 2 I have the knowledge necessary to use mobile Internet
I have the knowledge to use a
Smart Speaker 7 Likert-Scale FC 3 Mobile Internet is compatible with
other technologies I use
A Smart Speaker is compatible
with other technologies I use 7 Likert-Scale
FC 4
I can get help from others when I have difficulties using mobile
Internet
I can get help from others when I
have trouble using a Smart Speaker 7 Likert-Scale HM 1 Using mobile Internet is fun Using a smart speaker would be
funny 7 Likert-Scale
HM 2 Using mobile Internet is enjoyable Using a Smart Speaker would be
enjoyable 7 Likert-Scale
HM 3 Using mobile Internet is very entertaining
Using a Smart Speaker would be a
lot of fun 7 Likert-Scale PV 1 Mobile Internet is reasonably priced The price of a smart speaker is
reasonable 7 Likert-Scale
PV 2 Mobile Internet is a good value for the money
A smart speaker is a good value for
the money 7 Likert-Scale
PV 3 At the current price, mobile Internet provides a good value
At the current price, a Smart
Speaker is at fair value 7 Likert-Scale HT 1 The use of mobile Internet has
become a habit for me
Using a Smart Speaker would
become a habit for me. 7 Likert-Scale HT 2 I am addicted to using mobile
Internet
Using a Smart Speaker would get
me addicted 7 Likert-Scale HT 3 I must use mobile Internet I must use a Smart Speaker 7 Likert-Scale HT 4 Using mobile Internet has become
natural to me
Using a Smart Speaker would be
natural for me 7 Likert-Scale BI 1 I intend to continue using mobile
Internet in the future I intend to use a Smart Speaker 7 Likert-Scale BI 2 I will always try to use mobile
Internet in my daily life
I would always try to use a Smart
Speaker in my daily life 7 Likert-Scale BI 3 I plan to continue to use mobile
Internet frequently
I intend to use a Smart Speaker
often 7 Likert-Scale
UB Please choose your usage frequency for each of the following
Please choose your usage
frequency for each of the following 7 Likert-Scale
UB 1 SMS Interact with other smart objects 7 Likert-Scale
UB 2 MMS SMS sending by voice 7 Likert-Scale
UB 3 Ringtone and logo download Searching for information online by
voice 7 Likert-Scale
UB 4 Java games - 7 Likert-Scale
UB 5 Browse websites - 7 Likert-Scale
24 Differently from what Venkatesh et al. (2012) have done, that evaluated the user’s perception at two different stages to verify the influence of experience, we only asked the respondents once. Since in this study we will not address the influence of experience on technology adoption, this issue was merely a descriptive analysis of the sample.
The scales to measure performance expectancy, effort expectancy, social influence, facilitating conditions and behavioral intention had already been used by Venkatesh et al. (2003). Venkatesh et al. (2012) withdrawn the habit scale from Limayem and Hirt (2003), the scale to measure hedonic motivation was adapted from Kim et al. (2005) and the price value scale was adapted from Dodds et al. (1991).
All the items were measured on a seven-point Likert scale, with the two extreme points being identified as "Strongly Disagree" and "Strongly Agree". The middle point of the scale was identified as a point of indifference for the user "neither disagree nor agree". The exception was the question regarding the user’s experience with smart speakers, whose answers ranged from “Have never used” to “Frequent User”, also on a seven-point Likert Scale.
Taking into consideration the innovative nature of the product under research, in the introduction of the questionnaire, a mood board was presented describing the product and its features, see Appendix A – slide 2.
The questionnaire was uploaded to the web and communicated through the web hosting service Qualtrix Survey Software. Respondents could access the survey by clicking on a URL provided in the message delivered by e-mail or social media. To engage with the participants, social media and e-mails had a brief explanation regarding the purpose of the questionnaire.
Before launching the questionnaire, an initial validation was done. For that validation, five people answered the questionnaire and provided insights on the same. With those insights, items PE 2, PE 3, EE 4 and HT 2 were slightly adapted, so they would be easier to comprehend.
Appendix A shows the questionnaire translation and presentation, as all the participants saw it. Appendix B provides evidence on all the descriptive statistics.
25 4. Results
The survey has received a total amount of 253 responses, with 190 being valid.
The following figures describe the demographic statistics of the questionnaire:
42,60% 57,40% Gender Male Female 0,50% 41,10% 21,60% 7,40% 15,30% 13,20% 1,10% 0,00% 0% 0,00% 5,00% 10,00% 15,00% 20,00% 25,00% 30,00% 35,00% 40,00% 45,00% <18 18-24 25-34 35-44 45-54 55-64 65-74 75-84 85< Age Range Figure 3 - Gender Distribution
26 0,50% 15,30% 44,70% 16,30% 22,10% 1,10% Scholarship 12,60% 16,80% 68,40% 1,10% 1,10% Student Working Student
Worker Unemployed Retired
Professional Occupancy
58,95%
6,84% 3,68%
21,05%
3,16% 2,63% 3,68%
Never Used Ocassionally used Use Oftenly
Experience with Smart Speaker Figure 6 - Scholarship
Figure 5 - Professional Occupancy
27 As shown above, our sample consists of a mostly male audience, with a ratio of approximately 57% men to 43% women.
41.1% of our sample is aged between 18 and 24 years old, and the second most represented age group is between 25 and 34 years old. The third-largest age group is 45 to 54 years old.
Regarding education, 44.7% of the sample has a Bachelor's degree or equivalent, and the second group of Masters is people with masters who represent 22.1% of the sample.
The vast majority of the sample (68.4%) are full-time workers, and the second most prominent group are working students (16.8%).
Looking at the experience of using smart speakers, the vast majority of the sample has never used one (58.95%), with only 3.68% of the sample saying they use it frequently.
4.1 Procedure for data analysis
Following on Venkatesh et al. (2012) research, since we have a large number of interaction terms, instead of applying multiple linear regression, we will use a Partial Least Squares (PLS) model to analyse our sample. In order to perform the PLS test, we used the Smart PLS 3.0 software.
First, after withdrawing our database from the web hosting service, we ran it through IBM SPSS. On SPSS we first started to clean from the database all the incomplete answers to the survey. Smart PLS 3.0 program wouldn’t work with missing values, so this was a preliminary requirement to run this program.
Since we were already using the SPSS software to analyse our database, we also performed the descriptive analysis shown above, using the Descriptive statistics tool. Afterward, on the Smart PLS 3.0 software, we uploaded the database without missing values.
28 On the Smart PLS 3.0, we built the frame of reference. This frame of reference, as we have seen before, is an adaptation of the unified theory of acceptance and use of technology 2, from which we took away the moderative variables. Following on Venkatesh et al. (2003) paper, all constructs were modeled using reflective variables, except for use, that was modeled as formative. Our frame of reference looks like the following:
29 4.2 Measurement Model
Due to its complexity, applying the PLS algorithm requires from the researcher, an extensive model evaluation to guarantee the extent to which a specified model is appropriate to describe the effects between the constructs under analysis (Götz O. et al. 2010).
First, we need to test the items reliability. Following on Götz O. et al. (2010), the reliability measure will provide the answer to the internal consistency between all the belonging items. To measure reliability, we need to access that the indicators: Item Loading, Cronbach’s alpha, and Composite Reliability; fulfill the requirements of meaningfulness.
Following on Henseler et al. (2009) book, Loadings must be greater than 0.7, to indicate that the construct explains at least 50% of the variable variance, but a more moderative accepts values above 0,6.
30 As can be seen from Table 1, Loading from HT 3 is below the threshold of 0.6 and so the item “I must use a smart speaker” was cut off. After cutting off this variable, we ran the PLS algorithm again and all the variables had a Loading over 0.6, meaning that they would explain at least 50% of the construct variance (Henseler et al., 2009).
Hair et al. (2010), explains that Composite Reliability is an evaluation of the internal consistency and reliability of each construct as well as the extent to which the items represent the underlying constructs. Regarding Cronbach’s alpha, it will provide an estimate for reliability considering the indicators intercorrelations assuming that all the indicators are equally reliable (Henseler et al., 2009).
Table 2 shows the results for Cronbach’s alpha (CA) and Composite Reliability for the constructs that remain valid. For both indicators, all the constructs are above 0.7 which shows evidence of internal consistency, according to Henseler et al. (2009) – Facilitating condition shows a Cronbach’s alpha of 0.65 which is approximately 0.7 and we will accept it. Since Use Behaviour uses formative indicators, there are no values for average variance explained (AVE), CA and CR since the items don’t have to be correlated (Götz O. et al. 2010).
AVE assures the validity of the variables (Paulo M., 2015). Following again on Henseler et al. (2009), values from AVE must be above 0,5, meaning that the latent variable is explanatory of more than half of the indicator’s variance. For the results presented in Table 2, we can confirm that this assumption is fulfilled.
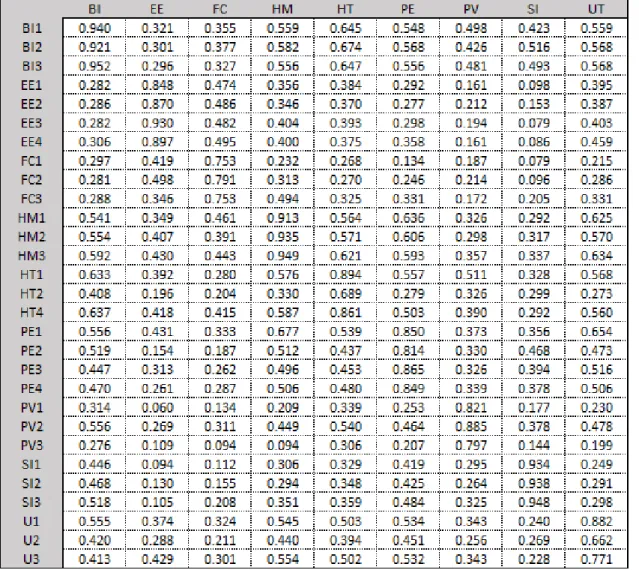
To evaluate the discriminant validity of the variables, we will use the Fornell-Larker criteria and verify if the cross-loadings. Fornell-Fornell-Larker criteria theorize that the
31 square root of AVE must be greater than the correlations between constructs (Henseler et al.,2009). The second criteria require that the cross-loadings must be inferior to the construct loading (Chin 1998). Tables 4 and 5 provide the evidence and confirmation of these two criteria.
Table 4 - Discriminant Validity - Fornell-Larker
32 4.3 Structural Model
Chin (1998) examined the goodness of fit indices. As the author states, a good fit of the model is not meaningful of a good quality of R-square or factor loadings, since the fit measures only relate to how well the parameters estimates match the sample covariances, not relating to how well the latent variables are predicted. Since we are following a model that has already been tested and verified on other thematizes, we could believe that the R-square will be meaningful (above 0.2 at least and ideally above 0.3, Chin (1998)).
Table 6 shows that the R-square of Behaviour Intention is 0.616 and Use Behaviour is 0.436, values that are above the ideal value enunciated by Chin (1998).
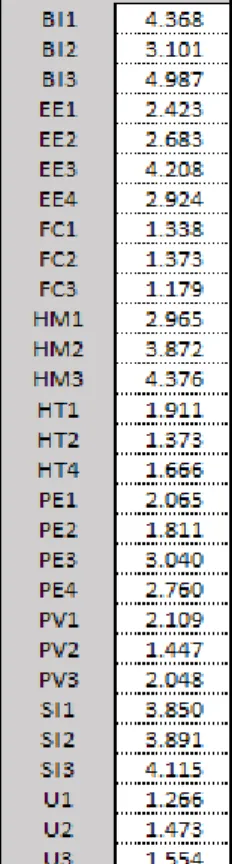
Multicollinearity among variables could also show to be a problem to this model, since it would produce undesirable outputs, and would destabilize the construct, Petter S.
Table 6 - R-Square of Behaviour Intention
33 et al. (2007). Venkatesh et al. (2012), used 5 as the conservative threshold, which suggests that multicollinearity won’t be a problem.
As it is presented in Table 4, any VIF value is above the threshold of 5. Even though, BI 3 shows a very close value, according to Venkatesh et al. (2012) we can accept the value, accepting that multicollinearity won’t have an impact on the analysis.
4.4 Path Coefficient Significance
In order to access the significance of our regression weights, we ran a Consistent PLS Bootstrapping analysis on our model. This will provide us, the T-values for significance testing of the structural path of our model, Wong K. (2013).
By using the Bootstrapping, with a two-tailed t-test of significance level of 5%, the path coefficient will only be considered significant, if the T-value is larger than 1.96 (Wong K. 2013).
Table 5 presents the outputs obtained from this procedure. The results show that the paths between Effort Expectancy and Behaviour Intention, Facilitating Conditions and Behaviour Intention, Facilitating Conditions and Use, and Performance Expectancy and Behaviour Intention are not significant enough. The rest of the paths were considered significant with a T-Value over 1.96 at a significance level of 5%.
34 4.5 Hypothesis Validity
Having obtained the path coefficient significance in the previous chapter, we are now able to evaluate if the hypothesis that were formulated were supported by the analysis. Table 9 shows the final conclusions of each hypothesis.
The first hypothesis proposed that performance expectancy would have a significant and positive impact on behavioral intention. With a t-statistic of 1.724, which bellows the threshold of 1.96, performance expectancy was found to be non-significant.
The second hypothesis proposed that effort expectancy would have a significant and positive impact on behavior intention. The t-statistic of this path was found to be below the threshold of 1.96 which led to the same conclusion as in the first hypothesis: effort expectancy is not significant enough.
The third hypothesis proposed that social influence would have a significant and positive impact on behavioral intention. This path had a t-statistic above the 1.96 and a p-value below 0.05. This means that social influence has a significant impact on behavioral intention, there forth the hypothesis is supported.
The fourth and fifth hypothesis proposed that facilitating conditions would have a significant and positive impact on behavioral intention and use behavior. These paths had t-statistics values of 1.166 and 1.834, below the 1.96 marks. This means that facilitating conditions do not have a significant impact either on behavior intention neither on use behavior and there forth our hypothess are both rejected.
The sixth hypothesis proposed that hedonic motivations would have a significant and positive impact on behavioral intention. This path had a t-statistic above the 1.96 and a p-value below 0.05. This means that hedonic motivation has a significant impact on behavioral intention, there forth the hypothesis is supported.
Hypothesis number seven proposed that price value would have a significant and positive impact on behavioral intentions. The path showed a t-statistics of 2.019, above the 1.96 thresholds, and a p-value of 0.044, below the 0.05. This means that price value has a significant impact on behavioral intention, there forth the hypothesis is supported.
Hypothesis eight and nine proposed that habit would have a significant and positive impact on both behavioral intention and use behavior. These paths had t-statistics