Evaluation of the effect of hearing aids
using electroencephalographic analysis
2Isabel Marques Rosa
(
[email protected]
), IET/CESNova, Faculty of
Sciences and Technology, Universidade Nova de Lisboa
Abstract
We wonder how it is possible to use the Electroencephalogram (EEG) as a TA instrument, rather than a diagnosis procedure, to evaluate how children hear the sounds. The first concern was related to the definition of concepts, namely the primary and secondary objectives, the importance of the study, the materials and equipment, the procedures, the criteria for inclusion and exclusion and the expected outcomes. We present the main research questions, the proposed methodology and report the first steps of the practical work, some results and a few considerations about the thesis next development.
Key-words: Electroencephalogram; brain activity; children; hearing; hearing impairment; EEG signal analysis; Technology assessment; Health
JEL codes: I18, M15, O33
Introduction
Hearing is one of the main sensory systems involved in the development of each one, with a major importance in the construction of the social and behavioral relationships, in the learning capacity and on the knowledge acquisition.
People hear just when the sound is processed on the brain, after a sequence of several physiologic and neurologic events, from the air
2 The present article is based on the report for the Doctoral Conference of the PhD programme in Technology Assessment, held at FCT-UNL Campus, Monte de Caparica, July 2013. The PhD thesis has the supervision of Dr. Salomé Almeida(Central Hospital of Lisbon), and
movements around the ear through the transformation on an electrical impulse on the inner hear, that will finally reach the auditory brain cortex. This makes hearing one of the brain activities.
There are several methods to measure brain activity, such as Positron Emission Tomography (PET), Functional Magnetic Resonance (fMRI), EEG, used in neurology for both, diagnosis and neurological research. We have selected the EEG as the method for determining which brain areas appear associated with a certain type of stimuli, because it uses a technology that doesn’t interfere with the hearing aids (the hearing aids cannot be used during the fMRI, or similar technologies running), even considering that EEG has a large temporal resolution but a lower spatial resolution.
The EEG applications are mainly associated with unravel the mysteries of development and learning, recognition of emotions (affective computing), and neuro-feedback, NF (which is the basis for “brain-computer interface”). Looking closer to the developmental and learning studies, EEG registry is intended to identify brain areas involved on several thinking or behavioral processes. For example, hearing words while reading or viewing photos:
Could the observed differences in brain activity be caused by deficiency?
Or are differences in brain activity when children with language disorders hear words and when children with autism see faces? In this knowledge area, EEG could also be useful to identify which are the effective therapeutic methods (e.g. language training, program reading) and eventually predict which children most likely benefit from a specific treatment.
For the recognition of emotions, EEG is intended to identify the electrical brain activity that occurs when the subject is in a particular emotional state, like in the classification of emotions based on signals from the electrodes, where it can be used in two dimensions to characterize the affective experiences in the field of emotions: “Arousal” – calm/excited, “Valence” – very positive/very negative. According to Danny Oude Bos (2006) from the University of Twente, in her studies about EEG-based emotions recognition in the course of the influence of visual and auditory stimuli, making the computer more empathetic to the user is one of the aspects of “affective computing”, where using the "EEG-based emotion recognition", let the computer to take a look inside the brain of users and observe their mental states.
For the NF, EEG is used to visualize the brain and their reactions to different stimuli or tasks; in that way, to diagnose abnormalities within the brain, NF could be used as a mirror for reflection and thus to self-potentiating. Works with NF in brain peripheral areas associated to a disturbance could allow the subject to train himself to relieve symptoms. The NF approach can even uses the EEG as a source of information, to view the symptom (but not the underlying cause of a problem) and modify it.
a noninvasive procedure, relatively easy to use, economic and allowing, through a set of electrodes placed on the scalp, in our cases the registration of the electrical activity of the brain caused by nerve impulse conduction.
In this study we are seeking to determine whether the EEG is a tool to assess what each one can hear. The project was, then, constructed around children carrying hearing aids, whose caregivers have agreed to being analyzed for EEG while submitted to an auditory stimulus. For this propose, the control group were the same children, where the EEG signal is compared with itself when the hearing aids are on and off.
Methodology
At this phase of the thesis 3, three main steps were considered:
The working protocol design, defining the sample in study, the healthcare environment, the team constitution, and the methodology for data collection and analysis;
The involvement of the multidisciplinary team, including healthcare professionals from different areas (Otolaryngology, Neurology/Neurophysiology and Audiology, Engineers from UNINOVA/ Department of Electronic Engineering (DEE) and Informatics programmers for the EEG signal decomposition), in the sample selection and study.
The involvement of the patients and their parents that participate on this research study, without any retribution.
For each included child, the clinical story was analyzed in advance, in order to understand the presence of other parameters that could interfere with the results, and to characterize the hearing loss. This step was performed in coordination with a multidisciplinary team, involving healthcare professionals from different areas – Otolaryngology, Neurology and Audiology.
Together with the UNINOVA/DEE, we asked the cooperation of a student of Biomedical to assist in the conversion of the traces of the EEG signals so that it can be analyzed in MATLAB.
MATLAB is an interactive software for the numerical calculation that allows
3 This article had the contributions from António Brandão Moniz, coordinator of Doctoral Programme on Technology Assessment (FCT-UNL), Salomé de Almeida, thesis supervisor (Centro Hospitalar de Lisboa Central, EPE), and Manuel Ortigueira, co-supervisor (FCT-UNL). All of them have contributed with discussions, development and revision of this article.
the numerical analysis, matrix calculation, the signal processing and graphing. It’s an easy to use program that allows to, simply, complicated mathematical calculations. Furthermore, it allows the resolution of many numerical in a short fraction of time relative to the time it would spend to write a similar program in another language problems. EEGLAB is a box of MATLAB tools for interactive processing of EEG signals and other electrophysiological data, allowing among other analysis time/frequency. Regarding to the EEG signals analysis, it was important to hear from some national and international researchers to decide about the best software to use. MATLAB and EEGLAB was recommended once is one of the most powerful means made available for all, engineer or scientist, since it is an “easy to use” program that allows people to simplify, complex mathematical calculations. According to Ortigueira (2007, 2008) the MATLAB is a good software to be used to program some algorithms for EEG signal analysis. In order to analyze mathematically the signals obtained in EEG tracings, the first step was to convert it into EDF files, enabling the EEGLAB to notice the channels corresponding to the signs. After it will be developed an algorithm for treatment of EDF files, separating the signal according to the notes relating to the listening of several stretches of sound stimulus, which finally will allow the analysis in MATLAB. So afforded all parties intended to analyze with and without hearing aids: stories, songs and words
The sound stimulus (audio track, prepared by the author of the study and its co advisor), was created specifically for the children interval of expected ages and includes stories, songs, sequences of words and white noise. Each child will be submitted twice to this stimulus, first with the hearing aids on and after with the hearing aids off. If possible, children without hearing impairment will be included also.
For each participant it was prepared the informed consent for clinical research and in particular for this study, according to the ethical rules from the involved hospital. The examination was performed with a MICROMED apparatus, with a video registration system of 32 EEG channels. This was the apparatus in use by the Neurology Service for the realization of the EEG in the institution where we collected the sample. We used 16 channels (the helmet uses 20 electrodes with different increases, placed according to the 10-20 system, bipolar and single pole).
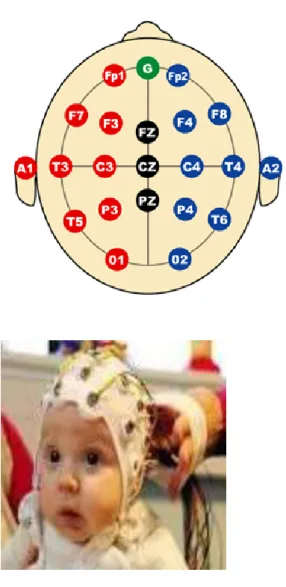
The International 10-20 System of Electrode Placement is the most widely used method to describe the placement of electrodes at specific intervals along the head depending on the geometric proportions of the skull, which is divided into sections of 10 and 20 percent. The position of each electrode is named by a letter to identify the lobe, along with a number or another letter to identify the hemispheric location of the cortex on top of which they are placed: the letter P refers to the parietal, F to the front, T for temporal, C as the control unit (reference electrode), O for occipital, A to the headset, and Z refers to an electrode placed on the mid-line; red and blue colors refers to the left and right side, respectively (Malmivuo & Plonsey, 1995). Each test took on average 45 minutes.
Figure 1 – Position of the electrodes in the International System Installation 10-20.
Figure 2 – Child with helmet prepared to perform EEG.
The temporal lobe encompasses for the left and right areas over and around the ears; these regions main functions are hearing, memorize words and its meaning, and the language construction. There is a partial overlap of these functions with the frontal and parietal lobes, making the temporal electrodes - T3/T4/T5/T6 – the electrodes "more connected" to the auditory region.
Results and discussion
The first examination was held in March 2012. Each child was submitted twice to the sound stimulus, first with the hearing aids on and after with the hearing aids off. The EEG equipment produced several files which signals were converted in a compatible format to be analyzed with the MATLAB software.
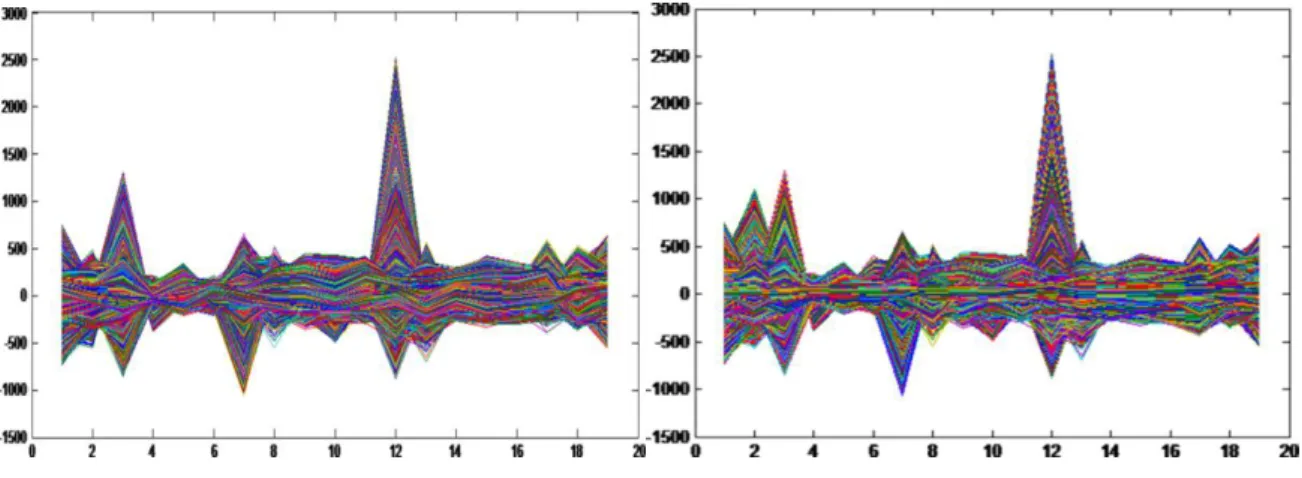
Once the MATLAB was installed, we have performed the signal analysis concerning to the EEG from a child with hearing impairment, submitted to the previous prepared auditory stimulus. The first approach was the generation of a general spectrogram for both situations, with the hearing aids on and off (figure 3).
Figure 3 – General spectrogram produced with MATLAB analysis of the EEG signal. Left image correspond to the child with hearing aids on, and the right
image, with the hearing aids off.
The general spectrogram produced with MATLAB analysis of the EEG signal, express the brain activity when the patient was submitted to a sound stimulus, considering the timeline X axis, in minutes and signal amplitude, Y axis. The graph variations are related to different parts of the sound stimulus (music, histories, words and white noise). The spectrogram lines reflect the brain energy produced in response to the sound stimulus. The resulting spectrograms were not conclusive, concerning to the hearing capacity, but presented already several variations in the brain energy observed, by the colors variations on the EEG signal registry when the hearing aids were on or off. Anyway, it was then possible to define the next steps that must include some way to decompose such a complex signal, in order to understand the spectrograms differences, to correlate the brain response with the sound stimulus.
stimulation through a defined sequence of sounds could be used to evaluate if the brain is hearing or not, and how the sound is being processed. Considering the hearing impaired children, two situations could occur:
There are no differences in the signal with and without the hearing aids;
There are differences in the signal with and without hearing aids and the EEG signal analysis could be used as an indicator of hearing.
In the second situation, it is also interesting to understand when the EEG can be an instrument to evaluate the “hearing quality”, in order to find the differences between listen, understanding and processing correctly the sound. If yes, the EEG will have a potential to validate and certify the use of hearing aids, and to become of routine use since it is noninvasive, economical and easy to use.
Finally we would like to remind that this study is based on children with a hearing disability, thinking that it might contribute to the development of essential factors to improve quality of life, as the development of the language, the cognitive and the social skills.
All the participants, or their legal tutors, have signed the informed consent and kindly agreed with the proposed methodology and allowed the data analysis, with the guarantee of total confidentiality and privacy. This study was developed with the necessary authorizations from the Healthcare Institution and its ethical committee.
Next steps
This study was based on a 6 month period (Dec 2011 to Jan 2012) research. In that period it was possible to perform the main data collection. The next steps will be directed to the EEG signals interpretation. For the analysis of EEG signals it will be necessary to develop algorithms which allow the signal decomposition to identify the resulting variations, and be able to associate them with brain areas involved in the hearing process. For this task it was established contacts with national DEE, and international experts in order to understand the feasibility of analysis of EEG signals thereby. The first approach suggested was to convert the EEG signals and then use the MATLAB resources, which allow the signal analysis electrode by electrode. The analysis will be done in several domains:
a) Global statistics – mean, standard deviation, median and histogram;
b) Temporal analysis – power variation;
c) Spectrum;
d) Time-frequency analysis.
It will be required the collaboration of electrical engineers with experience on Signal Processing and MATLAB (contacts will be made), in order to adapt the functions suggested by the co-supervisor, so the analysis and processing of the data would be the most appropriate and simple to perform.
At an early stage, the analysis should run the two programs together (time and frequency) for all whole signals, considering both situations, with and without hearing aids. Notes should be taken of the differences that are encountered, in the values of spectrum peaks, the amplitudes and frequencies and everything that looks interesting to be eventually correlated to the brain activity, with and without hearing aids.
This analysis should be done for all electrodes, as a whole, and one by one, in order to observe the variations occurrence with the hearing aids on and off, and to understand which channels could be important for the sound processing.
References
Almeida, S. de (2007). Os Genes da Surdez. In Apresentação no Serviço Genética Médica do
Hospital D. Estefânia. Lisboa: Hospital D. Estefânia.
ANSI-S3.6. (1969). Specifications for audiometers. New York: American National Standards Institute.
António, S., & Strasnick, B. (2011). Genetic Sensorineural Hearing Loss. Medscape. Acedido em 30 de Março de 2011, de http://emedicine.medscape.com/article/855875-overview Barbosa de Carvalho, J. F. (2007). Estudo de um Instrumento de Engenharia Biomédica.
Audiometria de Tronco Encefálico (ABR). (Dissertação de Mestrado). Faculdade de
Engenharia da Universidade do Porto, Portugal.
Bos, D. O. (2006). EEG-based Emotion Recognition - The Influence of Visual and Auditory Stimuli. Emotion, 57(7), pp. 1798-1806.
Centro de Genética Clínica. (2012). Diagnóstico Molecular de Surdez Congénita (Sindrómica e
Não Sindrómica). CGC Genetics. Acedido em 15 Julho de 2012, de
http://www.cgcgenetics.com/cgc/pt/main/analises/brochuras/Profissionais-de-Saude/Paineis-de-Mut-CGC.html
genes. BMC Genetics, 11, pp 68.
Choo, D., & Meinzen-Derr, J. (2010). Newborn Hearing Screening in 2010. Current Opinion in
Otolaryngology & Head and Neck Surgery, 18(5), pp. 399-404.
Gomes, A. (2008). Estudo da Microestrutura do Sono em Surdos: estudo descritivo da
microestrutura do sono em surdos vs casos controlo de indivíduos sem défice auditivo
(Dissertação de Mestrado). Faculdade de Medicina da Universidade de Lisboa, Portugal. Grandori, F., & Lutman, M. (1999). The European Consensus Development Conference on
Neonatal Hearing Screening (Milan, May 15–16, 1998). American Journal of Audiology,
8, pp. 19-20.
Grupo de Rastreio e Intervenção da Surdez Infantil - GRISI. (Setembro-Outubro 2007). Recomandações para o Rastreio Auditivo Neonatal Universal (RANU). Acta Pediátrica
Portuguesa, 38(5), pp. 209-214.
Guix, E. (2007). Molecular basis of deafness linked to mitochondrial DNA mutations. Barcelona: Universitat Pompeu Fabra.
Hilgert, N., Smith, R., & Van Camp, G. (2009a). Forty-six genes causing nonsyndromic hearing impairment: Which ones should be analyzed in DNA diagnostics? Mutation Research,
681, pp. 189-196.
Hilgert, N., Smith, R., & Van Camp, G. (2009b). Function and expression pattern of nonsyndromic deafness genes. Current Molecular Medicine, 9(5), pp. 546-564.
International Organization for Standardization - ISO. (1996). Acoustics - Reference zero for the calibration of audiometric equipment - Part 7: Reference threshold of hearing under free-field and diffuse-field listening conditions. Geneve.
Joint Committee on Infant Hearing. (2000). Position Statement. Principles and Guidelines for early detection and intervention programs. American Journal of Audiology, 9(1), pp. 9-29.
Lee, P., & Su, H. (2011). Quantitative mapping of scientific research - The case of electrical conducting polymer nanocomposite. Technological Forecasting and Social Change, 78, pp. 132-151.
Malmivuo, J. & Plonsey, R. (1995). Bioelectromagnetism: Principles and Applications of Biolelectric and Biomagnetic Fields. New York: Oxford University Press.
Rosa, I. M. (2002). Comportamento do Limiar Diferencial de Intensidade da Dinâmica Auditiva
na Surdez Neurossensorial. Dissertação de Mestrado, Faculdade de Ciências Médicas.
Universidade Nova de Lisboa.
McCandless, G. A. (1994). Overview and rationale of threshold-based hearing aid selection procedures. In M. Valente, Strategies for Selecting and Verifying Hearing Aid Fittings (pp. 1-18). New York: Thieme.
Monteiro, L. (2010). Grupo de Rastreio e Intervenção na Surdez Infantil. Otorrinolaringologia e
Cirurgia Cérvico-Facial, 48(4), p. 230.
Ortigueira, M. D. (2005). Processamento Digital de Sinais. Lisboa: Fundação Calouste Gulbenkian.
Senhora do Rosário, EPE - Barreiro, 29, 12.
Ruah, S. A., & Ruah, C. B. (1998). Manual de Otorrinolaringologia (Vol. II). Lisboa: Roche Farmacêutica Química, Lda.
Street, V., Kallman, J. S., Bramhall, N., & Phillips, J. (2008). Vestibular function in families with inherited autosomal dominant hearing loss. Journal of vestibular research:equilibrium &
orientation, 18(1), pp. 51-58.
Su, H., & Lee, P. (2010). Mapping knowledge structure by keyword co-occurrence: a first look at journal papers in Technology Foresight. Scientometrics, 85(1), pp. 65-79.
Task Force on Newborn and Infant Hearing. (1999).American Academy of Pediatrics, 103, pp. 527-530.
Trinidad-Ramos, G., Aguilar, V. A., Jaudenes-Casaubón, C., & Núñez-Batalla, F. (2009). Recomendaciones de la Comisión para la Detección Precoz de la Hipoacusia (CODEPEH) para 2010. Acta Otorrinolaringológica Española, 61(1), pp. 69-77.
Tye-Murray, N. (1998). Foundations of Aural Rehabilitation: Children, Adults, and Their Family
Members. San Diego: Singular Publishing Group Inc.
Wu, F., Hsu, C., Lee, P., & Su, H. (2011). A systematic approach for integrated trend analysis—The case of etching. Technological Forecasting and Social Change,