Balanced Scorecard: empirical study on small and medium size enterprises
20
0
0
Texto
(2) Maria João Cardoso Vieira Machado. RESUMEN La teoría defiende el Balanced Scorecard como un método de evaluación del desempeño, respecto al uso de medidas exclusivamente financieras. El presente estudio tiene como objetivo examinar las tasas de utilización y divulgación de conocimientos acerca del Balanced Scorecard en pequeñas y medianas empresas industriales portuguesas (PYME), analizando la existencia de factores que expliquen por qué el método no es conocido en todas las empresas. Fueron entrevistados los contables de 58 empresas industriales, ubicadas en once localidades portuguesas. El resultado indica que muy pocas empresas utilizan el Balanced Scorecard y que la mayoría de los responsables encuestados no lo conocían. La búsqueda de factores explicativos muestra que el conocimiento de este método está asociado a las características individuales de los responsables de la contabilidad de gestión, tales como el nivel educativo y la edad, así como las características de tamaño de la propia empresa. Palabras clave: Evaluación desempeño. PYME. Portugal.. 1 INTRODUCTION Researchers are also concerned to study whether enterprises use the performance evaluation methods considered by the theory as the most adequate – those that simultaneously include financial and non-financial measures, namely the Balanced Scorecard (ALBRIGHT et al., 2010; BANKER; CHANG; PIZZINI, 2004; BUTLER; HENDERSON; RAINBORN, 2011; CARDINAELS; VEEN-DIRKS, 2010; COKINS, 2010; CRABTREE; DEBUSK, 2008; DAVIS; ALBRIGHT, 2004; DILLA; STEINBART, 2005; HERATH; BREMSER; BIRNBERG, 2010; KAPLAN; WISNER, 2009; KRAUS; LIND, 2010; LIBBY; SALTERIO; WEBB, 2004; LIEDTKA; CHURCH; RAY, 2008; MCPHAIL; HERINGTON; GUILDING, 2008; NEUMANN; ROBERTS; CAUVIN, 2010; NORTHCOTT; SMITH, 2011; ROBERTS;. ALBRIGHT; HIBBETS, 2004; SUNDIN; GRANLUND; BROWN, 2010; TAYLER, 2010; VILA; COSTA; ROVIRA, 2010; WIERSMA, 2009; WONG-ON-WING et al., 2007). Dearman and Shields (2001) mention that, even when using other methods theoretically considered as inadequate, correct management decisions can be made as long as managers are aware of the more adequate methods. These authors’ conclusions make it important to study not only the Balanced Scorecard usage rate, but also the transmission of knowledge about it to those in charge of management accounting. The contingency theory is based on the premise that there is no ideal accounting system that can be applied in the same way in every organization. It all depends on several contingency factors (OTLEY, 1980). Researchers are also interested in studying the contingency variables responsible for the transmission of knowledge about management accounting methods (ABDEL-KADER; LUTHER, 2008; BYRNE; PIERCE, 2007; CADEZ; GUILDING, 2008; CHEN, 2008; GERDIN; GREVE, 2008; HENRI, 2010; HOPPER; EFFERIN, 2007; QIAN; BURRITT; MONROE, 2011; WIDENER, 2004; WOODS, 2009). The three factors previously mentioned give relevance to the performance of this study on the use and knowledge of the BSC, as well as the contingency variables responsible for making it known to Portuguese companies; since the financing problems currently existing in Portugal demand greater management ability by companies and, consequently, the use of more suitable management accounting methods. Management accounting practices in organizations are very little disclosed in Portugal, given the optional nature of this type of accounting. This justifies the performance of empirical studies in this country as a contribution to the contingency theory, because this theory recognizes that cultural differences between countries are a differentiating factor on the management accounting methods used (Y A N G ; Y A N G ; WEI-PANG, 2006; MACARTHUR, 2006).. 130 Rev. bus. manag., São Paulo, Vol. 15, No. 46, pp. 129-148, jan./mar. 2013.
(3) Balanced Scorecard: an empirical study of small and medium size enterprises. The objective of this paper is to increase knowledge regarding the presentation of the Balanced Scorecard (BSC) in small and medium sized Portuguese industrial enterprises (SMEs). Other more specific objectives are as follows: to analyze this method’s usage and knowledge spreading rates; to identify contingency variables for the fact that the BSC is known in some companies and not in others. The empirical studies already performed, reporting BSC usage rates, do not focus on small and medium sized enterprises, which justifies conducting a new study on this type of company. SMEs have an important role in Portuguese corporate fabric. A study performed (INSTITUTO DE APOIO ÀS PEQUENAS E MÉDIAS EMPRESAS E AO INVESTIMENTO - IAPMEI, 2008) mentions that 99.6% of national enterprises are of small and/or medium size. This gives even greater relevance to the study of this type of enterprise when describing the country’s situation. However, the high number of SMEs in Portugal – 297,000 enterprises (IAPMEI, 2008) – has made us limit our study to enterprises classified as industry-excellence, since they represent a group of companies that were selected using goals aligned with those of this paper; mentioned classification assesses the economic, financial, and management performances of applicant enterprises (IAPMEI, 2002). The universe under analysis is made up of 163 enterprises consistently classified, in this century, as industry-excellence SMEs. Data were gathered through interviews carried out with those in charge of management accounting, because we consider they possess all the information on which we intended to collect evidence. We performed 58 interviews in enterprises located in 11 Portuguese districts, generating a 36% response rate. The non-replies were treated, allowing us to conclude that there are no statistically significant differences between responding enterprises and tnon-responding ones.. 2 LITERATURE REVIEW The first per formance evaluation models were based solely on financial measures (BANKER; MASHRUWALA, 2007; CORONA, 2009; LUFT, 2009; MARTIN; PETTY, 2000). Over time, countless critics to those models appeared, causing the theory to currently give supremacy to performance evaluation models that simultaneously include financial and nonfinancial measures (BANKER; MASHRUWALA, 2007; CORONA, 2009; GEER; TUIJL; RUTTE, 2009). Within this type of models the Balanced Scorecard stands out (BUDDE, 2007; DILLA; STEINBART, 2005; ITTNER; LARCKER; MEYER, 2003; JOHANSON et al., 2006; KAPLAN, 1994; KAPLAN; NORTON, 1992, 1993, 1996a, 1996b, 1996c, 1996d, 2001a; 2001b; KAPLAN; NORTON; BJARNE, 2010; SALTERIO, 2000; PANDEY, 2005; ROBERTS; ALBRIGHT; HIBBETS, 2004). In 1990, the Nolan Norton Institute – KPMG’s research unit – sponsored a study on performance evaluation in the organizations of the future, driven by the perception that the use of exclusively financial measures was obsolete (KAPLAN; NORTON, 1996b). Kaplan (1994) defends that excessive emphasis on assessment measures based on short term financial results may drive enterprises to invest in quick solutions instead of in long term value creation. It can, namely, lead managers to try to maximize short term financial, results harming future clients. The conclusions of the Nolan Norton Institute’s study led to the ellaboration of a new model that became known as Balanced Scorecard (BSC). This method was presented for the first time in 1992 in the Harvard Business Review (KAPLAN; NORTON, 1992), having however suffered subsequent revisions. Within the evolution of the BSC concept, two fundamental moments were identified: firstly, the BSC was presented as a performance evaluation system (KAPLAN, 1994; KAPLAN; NORTON, 1992, 1993); secondly, the BSC was defended as a strategic management system (KAPLAN; NORTON, 1996a, 1996b, 1996c, 1996d).. 131 Rev. bus. manag., São Paulo, Vol. 15, No. 46, pp. 129-148, jan./mar. 2013.
(4) Maria João Cardoso Vieira Machado. Following Nolan Norton’s study (KPMG), the BSC was defined for the first time by its authors as a performance evaluation system possessing a set of measures that supply managers with a global view of the business (KAPLAN; NORTON, 1992). These measures result from the objectives defined in the organization’s strategy, and are grouped according to four major perspectives: financial, clients, internal processes, innovation and learning. In this first stage, the BSC is then described by a set of objectives defined according to the strategy, and a set of execution measures for each of those objectives, organized according to the four perspectives. On a second stage, following the experience of implementing the BSC in several enterprises, Kaplan and Norton (1996a) concluded that managers were not using the BSC only as performance evaluation, but also as a strategic management system. Kaplan and Norton (1996b) presented this new approach and introduced two significant changes: they altered the designation of the last perspective to learning and growth, turning innovation into a component of the internal processes perspective; and they completed the BSC with additional information other than objectives and measures, integrating in it, from then on, a set of goals for established measures, and a set of actions to be developed so that these goals can be met. The BSC’s financial perspective is oriented towards assessing the satisfaction of the stockholders’ objectives, and therefore traditional financial measures continue to be used (KAPLAN; NORTON, 1996a). The clients’ perspective intends to assess the satisfaction of the clients’ objectives. Kaplan and Norton (1996c) consider that, to do so properly, the following is needed: to segment the market, dividing it in groups of clients with similar goals; and to which measures are most suited to each group of clients. To keep clients satisfied, the excellence of internal functioning must be ensured, and this can be assessed through the internal processes perspective, which must be focused on the entire chain of value creation for the clients.. This chain has three stages (KAPLAN; NORTON, 1996c): innovation; operations; after sales service. To ensure the goals of the company can be reached in the future on the three abovementioned perspectives, three key factors must be secured on the learning and growth perspective (KAPLAN; NORTON, 1996b): employee ability; employee motivation; information system capacity. Worker motivation is a key factor to the success of any organization and, as such, it must not be forgotten when building the BSC (KAPLAN; NORTON, 2001a). O n e o f t h e B S C ’s f u n d a m e n t a l characteristics as a strategic management system is the need for a cause-effect relation between the various perspectives and the various measures chosen (KAPLAN; NORTON, 1996d). Kaplan and Norton (1996c) state that the BSC is not a simple set of measures, but their definition must follow two fundamental principles: all measures used must be based on the definition of objectives established by the company’s mission and strategy; and a cause-effect relation between the measures defined for the four perspectives must be ensured. If these two principles are respected, the BSC describes the company’s strategy, because each selected measure is an integrating element in the cause-effect chain of relations. Thus, the meaning of the strategy can be communicated to all of the company’s employees (KAPLAN; NORTON, 2010). Empirical studies performed have shown that the cause-effect relations between BSC measures are one of the most difficult aspects to implement (BANKER; POTTER; SRINIVASAN, 2000; BRYANT; JONES; WIDENER, 2004; ITTNER; LARCKER, 1998; MALINA; SELTO, 2001; MALMI, 2001; LIPE; NORREKLIT, 2000, 2003; SALTERIO, 2002; SPECKBACHER; BISCHOF; PFEIFFER, 2003). Kaplan and Norton (2001b) continue to insist that causeeffect relations are indispensable if the BSC is to be used as a strategic management instrument. To clarify their existence, Kaplan and Norton (2001b) propose the creation of a strategic map: an element that systematizes strategic objectives,. 132 Rev. bus. manag., São Paulo, Vol. 15, No. 46, pp. 129-148, jan./mar. 2013.
(5) Balanced Scorecard: an empirical study of small and medium size enterprises. distributed over the four BSC perspectives, and identifies the existing cause-effect relations. The large experience of implementing the BSC in major enterprises led to the creation of a new management model called Strategy-focused Organization (SFO), described by focusing on and aligning the entire management process with the company’s strategy (KAPLAN; NORTON, 2001c). Empirical studies already carried out in other countries show high usage rates for BSC, namely in companies from Sweden (KRAUS; LIND, 2010), Bahrain (JUHMANI, 2007), and India (ANAND; SAHAY; SAHA, 2005). Krauss and Lind (2010) conducted interviews in 15 large sized Swedish companies, concluding that 53% of them use BSC. Juhmani (2007) collected date from 83 big companies in Bahrain, using a questionnaire, and concluded that 65% of them use BSC. Anand, Sahay and Saha (2005) also used a questionnaire to gather data from 53 Indian companies, reporting a BSC usage rate of 45%. Quesado and Rodrigues (2009) conducted an inquiry to the 250 largest Portuguese companies, obtaining data from 85 companies. Analysis of this data allowed them to conclude that the level of BSC implementation in Portugal is extremely small, unlike what is reported by studies carried out in other countries. None of these studies focused on small and medium sized companies, which justifies performing similar studies on this type of companies. Several authors consider that it is important to be aware of the variables responsible for spreading the knowledge on management accounting methods. These variables can be split into two groups: company characteristics, such as dimension and capital ownership; characteristics of those in charge of accounting, such as academic education, gender and age. Regarding the first type of variables, company dimension is studied in research by Chenhal (2003), Haldma and Lääts (2002), Joshi (2001), Innes, Mitchell and Sinclair (2000), Clarke, Hill and Stevens (1999), Chenhal and Langfield-Smith (1998), Libby and Waterhouse (1996), and Innes and Mitchell. (1995), Abdel-Kader and Luther (2008), Cadez and Guilding (2008), Woods (2009). These papers conclude that large enterprises use more sophisticated management accounting methods. Two justifications are presented for this phenomenon: the fact that larger enterprises require formal procedures to ensure coordination of all operations; and the availability of financial resources. Ownership of capital is a contingency variable studied by Ghosh and Chan (1997), Clarke, Hill and Stevens (1999), and Haldma and Lääts (2002), having these authors however obtained contradictory results. The first two articles conclude that the subsidiaries of multinational organizations have more sophisticated management accounting methods, when compared to the enterprises of the region. Haldma and Lääts (2002) studied the same relation in enterprises from Estonia, and did not find any connection between both variables. Regarding the second type of variables responsible for spreading the management accounting methods, several authors (BLAKE; WRAITH; AMAT, 2000; CLARKE; HILL; STEVENS, 1999; COHEN; VENIERIS; KAIMENAKI, 2005; SHIELDS, 1998) analyzed the characteristics of people in charge of accounting, such as academic education, gender, and age. Education of the person in charge of management accounting is one of the factors that Shields (1998) and Clarke, Hill and Stevens (1999) consider to affect entrepreneurial practices. Clarke, Hill and Stevens (1999) concluded that the very people in charge of accounting are the main barriers to changing methods used by Irish enterprises, due to their insufficient management training. This was also analyzed in Spanish enterprises by Blake, Wraith and Amat (2000). They found a large variety in terms of academic education, with a predominance of higher level education. Blake, Wraith and Amat (2000) also analyzed the gender variable, reporting a predominance of the male gender in the majority of people in charge interviewed. Cohen, Vanieris and Kaimenaki (2005) expressed surprise regarding the high percentage of those in charge. 133 Rev. bus. manag., São Paulo, Vol. 15, No. 46, pp. 129-148, jan./mar. 2013.
(6) Maria João Cardoso Vieira Machado. of management accounting in large enterprises that are unaware of the most modern methods of management accounting, and this led them to research explanatory factors. One of the factors they found was that people in charge are the ones who have worked longest for the company – which, according to the authors, may suggest an older age group without knowledge update. Based on literature reviewed, we established the following study questions: Research Question A – Do Portuguese industrial SMEs use the Balanced Scorecard? Research Question B – Are those in charge of management accounting aware of the Balanced Scorecard? Research Question C – Is there any relation between spreading knowledge about the Balanced Scorecard and specific contingency variables?. 3 RESEARCH METHOD Several authors, namely Chua (1986), defend that the research process is conditioned by three sequential factors. The first has to do with the researcher’s assumptions about the real nature of the phenomenon – the characterization of his/her ontological position. The second is the way the researcher considers he can acquire knowledge on the phenomenon under study – the characterization of his/her epistemological position. The third is the methodology the researcher considers most suitable for the collection of valid evidences on the phenomenon. Based on these three factors, several authors classify accounting research by the identification of major paradigms (BHIMANI, 2002). One of the most commonly used classifications to characterize research paradigms in accounting is Burrell and Morgan’s apud (RIAHI-BELKAOUI, 2000), which is based on two criteria. The first defines the researcher’s position regarding the nature of social sciences, which must be between two extremes – objectivity and subjectivity. The second criterion translates the perspective the researcher has on society, that. can spread from radical change to regulation. The crossing of these two criteria leads to four research paradigms (RIAHI-BELKAOUI, 2000): functionalism, characterized by an objective view of reality, and by constant striving for social stability, maintaining order; interpretivism, based on the same social balance but presenting a more subjective view of reality; radical humanism, characterized by a subjective view of reality, while assuming, however, the existence of social transformation; radical structuralism, based on the same view of society as humanism but distinguishing itself from it by a more objective perspective of reality. In the reviewed management accounting empirical studies, these four research paradigms were not identified; instead, another three were observed. Functionalism, also known as positivism, is followed by several authors, namely Watts and Zimmerman (1990), Chambers (1993), and Zimmerman (2001). Interpretivism, or interpretative research, is followed by Scapens (1990), Humphrey and Scapens (1996), Covaleski and Dirsmith (1988), and Burns and Scapens (2000), amongst others. Radical humanism and radical structuralism are normally grouped into a single category: critical research (BAXTER; CHUA, 2003; BHIMANI, 2002; COVALESKI; DIRSMITH, 1996). This type of research is followed by authors such as Miller and O’ Leary (1987), Laughlin (1987), and Hopper and Armstrong (1991). Regarding the choice of the most adequate paradigm for accounting research, Covaleski and Dirsmith (1996) consider that different paradigms treat different types of problems, or even the same problem, with a different perspective regarding its nature. In this study, we have chosen to use the paradigm of positivist research, because we think the type of evidence we want to obtain is compatible with an objective conception of reality – considering external to the researcher – and with the existence of a rational logic in decisionmaking based on accounting information, all characteristics referring to this research paradigm (CHUA, 1986). This paper’ objectives are incompatible with the subjective view of reality associated. 134 Rev. bus. manag., São Paulo, Vol. 15, No. 46, pp. 129-148, jan./mar. 2013.
(7) Balanced Scorecard: an empirical study of small and medium size enterprises. with interpretivism (COVALESKI; DIRSMITH, 1996), and with the need to recognize and analyze existing sources of conflict with accounting referring to critical research (TILLING; TILT, 2004), Regarding the data collection method, previously defined study questions were reduced to two – questionnaires or interviews –, since data to be collected is not public. The use of interviews to collect evidence on questions presented by this paper has one main advantage: the fact that issues on which we intend to collect data are not normalized in Portugal, which can lead to different names for the same reality in different enterprises. The use of interviews allows the concepts to be explained to the interviewees generating greater response reliability (BELL, 2005). Semi-structured interviews are especially useful to collect information on which there is no certainty that all those in the process understand the concepts the researcher is trying to assess (ABERNETHY et al., 1999). In this study, we chose to conduct semistructured interviews in which there is no support questionnaire, but instead a set of topics on which they have to focus (BELL, 2005). Interviews were carried out solely with people in charge of management accounting, because we considered he/she possess all the information on which we intended to collect data, having also - due to the size of the company - a global view of it. This study intends to analyze the universe of the 163 Portuguese industrial SMEs consistently classified with excellence in this century. Following three contact stages, we scheduled interviews with the person in charge of management accounting in 58 enterprises situated in 11 of the 14 districts in the initial defined range. We considered this good coverage of the universe being analyzed. The 58 enterprises that accepted to participate in this study represent a response rate of 36%, comparable to those of other papers analyzed in the literature review, namely Drury and Tayles (1994) with a response rate of 35%; Haldma and Lääts (2002), with a response rate of 34%; Innes and Mitchell (1995), Innes, Mitchell and Sinclair. (2000), Joshi (2001), with response rates of only 25%, 23% and 24%, respectively. However, the existence of non-respondents could cause biased results, namely if the enterprises that didn’t want to participate had homogeneous and non-dispersed characteristics, thus defining a category with specific characteristics (YOUNG; STEDE; CHEN, 2005). Using a three-factor analysis, we did not find, in this study, any proof of bias caused by non-responding enterprises. The first factor was the Portuguese geographic territorial coverage, with enterprises from 79% of the districts in the universe being represented, and the three non-covered districts with only one company each. This suggests that geographic representation is not an indicator that can cause biased results. The second factor was the business sector of the responding enterprises, with a great sector dispersion appearing amongst interviewed enterprises, identical to the one found among non-responding ones. This also suggests this is not a factor for biased results. The third factor was the size of the enterprises, which, according to Young, Stede and Chen (2005), can be measured through the number of employees. We compared respondents with non-respondents in terms of size. The t-student test obtained presents a value of 1.165 for 161 degrees of freedom with a p-value of 0.246, which shows there are no significant differences in the average dimension of both groups. This analysis allow us to conclude the results of this paper, although not valid for all Portuguese industrial SMEs, can characterize the reality of a subset of those enterprises – ones consistently classified with excellence in the current century.. 4 RESULTS Regarding Research Question A, evidence collected allows us to conclude that only three enterprises (5%) use performance evaluation tools, with the BSC as the method used in all cases. This usage rate is much smaller than the reported by empirical studies performed in large. 135 Rev. bus. manag., São Paulo, Vol. 15, No. 46, pp. 129-148, jan./mar. 2013.
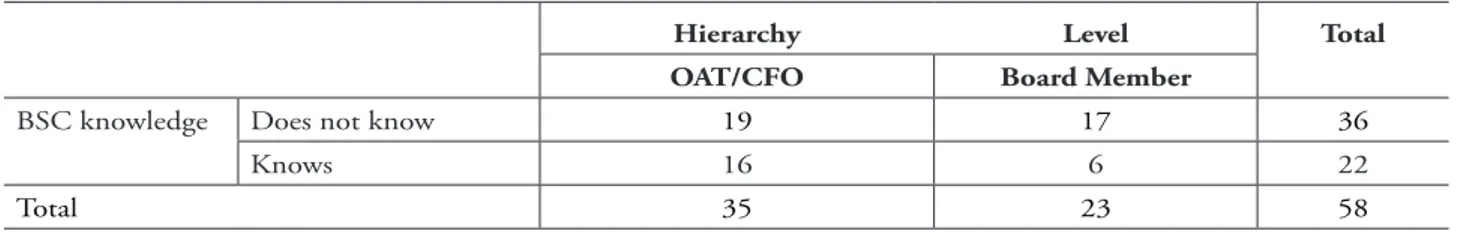
(8) Maria João Cardoso Vieira Machado. companies from other countries, which show rates close to 50% (ANAND; SAHAY; SAHA, 2005; JUHMANI, 2007; KRAUS; LIND, 2010). The usage rate found is also much smaller than that reported by the empirical study already conducted in Portugal, but regarding large companies (QUESADO; RODRIGUES, 2009), suggesting the existence of factors limiting the use of BSC in SMEs. One of the enterprises is still considering its use. The use of the BSC was already considered and rejected by 18 enterprises (31%). Reasons presented by these enterprises were the following: in 50% of the cases, management considered that the BSC was not useful to the company; the ratio benefit/cost not being favorable was the reason stated by another 22% of those in charge; in 11% of the cases, managers considered that the BSC philosophy was incompatible with the company’s internal policy of non-disclosure of management information to the public; the need to comply with rules imposed by the headquarters was the justification presented in 11% of the cases; some of those in charge (6%) consideres the company did not have personnel prepared to implement the BSC. For the analysis of Research Question B, we ellaborated a variable that reflects existing knowledge on the BSC, called BSC knowledge. Results allow us to conclude that the majority (62%) of those in charge of management accounting are unaware of the BSC. The remaining people in charge (38%) know the method through different sources: in some, knowledge comes from education; in others, it. comes from postgraduate studies or from reading articles on the subject. For the analysis of Research Question C, we had to verify if spreading the knowledge about the BSC is or is not influenced by two types of variables: characteristics of those in charge; company characteristics. To study the existence of a relation between knowledge about the BSC and the interviewees’ individual characteristics, we had to cross the variable BSC knowledge with other variables reflecting characteristics of the interviewees – such as the hierarchy level they have in the company, education, gender and age. We found three categories of people in charge of management accounting, which led to the ellaboration of the variable hierarchy level. In all enterprises where there is a Chief Financial Officer (CFO), he/she is the person in charge of management accounting. This occurs in most enterprises (52%). In 40% of the cases, the responsibility for management accounting is placed on a Member of the Board. In 8% of the enterprises, those in charge of management accounting are Official Accounting Technicians (OAT). The results of crossing the variables BSC knowledge and hierarchy level are presented in Table 1. There is some homogeneity in the response categories for both variables, which suggests there is no connection between their behavior. The Pearson Chi-Square test validates this information by presenting a value of 2.271 for one degree of freedom with a p-value of 0.132, which does not allow rejecting the null hypothesis of independence between hierarchy level and BSC knowledge.. Table 1 – BSC knowledge and hierarchy level variables.. BSC knowledge. Does not know Knows. Total. Hierarchy. Level. OAT/CFO. Board Member. 19. 17. Total 36. 16. 6. 22. 35. 23. 58. Source: the author.. 136 Rev. bus. manag., São Paulo, Vol. 15, No. 46, pp. 129-148, jan./mar. 2013.
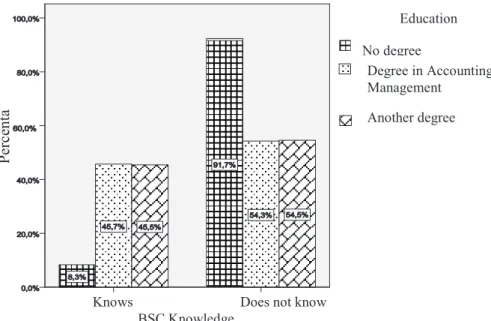
(9) Balanced Scorecard: an empirical study of small and medium size enterprises. Regarding the education of those in charge of management accounting, data collected show a large diversity of categories. In 21% of the enterprises those in charge do not have a university level education. The majority of those in charge (71%) have bachelor’s degree level education, with the highest response frequency coming from those with a degree in Management (36%), followed by those with a degree in Accounting (16%), Economy (12%), and finally Engineering (7%). The highest level of education is a master’s degree, found in 8% of those in charge. To validate. whether the type of education is connected with BSC knowledge, we had to cross the variables BSC knowledge and education, as presented in Table 2. Figure 1 shows the connection between the BSC knowledge and education variables, and shows some heterogeneity in response categories, which suggests a connection between the behavior of both variables. The BSC is better known by those in charge who have higher education, regardless of their respective area of knowledge, than by those people in charge with no higher education, of which only 8% know the BSC.. Table Table 2 – BSC knowledge and variables. 2 – BSC knowledge andeducation education variables. Education. Education Degree in Accounting/ Degree in Accounting/ Management Management 19 19 1616 3535. No degree BSC knowledge Does not know BSC knowledge Does not know KnowsKnows. Total Total Source:Source: the author. by the author.. No degree 11 1 1 12 12 11. Total. Another degree. Another degree 6 6 55 11 11. Total. 36. 36 22 22 58 58. The Pearson Chi-Square test produced charge. Cramer coefficient presents a value The Pearson Chi-Square test produced a value of The 5.630 for two degrees of freedom, andof a5.630 p-value 0.060, whichof allows us to reject nullwith hypothesis ofofindependence and us a value foroftwo degrees freedom, of the 0.312, a p-value 0.060. This allows theof existence a connection between BSC the education of hypothesis those in of and aaccept p-value 0.060, of which allows us to to knowledge confirm theand rejection of the null Cramer coefficient presentsand a value ofindependence 0.312, with a between p-value of Thisand allows reject charge. the nullThe hypothesis of independence the0.060. variables consider us to confirm the rejection of the null hypothesis of independence between the variables and accept the existence of a connection between the existence of a moderate connection between consider the existence of a moderate connection between them. BSC knowledge and the education of those in them. Education No degree Degree in Accounting/ Management. Percenta ge. Another degree. Knows. BSC Knowledge. Does not know. Figure 1 – BSC knowledge and education variables Figure 1 –BSC knowledge and education variables. Source:Source: the author. by the author.. The last two variables to connect with knowledge about the BSC are the gender and Rev. bus. age manag., Paulo, Vol. No. 46, pp. jan./mar. 2013accounting. Regarding the gender variable, results are ofSãothose in 15, charge of129-148, management identical to those reported by Blake, Wraith and Amat (2000), where the majority of those in charge are male (76%). The results of crossing the BSC knowledge and gender variables are. 137.
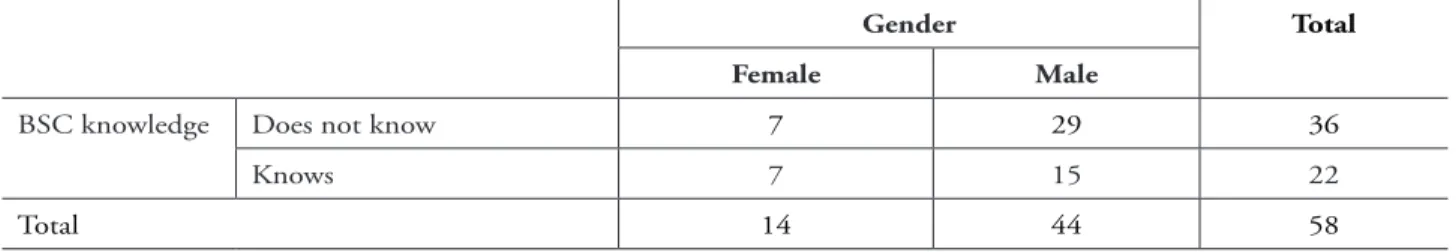
(10) Maria João Cardoso Vieira Machado. The last two variables to connect with knowledge about the BSC are the gender and age of those in charge of management accounting. Regarding the gender variable, results are identical to those reported by Blake, Wraith and Amat (2000), where the majority of those in charge are male (76%). The results of crossing the BSC knowledge and gender variables are presented in Table 3, and show some homogeneity in the. response categories of both variables, suggesting the inexistence of any connection between their behavior. The Pearson Chi-Square test validates this information by presenting a value of 1.142 for one degree of freedom with a p-value of 0.285. This does not allow rejecting the null hypothesis for independence between gender and BSC knowledge.. Table 3 – Variables BSC knowledge and gender Gender BSC knowledge. Total. Female. Male. Does not know. 7. 29. 36. Knows. 7. 15. 22. 14. 44. 58. Total Source: the author.. Regarding the age variable, in the first category we included those in charge who are below 40, representing 31% of the cases. The second response category includes those in charge who are between 40 and 60 years old - most (53%) of the cases. The third category includes. those in charge who are over 60, representing only 16% of cases. To analyze the connection between knowledge about the BSC and the age group of those in charge, we crossed the BSC knowledge and age variables in Table 4.. Table 4 – BSC knowledge and age variables. Age. BSC knowledge Total. Total. Below 40. Between 40 and 60. Over 60. Does not know. 6. 21. 9. 36. Knows. 12. 10. 0. 22. 18. 31. 9. 58. Source: the author. Fi g u r e 2 s h o w s s o m e f r e q u e n c y concentration in two response categories, thus suggesting a connection between the behavior of both variables. In the age group of those who are below 40, most of those in charge (67%) know the. BSC, whilst in the group of those over 60 none of the interviewees know this method. From the application of the Pearson Chi-Square test comes a result of 12.237 for two degrees of freedom with a p-value of 0.002.. 138 Rev. bus. manag., São Paulo, Vol. 15, No. 46, pp. 129-148, jan./mar. 2013.
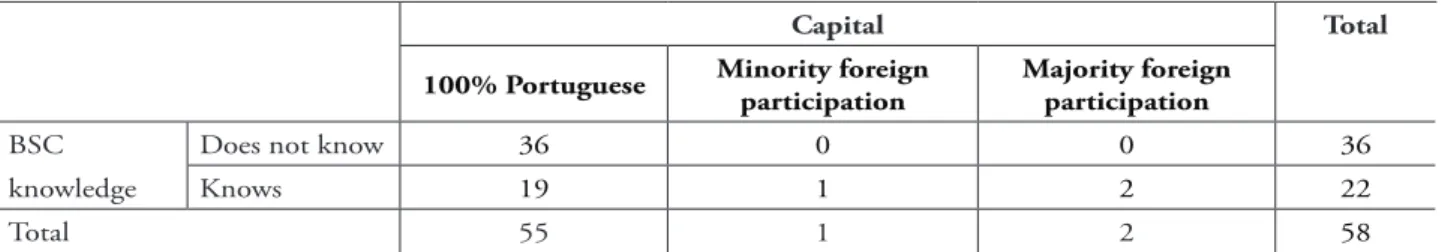
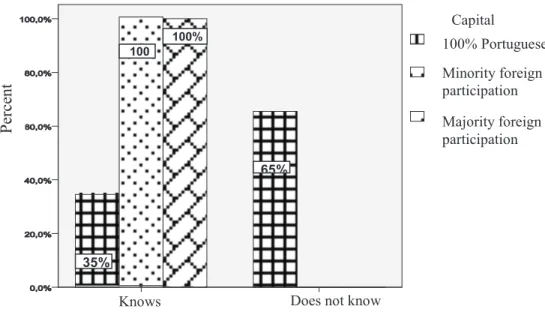
(11) Balanced Scorecard: an empirical study of small and medium size enterprises. AGE Below 40. Percent. 100%. 68%. 67%. 32%. Between 40 and 60 years Over 60 years. 33%. Knows. Does not know. BSC KNOWLEDGE – BSC knowledge age variable. FIGURE 2 –Figure BSC 2knowledge and ageand variable Source: Prepared bythe theauthor. author Source:. This allows us to reject the null hypothesis of independence, and to accept the This allows us to reject the null hypothesis variable BSC knowledge with other variables alterative hypothesis connection between BSC and the characteristics, age of the person that knowledge reflect organizational such in of independence, andoftoa accept the alterative charge. To measure the intensity ofBSC the relation between both and variables weCapital used the as capital ownership dimension. hypothesis of a connection between coefficient Cramer, valueinischarge. 0.459 withownership a p-value of 0.002. Thisand confirms the null is analyzed by Ghosh Chan (1997), knowledgeofand the age whose of the person hypothesis ofthe variable and the possibility of aand strong connection between Clarke, Hill Stevens (1999) and Haldma andBSC To measure intensityindependence of the relation between Lääts (2002), through the nature of the company both variables we used the coefficient of Cramer, knowledge and the age of the person in charge. capital owners, classifying them as multinational whose value is 0.459 with a p-value of 0.002. To study the existence of a connection between knowledge about the BSC and the subsidiaries, or 100% national enterprises. For This confirms the null hypothesis of variable company’s characteristics we needof to cross the variable BSCweknowledge with other variables this purpose created the variable capital. We independence and the possibility a strong thatconnection reflect organizational characteristics, such as capital ownership and dimension. Capital found only 5% of enterprises with foreign capital between BSC knowledge and the age ownership is analyzed by Ghosh and Chan (1997), Clarke,of Hill andrepresented Stevens minority (1999) and participation, these 2% of the person in charge. ownership andcapital 3% a majority Thethem To study existence of a connection Haldma and Läätsthe (2002), through the nature of the company owners,ownership. classifying connection between variable BSC the between knowledge about theorBSC and national the as multinational subsidiaries, 100% enterprises. For thisthis purpose weand created knowledge is presented in Table 5. company’s characteristics we need to cross the variable capital. We found only 5% of enterprises with foreign capital participation, of these. 2% represented minority ownership and 3% a majority ownership. The connection between thisTable variable and BSC knowledge is presented in Table 5. 5 – BSC knowledge and capital variables. TABLE 5 – BSC knowledge and capital variables 100% Portuguese BSC. Does not know. knowledge. Knows. BSCTotal. Does not know Source: the author knowledge Knows Total. 36 100%. 19 Portuguese 3655 19. 55. Capital Minority foreign participation Capital 0 foreign. Minority 1 participation 0 1 1 1. Total Majority foreign participation 0 Majority foreign 2 participation 0 2 2. 2. Total. 36. 22. 3658 22 58. Source: Prepared by the author 139 Analysis of Figure 3 shows some heterogeneity in response categories, which suggests a connection between both All foreign capital enterprises know the BSC, whilst Rev. bus. manag., São Paulo, Vol. 15, No. 46, pp. variables. 129-148, jan./mar. 2013 66% of the enterprises with capital 100% national do not know this method. However, this observation cannot be statistically validated because the Pearson Chi-Square test is not valid –.
(12) Maria João Cardoso Vieira Machado. Analysis of Figure 3 shows some heterogeneity in response categories, which suggests a connection between both variables. All foreign capital enterprises know the BSC, whilst 66% of the enterprises with capital 100% national do. Capital. 100%. 100% Portuguese Minority foreign participation. Percent. 100 %. not know this method. However, this observation cannot be statistically validated because the Pearson Chi-Square test is not valid – following a violation of its assumptions – due to the low response frequency in some categories.. Majority foreign participation 65%. 35%. Knows. Does not know BSC Knowledge. Figure 3 – BSC knowledge and capital variables. Source: the author.. Figure 3 – BSC knowledge and capital variables. Source: by the author.. As a measure for dimension we used the of this variable we need to analyze the nonAs a measure for (2003), dimension we used the central variable mentioned by Chenhal (2003), and variable mentioned by Chenhal and Libby tendency location measures, such as the Libby and Waterhouse (1996):ofthe number of workers. characteristics and Waterhouse (1996): the number workers. quartiles:This 25%variable of the shows enterprises have up to different from the previous ones due to its quantitative nature, thus demanding the previous This variable shows characteristics different from 51 workers, 50% have up to 82 (median) and description of its behavior and its transformation into a categorical variable so that it be the previous ones due to its quantitative nature, 75% of the enterprises have up to 119 can workers. withthe the previous qualitative variable BSC Theatcentral tendency location thus crossed demanding description of its knowledge. Looking this from another angle measures we can say show the following: the interviewed enterprises have on average 90 workers; the truncated behavior and its transformation into a categorical that 50% of the enterprises have between 51 and mean at 5% presents a value close to the previous one, about 88 workers; and the median is at variable so that it can be crossed with the 119 workers. To analyze the connection between 82 workers. qualitative variable BSC knowledge. The central company dimension and BSC knowledge we The dispersion for this variable need present the following values: of theworkers numberinto of a tendency location measures measures show the following: to transform the number workers varies from ahave minimum of 1090to a maximum of variable. 250 workers, which generates a the interviewed enterprises on average categorical variation range of 240 workers; the interquartile range is 68 workers; standard workers; the truncated mean at 5% presents a According to Hill and andthe Hill (2002) is previous 53 workers. better understand the categorization behavior of this we need to analyze valuedeviation close to the one, To about 88 workers; of variable a continuous variable in two the non-central tendency location measures, such as the quartiles: 25% of the enterprises and the median is at 82 workers. categories – higher values and lower valueshave – can up The to 51 workers, 50% have up to 82 (median) anddone 75%using of the enterprises have 119 dispersion measures for this variable be either the average or up thetomedian workers. Looking values: at this from another ofangle weas can saycriterion. that 50%Being of the enterprises have present the following the number a split this an asymmetrical between 51 and 119 workers. To analyze the connection between company dimension and workers varies from a minimum of 10 to a variable with outliers susceptible of influencing BSC knowledge we need to transform the number of workers into a categorical variable. maximum of 250 workers, which generates a the average, the most suitable criterion is to According to Hill the andinterquartile Hill (2002) categorization of astatistic continuous variation range of 240 workers; choose a strong such asvariable median. in Thetwo new categories – higher values and lower values – can be done using either the average or the range is 68 workers; and the standard deviation variable called dimension presents two response split criterion. Being this an asymmetrical variable with outliers susceptible is 53median workers.asToa better understand the behavior categories: the first category is composed by of the. 140. influencing the average, the most suitable criterion is to choose a strong statistic such as median. The new variable called dimension presents two response categories: the first category is composed by the enterprises with up to manag., 82 workers; the second Rev. bus. São Paulo, Vol. 15, No. 46, pp. 129-148,includes jan./mar. 2013 enterprises with over 82 workers. The connection between this variable and the variable BSC knowledge is presented in Table 6..
(13) Balanced Scorecard: an empirical study of small and medium size enterprises. enterprises with up to 82 workers; the second includes enterprises with over 82 workers. The. connection between this variable and the variable BSC knowledge is presented in Table 6.. Table – Variables BSC knowledge dimension. Table 6 –6Variables BSC knowledge and and dimension. Dimension Up to 82 workers BSC knowledge. BSC knowledge Total. 22Up to 82 workers. Does not know. Does not know Knows Knows. 8 30. Total Source: the author. Source: by the author.. 22 8 30. Dimension Over 82 workers Over 82 workers 14 14 14 14 28 28. Total 36 22 58. Total 36 22 58. Figure 4 shows that in half the enterprises of independence and to accept the Figure 4 shows that in half the enterprises null withhypothesis more workers, those in charge know more workers, those in charge know the alternative hypothesis of a connection between thewith BSC, whilst in enterprises with less workers, most people in charge (73%) do not know BSC, whilst in enterprises with less workers, most dimension and BSC knowledge. The coefficient of this method. From the application of the Pearson Chi-Square test to the relation between both people in charge (73%) do not know this method. Cramer presents a value of 0.240, with a p-value variables results the value of 3.349 for one degree of freedom with a p-value of 0.067, which From the application of the Pearson Chi-Square of 0.067. This allows the confirmation of the allows us to reject the null hypothesis of independence and to accept the alternative test to the relation between both variables results rejection of the null hypothesis of independence hypothesis of a connection between dimension and BSC knowledge. The coefficient of the value of 3.349 for one degree of freedom with between both variables, and to consider the Cramer presents a value of 0.240, with a p-value ofexistence 0.067. This allows the confirmation of the a p-value of 0.067, which allows us to reject the of a moderate connection between them. rejection of the null hypothesis of independence between both variables, and to consider the existence of a moderate connection between them.. Size Up to 82 workers 73% Percent. Over 82 workers. 50%. 50 %. 27 %. Knows. Does not know. BSC Knowledge Figure 4 – BSC knowledge and dimension variables. Figure 4 – BSC knowledge and dimension variables. Source: by the author. Source: the author.. 5 CONCLUSION 141 Rev. bus. manag., Paulo, Vol. 15, No. 46, pp. 129-148, jan./mar. The São theory gives supremacy to 2013 the. BSC when compared to performance evaluation methods based exclusively on financial measures. When it comes to the first objective of this study – to analyze BSC usage in Portuguese industrial SMEs – the information collected.
(14) Maria João Cardoso Vieira Machado. 5 CONCLUSION The theory gives supremacy to the BSC when compared to performance evaluation methods based exclusively on financial measures. When it comes to the first objective of this study – to analyze BSC usage in Portuguese industrial SMEs – the information collected allows us to conclude that only a residual percentage of the enterprises use it, which is not convergent with the empirical studies already, performed in big companies. The literature reviewed suggests that even when not using it the fact of those in charge of management accounting knowing it is an advantage for the enterprises. This fact makes studying the spreading the knowledge about the BSC to the people in charge of management accounting relevant, which is the second objective of this study. Evidence gathered shows that the majority of those in charge do not know the method. The reviewed literature suggests, although with no empirical evidence, that knowledge about the BSC may be connectioned with specific factors. These factors can be divided into two groups: company characteristics, and characteristics of those in charge of management accounting. The third objective of this goal is to collect empirical evidence to confirm this suggestion. Regarding the first type of variables, the evidence gathered shows a statistically significant connection between knowledge about the BSC and two individual characteristics of those in charge: academic education and age of the person in charge. We didn’t find any connection between knowledge about the BSC, hierarchy level, and the gender of the person in charge. Regarding the second type of contingency variables, the evidence gathered shows a statistically significant connection between BSC knowledge and company dimension. The data collected suggest the existence of a connection between knowledge about the BSC and the company’s capital structure, but the reduced number of foreign owned enterprises does not allow a statistic validation of this connection. As main limitations of this study we can state the few enterprises that have accepted to. cooperate, which prevents generalizing the results, and also the possibility that the information collection method – interviews – may influence the replies of the interviewees. However, this study contributes for the knowledge on management accounting for two reasons. Firstly, its results show that unlike what was reported by the empirical studies conducted in large companies, BSC is very little used in Portugal in the SMEs classified as excellence. Secondly, the results obtained fill in a gap in knowledge because the empirical data show the existence of a connection between BSC knowledge and some personal characteristics of the people in charge of management accounting, and of the enterprises themselves. Some of these factors, although suggested by the reviewed literature, had not yet been empirically demonstrated. Evidence gathered suggests a need for further research in order to discover why the SMEs do not use the performance evaluation methods considered as most adequate by theory.. REFERENCES ABDEL-KADER, M., LUTHER, R. The impact of firm characteristics on management accounting practices: a UK-based empirical analysis. The British Accounting Review, [Bangor], v. 40, n. 1, p. 2-27, Mar. 2008. ABERNETHY, M. A. et al. Research in managerial accounting: learning from others’ experiences. Accounting and Finance, Carlton, v. 39, n. 1, p. 1-27, Mar. 1999. ALBRIGHT, T. et al. Four steps to simplify multimeasure performance evaluations using the balanced scorecard. The Journal of Corporate Accounting & Finance, New York, v. 21, n. 5, p. 63-68, July/Aug. 2010. ANAND, M.; SAHAY, B. S.; SAHA, S. Balanced scorecard in India companies. Vikalpa, Ahmadabad, v. 30, n. 2, p. 11-25, Apr./June 2005. BANKER, R. D.; CHANG, H.; PIZZINI, M. J. The balanced scorecard: judgmental effects. 142 Rev. bus. manag., São Paulo, Vol. 15, No. 46, pp. 129-148, jan./mar. 2013.
(15) Balanced Scorecard: an empirical study of small and medium size enterprises. of performance measures linked to strategy. The Accounting Review, Sarasota, v. 79, n. 1, p. 1-23, Jan. 2004. ______; MASHRUWALA, R. The moderating role of competition in the relationship between nonfinancial measures and future financial performance. Contemporary Accounting Research, Toronto, v. 24, n. 3, p. 763-793, Fall 2007. ______; POTTER, G.; SRINIVASAN, D. An empirical investigation of an incentive plan that includes nonfinancial performance measures. The Accounting Review, Sarasota, v. 75, n. 1, p. 6592, Jan. 2000. BAXTER, J.; CHUA, W. F. Alternative management accounting research: whence and whither. Accounting, Organizations and Society, Oxford; New York, v. 28, n. 2-3, p. 97126, Feb./Apr. 2003. BELL, J. Doing your research project: a guide for first-time researchers in education and social science. 4th ed. Buckingham: Open University Press, 2005. BHIMANI, A. European management accounting research: traditions in the making. European Accounting Review, London, v. 11, n. 1, p. 99117, May 2002. BLAKE, J.; WRAITH, P.; AMAT, O. Developing a new national management accounting framework: the Spanish case. European Business Review, Bradford, v. 12, n. 3, p. 122128, 2000. BRYANT, L.; JONES, D. A.; WIDENER, S. K. Management value creation within the firm: an examination of multiple performance measures. Journal of Management Accounting Research, Sarasota, v. 16, n. 1, p. 107-131, Dec. 2004. BUDDE, J. Performance measure congruity and the balanced scorecard. Journal of Accounting Research, Chicago, v. 45, n. 3, p. 515-539, June 2007.. BURNS, J.; SCAPENS, R. W. Conceptualizing management accounting change: an institutional framework. Management Accounting Research, Sarasota, v. 11, n. 1, p. 3-25, Mar. 2000. BUTLER, J.; HENDERSON, S. C.; RAINBORN, C. Sustainability and the balanced scorecard: integrating green measures into business reporting. Management Accounting Quarterly, Montvale, v. 12, n. 2, p. 2-11, Winter 2011. BYRNE, S.; PIERCE, B. Towards a more comprehensive understanding of the roles of management accountants. European Accounting Review, London, v. 16, n. 3, p. 469-498, July 2007. CADEZ, S.; GUILDING, C. An exploratory investigation of an integrated contingency model of strategic management accounting. Accounting, Organizations and Society, Oxford; New York, v. 33, n. 7-8, p. 836-863, Oct./Nov. 2008. CARDINAELS, E.; VEEN-DIRKS, P. M. G. Financial versus non-financial information: the impact of information organization and presentation in a balanced scorecard. Accounting, Organizations and Society, Oxford; New York, v. 35, n. 6, p. 565-578, Aug. 2010. CHMBERS, R. J. Positive accounting theory and the PA cult. Abacus, Carlton, v. 29, n. 1, p. 1-26, Mar. 1993. CHEN, S. DCF techniques and nonfinancial measures in capital budgeting: a contingency approach analysis. Behavioral Research in Accounting, Sarasota, v. 20, n. 1, p. 13-29, Spring 2008. CHENHALL, R. H. Management control systems design within its organizational context: findings from contingency-based research and directions for the future. Accounting, Organizations and Society, Oxford; New York, v. 28, n. 2-3, p. 127168, Feb./Apr. 2003.. 143 Rev. bus. manag., São Paulo, Vol. 15, No. 46, pp. 129-148, jan./mar. 2013.
(16) Maria João Cardoso Vieira Machado. ______; L ANGFIELD-SMITH, K. The relationship between strategic priorities, management techniques and management accounting: an empirical investigation using a systems approach. Accounting, Organizations and Society, Oxford; New York, v. 23, n. 3, p. 243-264, Apr. 1998. CHUA, W. F. Radical developments in accounting thought. The Accounting Review, Sarasota, v. 61, n. 4, p. 601-632, Oct. 1986. CLARKE, P. J.; HILL, N. T.; STEVENS, K. Activity-based costing in Ireland: barriers to, and opportunities for change. Critical Perspectives on Accounting, London, v. 10, n. 4, p. 443-468, Aug. 1999. COHEN, S.; VENIERIS, G.; KAIMENAKI, E. ABC: adopters, supporters, deniers and unawares. Managerial Auditing Journal, Bradford, v. 20, n. 9, p. 981-1000, 2005. COKINS, G. The promise and perils of the balanced scorecard. The Journal of Corporate Accounting & Finance, New York, v. 21, n. 3, p. 19-28, Mar./Apr. 2010. C O RO N A , C . D y n a m i c p e r f o r m a n c e measurement with intangible assets. Review Accounting Studies, Boston, v. 14, n. 2-3, p. 314-348, Sept. 2009. COVALESKI, M. A.; DIRSMITH, M. W. An institutional perspective on the rise, social transformation, and fall of a university budget category. Administrative Science Quarterly, Ithaca, v. 33, n. 4, p. 562-587, Dec. 1988. ______; ______; SAMUEL, S. Managerial accounting research: the contributions of organizational and sociological theories. Journal of Management Accounting Research, Sarasota, v. 8, n. 1, p. 1-35, 1996. CRABTREE, A. D.; DEBUSK, G. K. The effects of adopting the balanced scorecard on shareholder returns. Advances in Accounting, Greenwich, v. 24, n. 1, p. 815, June 2008.. DAVIS, S.; ALBRIGHT, T. An investigation of the effect of balanced scorecard implementation on financial performance. Management Accounting Research, Sarasota, v. 15, n. 2, p. 135-153, June 2004. DILLA, W. N.; STEINBART, P. J. Relative weighting of common and unique balanced scorecard measures by knowledgeable decision makers. Behavioural Research in Accounting, Orlando, v. 17, n. 1, p. 43-53, Feb. 2005. DEARMAN, D. T.; SHIELDS, M. D. Cost knowledge and cost-based judgment performance. Journal of Management Accounting Research, Sarasota, v. 13, n. 1, p. 118, Dec. 2001. DRURY, C.; TAYLES, M. Product costing in UK manufacturing organizations. European Accounting Review, London, v. 3, n. 3, p. 443470, Jan. 1994. GEER, E. V.; TUIJL, H. F. J. M.; RUTTE, C. G. Performance management in healthcare: performance indicator development, task uncertainty, and types of performance indicators. Social Science & Medicine, Oxford, v. 69, n. 10, p. 1523–1530, Nov. 2009. GERDIN, J.; GREVE, J. The appropriateness of statistical methods for testing contingency hypotheses in management accounting research. Accounting, Organizations and Society, Oxford; New York, v. 33, n. 7-8, p. 995-1009, Oct./Nov. 2008. GHOSH, B. C.; CHAN, Y. K. Management accounting in Singapore: well in place? Managerial Auditing Journal, Bradford, v. 12, n. 1, p. 1618, 1997. HALDMA, T.; LÄÄTS, K.. Contingencies influencing the management accounting practices of Estonian manufacturing companies. Management Accounting Research, Sarasota, v. 13, n. 4, p. 379-400, Dec. 2002. HERATH, H. S. B.; BREMSER, W. G.; BIRNBERG, J. G. Joint selection of balanced. 144 Rev. bus. manag., São Paulo, Vol. 15, No. 46, pp. 129-148, jan./mar. 2013.
(17) Balanced Scorecard: an empirical study of small and medium size enterprises. scorecard targets and weights in a collaborative setting. Journal of Accounting and Public Policy, New York, v. 29, n. 1, p. 45-59, Jan./ Feb. 2010. HILL, M. M.; HILL, A. Investigação por questionário. 2. ed. Lisboa: Sílabo, 2002. H O P PE R , T. ; A R M S T RO N G , P. C o s t accounting, controlling labour and the rise of conglomerates. Accounting, Organizations and Society, Oxford; New York, v. 16, n. 5-6, p. 405-438, 1991. ______; EFFERIN, S. Management control, culture and ethnicity in a chinese indonesian company. Accounting, Organizations and Society, Oxford; New York, v. 32, n. 3, p. 223223, Apr. 2007. H U M P H R E Y, C . ; S C A P E N S , R . W. Methodological themes: theories and case studies of organizational accounting practices: limitation or liberation? Accounting Auditing & Accountability Journal, Bradford, v. 9, n. 4, p. 86-106, 1996. INSTITUTO DE APOIO ÀS PEQUENAS E MÉDIAS EMPRESAS E AO INVESTIMENTO - IAPMEI. Estrutura empresarial nacional. Lisboa: Gabinete de Estudos, 2002. ______. Sobre as PME’s em Portugal. Lisboa: Direcção de Planeamento e Estudos, 2008. INNES, J.; MITCHELL, F. A survey of activitybased costing in the U.K.’s largest companies. Management Accounting Research, Sarasota, v. 6, n. 2, p. 137-153, June 1995. ______; ______; SINCLAIR, D. Activitybased costing in the U.K.’s largest companies: a comparison of 1994 and 1999 survey results. Management Accounting Research, Sarasota, v. 11, n. 3, p. 349-362, Sept. 2000. IT TNER C. D.; L ARCKER, D. F. Are nonfinancial measures leading indicators of financial performance?: an analysis of customer. satisfaction. Journal of Accounting Research, Chicago, v. 36, p. 1-35, 1998. ______; ______; MEYER, M. W. Subjectivity and the weighting of performance measures: evidence from a balanced scorecard. The Accounting Review, Sarasota, v. 78, n. 3, p. 725-758, July 2003. HENRI, J.-F. The periodic review of performance indicators: an empirical investigation of the dynamism of performance measurement systems. European Accounting Review, London, v. 19, n. 1, p. 73-96, May 2010. JOHANSON, U. et al. Balancing dilemmas of the balanced scorecard. Accounting, Auditing & Accountability Journal, Bradford, v. 19, n. 6, p. 842-857, Nov. 2006. JOSHI, P. L. The international diffusion of new management accounting practices: the case of India. Journal of International Accounting Auditing & Taxation, Greenwich, v. 10, n. 1, p. 85-109, Spring 2001. JUHMANI, O. Usage, motives and usefulness of the Balanced Scorecard: evidence from Bahrain. International Journal of Business Research, Kathmandu; Hayward, v. 7, n. 5, p. 106-117, Sept. 2007. KAPLAN, R. S. Devising a balanced scorecard matched to business strategy. Strategy & Leadership, Bradford, v. 22, n. 5, p. 15-48, Sept./ Oct. 1994. ______; NORTON, D. P. The balanced scorecard: measures that drive performance. Harvard Business Review, Boston, v. 70, n. 1, p. 71-79, Jan./Feb. 1992. ______; ______. The balanced scorecard: translating strategy into action. Boston: Harvard Business School Press, 1996b. ______; ______. Leading change with the balanced scorecard. Financial Executive, Morristown, v. 17, n. 6, p. 64-66, Sept. 2001a.. 145 Rev. bus. manag., São Paulo, Vol. 15, No. 46, pp. 129-148, jan./mar. 2013.
(18) Maria João Cardoso Vieira Machado. ______; ______. Liking de balanced scorecard to strategy. California Management Review, Berkeley, v. 39, n. 1, p. 53-79, Fall 1996c. ______; ______. Putting the balanced scorecard to work. Harvard Business Review, Boston, v. 71, n. 5, p. 134-147, Sept./Oct.1993. ______; ______. Strategic learning & the balanced scorecard. Harvard Business Review, Boston, v. 24, n. 5, p. 18-24, Sept./Oct. 1996d. ______; ______. Transforming the balanced scorecard from performance measurement to strategic management: part I. Accounting Horizons, Sarasota, v. 15, n. 1, p. 87-104, Mar. 2001b. ______; ______. Transforming the balanced scorecard from performance measurement to strategic management: part II. Accounting Horizons, Sarasota, v. 15, n. 2, p. 147-160, June 2001c.. LIBBY T.; SALTERIO, S. E.; WEBB, A. The balanced scorecard: the effects of assurance and process accountability on managerial judgment. The Accounting Review, Sarasota, v. 79, n. 4, p. 1075-1094, Oct. 2004. ______; WATERHOUSE, J. H. Predicting change in management accounting systems. Journal of Management Accounting Research, Sarasota, v. 8, p. 137-150, 1996. LIEDTKA, S. L.; CHURCH, B. K.; RAY, M. R. Performance variability, ambiguity intolerance, and balanced scorecard-based performance assessments. Behavioral Research in Accounting, Sarasota, v. 20, n. 2, p. 73-88, Fall 2008. LIPE, M. G.; SALTERIO, S. E. The balanced scorecard: judgmental effects of common and unique performance Measures. The Accounting Review, Sarasota, v. 75, n. 3, p. 283-298, July 2000.. ______; ______. Using the balanced scorecard as a strategic management system. Harvard Business Review, Boston, v. 74, n. 1, p. 75-85, Jan./Feb.1996a.. ______; ______. A note on the judgmental effects of the balanced scorecard’s information. Accounting, Organizations and Society, Oxford; New York, v. 27, n. 6, p. 531-540, Aug. 2002.. ______; ______; BJARNE, R. Managing alliances with the balanced scorecard. Harvard Business Review, Boston, v. 88, n. 1-2, p. 114120, Jan./Feb. 2010.. LUFT, J. Nonfinancial Information and Accounting: A Reconsideration of Benefits and Challenges. Accounting Horizons, v. 23, n.3, p. 307–325, 2009.. KAPLAN, S.; WISNER, P. The judgmental effects of management communications and a fifth balanced scorecard category on performance evaluation. Behavioral Research in Accounting, Sarasota, v. 21, n. 2, p. 37-56, Fall 2009.. MACARTHUR, J. Cultural influences on German versus U.S. management accounting practices. Management Accounting Quarterly, Montale, v. 7, n. 2, p. 10-16, Winter 2006.. KRAUS, K.; LIND, J. The impact of corporate balanced scorecard on corporate control: a research note. Management Accounting Research, Sarasota, v. 21, n. 4, p. 265-277, Dec. 2010.. MALINA M. A.; SELTO, F. H. Communicating and controlling strategy: an empirical study of the effectiveness of the balanced scorecard. Journal of Management Accounting Research, Sarasota, v. 13, n. 1, p. 47-90, Dec. 2001.. LAUGHLIN, R. C. Accounting systems in organisational contexts: a case for critical theory. Accounting, Organizations and Society, Oxford; New York, v. 12, n. 5, p. 479-502, 1987.. MALMI, T. Balanced scorecards in finnish companies: a research note. Management Accounting Research, Sarasota, v. 12, n. 2, p. 207-220, June 2001.. 146 Rev. bus. manag., São Paulo, Vol. 15, No. 46, pp. 129-148, jan./mar. 2013.
(19) Balanced Scorecard: an empirical study of small and medium size enterprises. MARTIN, J. D.; PETTY, J. W. Value based management: the corporate response to the shareholder revolution. Boston: Harvard Business School Press, 2000. MCPHAIL, R.; HERINGTON, C.; GUILDING, C. Human resource managers perceptions of the applications and merit of the balanced scorecard in hotels. International Journal of Hospitality Management, Kidlington, v. 27, n. 4, p. 623631, Dec. 2008. MILLER, P.; O’LEARY, T. Accounting and the construction of the governable person. Accounting, Organizations and Society, Oxford; New York, v. 12, n. 3, p. 235-265, 1987. NEUMANN, B. R.; ROBERTS, M. L.; CAUVIN, E. Information search using the balanced scorecard: what matters? The Journal of Corporate Accounting & Finance, New York, v. 21, n. 3, p. 61-66, Mar./Apr. 2010. NORTHCOTT, D.; SMITH, J. Management performance at the top: a balanced scorecard for boards of directors. Journal of Accounting & Organizational Change, Bradford, v. 7, n. 1, p. 33-56, 2011. N O R R E K L I T, H . T h e b a l a n c e o n t h e balanced scorecard: a critical analysis of some of its assumptions. Management Accounting Research, Sarasota, v. 11, n. 1, p. 65-88, Mar. 2000. ______. The balanced scorecard: what is the score?: a rhetorical analysis of the balanced scorecard. Accounting, Organizations and Society, Oxford; New York, v. 28, n. 6, p. 591619, Aug. 2003. OTLEY, D. The contingency theor y of management accounting: achievement and prognosis. Accounting, Organizations and Society, n. 5, p. 413-428, 1980. PANDEY, I. M. Balanced scorecard: myth and reality. Vikalpa, Ahmadabad, v. 30, n. 1, p. 5166, Jan./Mar. 2005.. QIAN, W.; BURRITT, R.; MONROE, G. Environmental management accounting in local government: a case of waste management. Accounting, Auditing & Accountability Journal, Bradford, v. 24, n. 1, p. 93-128, 2011. QUESADO, P. R.; RODRIGUES, L. L. Factores determinantes na implementação do balanced scorecard em Portugal. Revista Universo Contábil, Blumenau, v. 5, n. 4, p. 94-115, out./ nov. 2009. RIAHI-BELKAOUI, A. Accounting theory. 4th ed. London: Thomson Learning, 2000. ROBERTS, M. L.; ALBRIGHT, T. L.; HIBBETS, A. R. Debiasing balanced scorecard evaluations. Behavioural Research in Accounting, Orlando, v. 16, n. 1, p. 75-88, Feb. 2004. SCAPENS, R. W. Researching management accounting practice: the role of case study methods. The British Accounting Review, [Bangor] v. 22, n. 3, p. 259-281, Sept. 1990. SHIELDS, M. D. Management accounting practices in Europe: a view from the states. Management Accounting Research, Sarasota, v. 9, n. 4, p. 501-513, Dec. 1998. SPECKBACHER G.; BISCHOF, J.; PFEIFFER, T. A descriptive analysis on the implementation of balanced scorecards in German-speaking countries. Management Accounting Research, Sarasota, v. 14, n. 4, p. 361-387, Dec. 2003. SUNDIN, H.; GRANLUND, M.; BROWN, D. A. Balancing multiple competing objectives with a balanced scorecard. European Accounting Review, London, v. 19, n. 2, p. 203246, 2010. TAYLER, W. B. The balanced scorecard as a strategy-evaluation tool: the effects of implementation involvement and a causal-chain focus. The Accounting Review, Sarasota, v. 85, n. 3, p. 1095-1117, May 2010. TILLING, M. V.; TILT, C. A. Alas poor critical accounting, we knew him, Karl. Critical. 147 Rev. bus. manag., São Paulo, Vol. 15, No. 46, pp. 129-148, jan./mar. 2013.
(20) Maria João Cardoso Vieira Machado. Perspectives on Accounting, London, v. 15, n. 4-5, p. 557-563, May/July 2004. VILA, M.; COSTA, G.; ROVIRA, X. The creation and use of scorecards in tourism planning: a spanish example. Tourism Management, Oxford, v. 31, n. 2, p. 232-239, Apr. 2010. YANG, H. L. ; YANG, G. G. L.; WEI-PANG, W. Employee demography moderate involvement of decision making and adoption of management accounting innovations for chinese accountants. Journal of American Academy of Business, Hollywood, v. 9, n. 2, p. 338-343, Sept. 2006. YOUNG, S. M.; STEDE, W. A. V.; CHEN, C. X. Assessing de quality of evidence in empirical management accounting research: the case of survey studies. Accounting, Organizations and Society, Oxford; New York, v. 30, n. 7-8, p. 655684, Oct./Nov. 2005. WATTS, R. L.; ZIMMERMAN, J. L. Positive accounting theory: a ten year perspective. Accounting Review, Sarasota, v. 65, n. 1, p. 131-156, Jan. 1990.. WIDENER, S. K. An empirical investigation of the relation between the use of strategic human capital and the design of the management control system. Accounting, Organizations and Society, Oxford; New York, v. 29, n. 3-4, p. 377-399, Apr./May 2004. WIERSMA, E. For which purposes do managers use balanced scorecards?: an empirical study. Management Accounting Research, Sarasota, v. 20, n. 4, p. 239-251, Dec. 2009. WOODS, M. A contingency theory perspective on the risk management control system within birmingham city council. Management Accounting Research, Sarasota, v. 20, n. 1, p. 69-81, Mar. 2009. WONG-ON-WING, B. et al. Reducing conflict in balanced scorecard evaluations. Accounting, Organizations and Society, Oxford; New York, v. 32, n. 4-5, p. 363-377, May/July 2007. ZIMMERMAN, J. L. Conjectures regarding empirical managerial accounting research. Journal of Accounting and Economics, Amsterdam, v. 32, n. 1-3, p. 411-427, Dec. 2001.. 148 Rev. bus. manag., São Paulo, Vol. 15, No. 46, pp. 129-148, jan./mar. 2013.
(21)
Imagem
+3

Documentos relacionados