M
ESTRADO
C
ONTABILIDADE
,
F
ISCALIDADE E
F
INANÇAS
E
MPRESARIAIS
T
RABALHO
F
INAL DE
M
ESTRADO
D
ISSERTAÇÃO
T
HE
R
ELATIONSHIP
B
ETWEEN
D
EBT
F
INANCING AND
E
ARNINGS
M
ANAGEMENT
:
E
UROPEAN
E
VIDENCE
M
ESTRADO EM
C
ONTABILIDADE
,
F
ISCALIDADE E
F
INANÇAS
E
MPRESARIAIS
T
RABALHO
F
INAL DE
M
ESTRADO
D
ISSERTATION
T
HE
R
ELATIONSHIP
B
ETWEEN
D
EBT
F
INANCING AND
E
ARNINGS
M
ANAGEMENT
:
E
UROPEAN
E
VIDENCE
T
ÂNIA
A
LEXANDRA
S
ANTOS
P
INTO
O
RIENTAÇÃO:
Agradecimentos
Agradeço à minha orientadora, Professora Doutora Cristina Gaio, pela
disponibilidade, sugestões e ajuda neste trabalho e ao longo de 2 anos de Mestrado.
Agradeço também a todos os professores de mestrado, pelo conhecimento e experiência
que me transmitiram.
Agradeço à minha mãe, ao meu pai, à minha irmã, ao Rafa e ao André por serem o meu
pilar na vida, por nunca me deixarem desistir e me apoiarem incondicionalmente.
Agradeço às minhas amigas, Cris, Poças e Marta, por acreditarem sempre em mim e
pela amizade e carinho, não só nesta etapa, mas ao longo da minha vida.
Agradeço às minha amigas Ana, Mafalda e Cláudia pela ajuda ao longo do Mestrado,
por me darem auxilio nas piores horas e, acima de tudo, pela amizade.
Abstract
This study has the purpose of analyzing the relationship between debt financing and earnings management on European listed companies, since previous literature report mixed results about the influence of debt financing on earnings management. The sample is composed by 1278 listed companies from 13 European countries, between 2007 and 2016. Through this research it is tried to discover if the influence of debt financing on earnings management is negative, positive or both, suggesting a non-linear relationship. The results suggest that the influence of debt on earnings management is positive and that, the relationship between debt financing and earnings management is linear. Results
also propose that earnings quality is negatively influenced by firm’s low profitability and
positively influenced by firm’s return on assets.
Resumo
O propósito deste estudo é analisar a relação entre o endividamento e a qualidade dos resultados nas empresas cotadas Europeias, visto que, estudos anteriores apresentam opiniões díspares relativamente à influência do endividamento na gestão de resultados. A amostra é composta por 1278 empresas cotadas de 13 países Europeus, sendo o período de análise de 2007 a 2016. Através desta análise, pretende-se descobrir se a influência do endividamento na gestão de resultados é negativa, positiva ou ambas, sugerindo uma relação não linear. Os resultados sugerem que a influência é positiva e, consequentemente, que a relação existente entre estas duas variáveis é linear. Os resultados propõem também que a gestão dos resultados é influenciada negativamente pela baixa rentabilidade e positivamente pela rendibilidade do ativo.
Palavras-chave: qualidade dos resultados; gestão de resultados; qualidades dos
Contents
Agradecimentos ... i
Abstract ... ii
Resumo ... iii
List of Tables ... v
List of Figures ... vi
Acronyms ... vii
1. Introduction ... 1
2. Literature Review ... 3
2.2. Relationship Between Debt Financing and Earnings Management ... 5
2.2.1. Negative Influence of Debt on Earnings Management ... 5
2.2.2. Positive Influence of Debt on Earnings Management ... 6
2.3. Research Question ... 7
3. Methodology and Data ... 8
3.1. The Earnings Management Measure ... 8
3.2. Model and Variables ... 10
3.3. Data and Sample... 12
4. Results ... 14
4.1. Descriptive Statistics ... 14
4.2. Correlation Matrix ... 17
4.3. Regression Results ... 18
4.4. Robustness Analysis ... 22
5. Conclusions ... 23
5.1. General overview of the study ... 23
5.2. Limitations ... 24
5.3. Further Research... 25
List of Tables
Table I - Sample composition by industry ... 13
Table II - Sample composition by country ... 14
Table III - Variables descriptive statistics... 15
Table IV - Residuals Across Debt Quintiles ... 16
Table V - Variables Correlation Matrix ... 18
Table VI - Debt Financing and Earnings Management: Multivariate Results ... 19
Table VII - Debt Financing and Earnings Management: Regression Methods ... 20
List of Figures
Acronyms
IAS – International Accounting Standards ROA – Return on assets
1.
Introduction
The challenges of a twenty-one-century company are focused on economic development and especially in the financial globalization. Firms are in the presence of a global market, as they are interconnected with the global system, which is open to all the companies and encourages the flow of goods, capital and services. Since they have the need to adapt to this reality, companies became more competitive and aware to the market to be able to survive and grow. This necessity becomes stronger with the available access to financial information, since the external stakeholders demand higher quality to the process of decision making (Ball & Shivakumar, 2005), being the earnings quality a major factor of choice.
During the financial reporting process, managers have the opportunity to manage earnings, due to the flexibility and subjectivity of accounting standards. They can make the financial report look different from the reality, using the estimations and measurements in their behalf and make it appear appellative to the market. Therefore, earnings management is considered an intentional practice that mislead the external user of the information with the drive to obtain some private gain (Schipper, 1998). As such, firms are motivated to incur in this kind of practices.
However, firms can not only use the flexibility that the standards provide, they can also violate them and incur in fraud. There are multiple examples of cases like this in the last few years, which increases the uncertainty related to financial reporting.
The Relationship Between Debt Financing and Earnings Management
differences between the reality and what was actually reported can be explained by the demand to fulfil the expectations of the market (Pope, 2003).
The aims of this research are focus on the study of the relationship between debt financing and earnings management and the analysis of the influence of debt on earnings management, since it was only a considered focus of research by Ghosh & Moon (2010), that studied it in USA listed companies. Therefore, this research focus in European listed companies and it proposes to find if this relationship exists and how it behaves.
The sample used is composed by 1278 listed companies from 13 European countries, and the observations are referred to the period between 2007 and 2016. As a proxy for earnings management, it was defined the amount of discretionary accruals obtained through the Jones model (Jones, 1991) modified by Dechow et al. (1995).
The results of this study indicate that the level of debt is positively associated with earnings management, suggesting that companies with more debt financing incur in more earnings management practices. The hypothesis of a nonlinear relationship between the debt financing and earnings managemnt isn’t supported. The results also suggest that companies with higher cost of debt, more losses and lower return on assets have more earnings management practices.
The remaining of this study is divided in 4 chapters. The subsequent chapter (chapter 2) gives some fundamental concepts to the study and summarize the previous literature that support this research and consider the relationship between debt financing and earnings management. Chapter 3 reveals the main hypothesis of the investigation, the selected data and its characterization and, finally, the methodology used. The following chapter (chapter 4) contemplates the discussion and analysis of the results. To finish, the last chapter is the 5th and holds the final conclusions, the limitations of the study and the suggestions for future research.
2.
Literature Review
2.1.
Earnings Quality
As IAS 1 defines, the role of the financial report is to give information that helps users to make economic decisions. The financial report information reduces the agency conflicts between the company and the external stakeholders (Healy & Palepu, 2001). Additionally, Francis et al. (2003) consider earnings as the principal performance metric used by investors and analysts and Corina & Miculescu (2012) argue that earnings influence the process of decision making. Subsequently, capital market participants only make good judgments and decisions based on high quality financial reports. This makes the earnings quality a summary indicator of a decision made (Francis et al., 2008). Also, Dechow & Schrand (2004, p.5) deliberate that “high quality earnings reflect the
company’s current operating performance, is a good indicator of future operating
The Relationship Between Debt Financing and Earnings Management
(Bhattacharya et al., 2013), which prove the importance of high quality financial statements in the process of economic decisions (Ball & Shivakumar, 2005).
Healy & Wahlen (1999, p. 368) define that “earnings management occurs when managers use judgment in financial reporting and in structuring transactions to alter financial reports to either mislead some stakeholders about the underlying economic performance of the company or to influence contractual outcomes that depend on reported
accounting numbers”. In this context, Schipper (1998) suggested that, when incurring in earnings management, managers have “the intent of obtaining some private gain”.
Beneish (2001) propose the existence of two perspectives of earnings management: the opportunistic perspective that focus on the use of the accounting information with the intent to mislead the investors and the information perspective that aims to give the knowledge about the managers’ expectations of the future firm’s cash flows.
2.2.
Relationship Between Debt Financing and Earnings
Management
2.2.1.
Negative Influence of Debt on Earnings Management
Jensen & Meckling (1976) propose that managers may act in their own interest and not in the shareholder’s interest. In that way, shareholders can mitigate the agency conflicts by stablishing incentives for the managers. Yet, they do not monitor the behavior of management because the costs are higher than the benefits that it brings. On the contrary, private debt lenders, especially banks, are specialized in monitoring borrowers and mitigating agency conflicts (Diamond, 1984). Diamond (1984) consider that banks act like a delegated monitor, since they evaluate whom they lend to and have the ability to control the opportunistic behavior of managers.
According to Jensen (1986), debt works like a monitoring device as it reduces the agency costs of Free Cash Flow by decreasing the Cash Flow that is available for managers to control. In other words, managers won’t invest in bad projects and waste resources as debt cuts the cash flow available for non-profitable investments. Similarly, Grossman & Hart (1982) see debt as a disciplinary instrument. By issuing debt, firms create the possibility of bankruptcy which makes managers act in shareholders’ interest, the market recognize this possibility and firm’s market value increases. Managers are willing to take the risk of bankruptcy because they benefit with the increase of market value of the firm, since their salaries depend on it, the probability of a takeover bid would be smaller, and it would be easier to raise capital.
The Relationship Between Debt Financing and Earnings Management
evidence that firms with low accounting quality experience higher costs of debt and García-teruel et al. (2010) suggest that firms with poor earnings quality face shorter debt maturities.
Finally, Feltham et al. (2007) suggest that debt incentives firms to provide accounting information with higher quality and argue that accounting precision is positively related to debt.
In sum, lenders demand higher quality accounting information, since it reduces the credit risk and managers can reduce the costs of borrowing if they act in the interest of debtholders and shareholders. Therefore, all these arguments suggest that there is a positive influence of debt on earnings quality.
2.2.2.
Positive Influence of Debt on Earnings Management
Debt and earnings quality can also be related negatively. As suggest by An et al. (2016), firms that frequently manage earnings have higher financial leverage.
Regarding the agency problem, managers may not act in the interest of debtholders, thus contractual arrangements are made, usually based on accounting
Moreover, when managers face a high level of debt they have incentives to use the financial statements as a way to reduce the prospect of violating debt covenants (Dechow & Dichev, 2002; Beatty et al., 2010). Therefore, firms are willing to reduce the quality of accounting information to avoid debt covenant violations (Feltham et al., 2007). Besides that, earnings quality is important to make decisions about the firm’s capital structure. This happens because, if a company has high quality information, it uses more equity financing, instead of debt financing (Chen et al., 2016). In that context, companies that present high earnings quality choose to be financed with equity and companies with poor earnings quality have to resort to debt financing. Although, in order to better access to capital debt markets, managers tend to use earnings management to make the firm look more attractive and healthy (Iatridis & Kadorinis, 2009).
In sum, firms may practice earnings management to avoid debt covenants violation and to access to access capital markets. In this sense, it is expected high debt levels to be associated with low earnings quality.
2.3.
Research Question
The Relationship Between Debt Financing and Earnings Management
Thus, the main goal of this study is to analyze the relationship between debt financing and earnings management and answer to the following research question: Is the relationship between debt financing and earnings management linear?
3.
Methodology and Data
3.1.
The Earnings Management Measure
Several measures are used in the literature to evaluate earnings quality (Schipper & Vincent, 2003). Francis et al. (2004) considers that the accrual quality is the most valued between the earnings attributes. Besides that, this attribute provides measure about the
firm’s performance that can, more precisely, reflect the expected cash flows, making it a
good indicator of the earnings (Dechow, 1994).
Hence, the amount of discretionary accruals is used as a proxy of earnings quality and consequently earnings management and it were obtained through the Jones's model (1991) modified by Dechow et al. (1995).
Jones (1991) created a model that consider the total accruals, more specifically, the discretionary accruals as a measure of earnings management. The author considered that nondiscretionary accruals are constant and the change in the discretionary accruals is reflected essentially by the change in total accruals. Besides that, the model is a function of the change in revenue and the level of property, plant and equipment, since these variables control the change in nondiscretionary accruals, as they are an effect of the
changes on the firm’s economic conditions.
accruals. Therefore, Dechow et al. (1995) assume that the practice of earnings management is responsible for the changes in credit sales and suggested the following modified model (scaled by lagged assets as a way of reducing the heteroscedasticity):
𝐷𝑎𝑐𝑐
𝑖𝑡=
𝑇𝐴𝐴𝑖𝑡𝑖𝑡− (𝛼
𝑖[
𝐴1𝑖𝑡] + 𝛽
1𝑖∆𝑅𝐸𝑉𝑖𝑡𝐴−∆𝑅𝐸𝐶𝑖𝑡 𝑖𝑡+ 𝛽
2𝑖𝑃𝑃𝐸𝐴𝑖𝑡𝑖𝑡)
(1)
where,
𝐷𝑎𝑐𝑐𝑖𝑡 = Discretionary accruals in year t for firm i;
𝑇𝐴𝑖,𝑡= Total accruals in year t for firm i;
𝐴𝑖,𝑡= Total assets in year t from firm i;
∆𝑅𝐸𝑉𝑖𝑡= Revenues in year t less revenue in year t -1 for firm i;
𝑃𝑃𝐸𝑖𝑡= Gross property, plant and equipment in year t for firm i;
∆𝑅𝐸𝐶𝑖𝑡 = Net receivables in year t less net receivables in year t-1 from firm i.
To obtain the estimates of 𝛼𝑖, 𝛽1𝑖 and 𝛽2𝑖 (ai, b1i and b2i), to each sector, it was
used the ordinary least squares method. Total accruals where calculated through the traditional method used by Dechow et al. (1995):
𝑇𝐴𝑖𝑡 = ∆𝐶𝐴𝑖𝑡− ∆𝐶𝐿𝑖𝑡− ∆𝐶𝑎𝑠ℎ𝑖𝑡+ ∆𝑆𝑇𝐷𝑖𝑡− 𝐷𝑒𝑝𝑖𝑡 (2)
where,
𝑇𝐴𝑖𝑡= Total accruals in year t for firm i;
∆𝐶𝐴𝑖𝑡= Change in current assets in year t for firm i;
∆𝐶𝐿𝑖𝑡=Change in current liabilities in year t for firm i;
∆𝐶𝑎𝑠ℎ𝑖𝑡= Change in cash equivalents in year t for firm i;
∆𝑆𝑇𝐷𝑖𝑡= Change in debt included in current liabilities in year t for firm i;
The Relationship Between Debt Financing and Earnings Management
The discretionary accruals obtained through the described model (1) are presented in absolute value, since earnings management increases with both positive and negative discretionary accruals. Therefore, the quality of the report decreases as this value gets higher, since they are proportional.
3.2.
Model and Variables
The following model was used to answer the research question.
𝐷𝐴𝐶𝐶 = 𝛽0+ 𝛽1𝐷𝐸𝐵𝑇𝑖𝑡+ 𝛽2𝐷𝐸𝐵𝑇2𝑖𝑡+ 𝛽3𝐶𝑂𝑆𝑇𝐷𝐸𝐵𝑇𝑖𝑡+ 𝛽4𝐺𝑅𝑂𝑊𝑇𝐻𝑖𝑡+
𝛽5𝐿𝑂𝑆𝑆𝐸𝑆𝑖𝑡+ 𝛽6𝑅𝑂𝐴𝑖𝑡+ ∑ 𝐶𝑂𝑈𝑁𝑇𝑅𝑌𝑖+ ∑ 𝐼𝑁𝐷𝑈𝑆𝑇𝑅𝑌𝑖 + 𝜀𝑖𝑡 (3)
The discretionary accruals represent the dependent variable (DACC) and are used as a proxy of the earnings management.
To obtain the best model it was used three methods, the pooled OLS, the fixed effects (FE) and the random effects (RE). The importance of considering them is related with the fact that they are suitable to panel data, since it is expected to exist non-observable effects. Besides that, the random effects model assumes that the not observable effect isn’t correlated with the independent variables (Wooldridge, 2009). Thought the Hausman test it is possible to choose between the FE and the RE. Then, when the p-value is lower than 10% we accept that the FE is more suitable to the model. To prevent the existence of heteroscedasticity and autocorrelation of standard errors, the
robust and cluster (by country)options were selected.
DEBT and it is used as a way of perceiving if the relationship between the debt and the discretionary accruals is linear or not, following Ghosh & Moon (2010) among others.
According to Francis et al. (2005), the COSTDEBT focus on the relation between debt financing and financial distress, that could influence positively the earnings management, Ghosh & Moon (2010) also used it to study the same relation. This variable was obtained through the interest expense divided by the average total debt and it is expected to have a negative coefficient.
The variable GROWTH is used as a way to perceived the firm’s growth perspectives. Tendeloo & Vanstraelen (2008) and Boone et al. (2010) consider that firms with higher growth are positively associated with higher levels of earnings management. This suggests, that firms with higher performances have tendency to present poor earnings quality, as such it is expected a positive coefficient for this variable. The proxy used was calculated through the changes in sales from the prior year to the current year deflated by the prior year sales.
The variable ROA (Return on Assets) is used to measure the financial performance of the company as define by Kothari et al. (2005), being this variable able to evaluate the differences of the firm’s performance. Tendeloo & Vanstraelen (2008) argue that ROA has a negative effect on earnings management suggesting that companies with high levels of ROA have financial reports with higher quality. Therefore, the coeficient of this variable is expected to be negative. This variable is the ratio between net profit and total assets.
The Relationship Between Debt Financing and Earnings Management
the relation of firm’s characteristics with earnings quality, as they are influenced by the business models and operating environments. Consequently, it is expected to have a positive coefficient, since it has positive influence on earnings management.
Finally, the variables COUNTRY and INDUSTRY where used to control the effects
on earnings quality produced by the country’ characteristics and the type of industry as Tendeloo & Vanstraelen (2008) and Boone et al. (2010) detected. Besides that, the variable YEAR was also added as a control variable.
3.3.
Data and Sample
The data used to obtain the sample of this study, was collected from the database Amadeus in July of 2017. The sample was composed by 7477 companies listed from the 28-member states of European Union1, from 2007 to 2016. Accordingly with previous
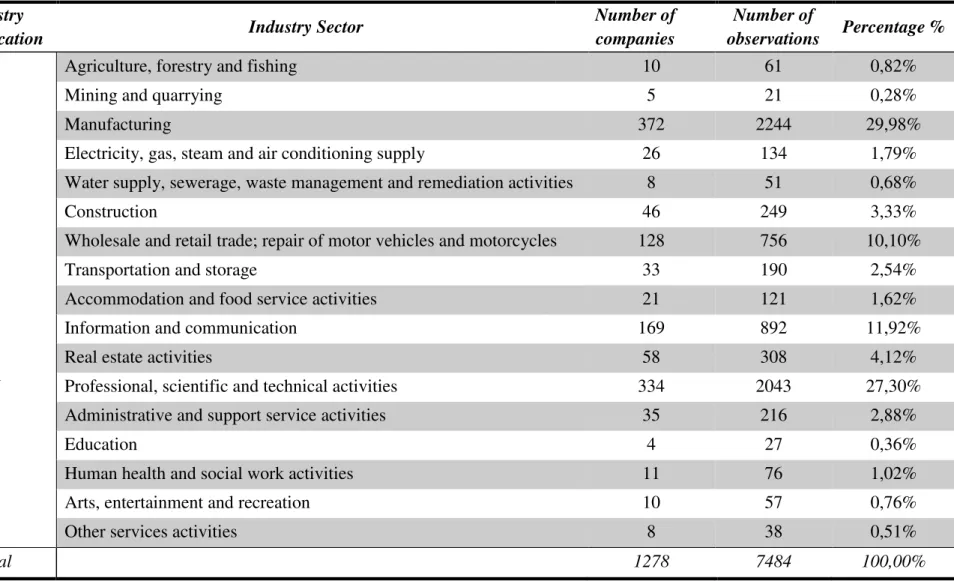
studies, it was necessary to exclude companies that practice financial and insurance activities and had public administration, since in these cases the accounting reports and regulation are different what makes the formation of accruals diverse too (Leuz et al., 2003; Osma & Noguer, 2005). Additionally, to eliminate all the outliers the data is insert between the 1th and 99th percentile. The final sample is composed by 1278 companies, 7484 observations, 17 industry sectors and 13 countries.
Table I - Sample composition by industry
Industry
Classification Industry Sector
Number of companies
Number of
observations Percentage %
A Agriculture, forestry and fishing 10 61 0,82%
B Mining and quarrying 5 21 0,28%
C Manufacturing 372 2244 29,98%
D Electricity, gas, steam and air conditioning supply 26 134 1,79%
E Water supply, sewerage, waste management and remediation activities 8 51 0,68%
F Construction 46 249 3,33%
G Wholesale and retail trade; repair of motor vehicles and motorcycles 128 756 10,10%
H Transportation and storage 33 190 2,54%
I Accommodation and food service activities 21 121 1,62%
J Information and communication 169 892 11,92%
L Real estate activities 58 308 4,12%
M Professional, scientific and technical activities 334 2043 27,30%
N Administrative and support service activities 35 216 2,88%
P Education 4 27 0,36%
Q Human health and social work activities 11 76 1,02%
R Arts, entertainment and recreation 10 57 0,76%
S Other services activities 8 38 0,51%
Total 1278 7484 100,00%
The Relationship Between Debt Financing and Earnings Management
Table II, presents the composition of the sample by country, where the more represented country is by France (36,01%), followed by Germany (23,70%) and Italy (14,85%).
Table II - Sample composition by country
Country Number of Companies
Number of
Observations Percentage %
Germany 294 1774 23,70%
France 442 2700 36,01%
Italy 184 1112 14,85%
Spain 75 485 6,48%
Portugal 6 6 0,08%
Finland 74 389 5,20%
Greece 113 691 9,23%
Luxembourg 8 21 0,28%
Austria 22 68 0,91%
Slovenia 11 39 0,52%
Netherland 11 11 0,15%
Belgium 16 72 0,96%
Slovakia 22 116 1,55% Total 1278 7484 100,00%
4.
Results
4.1.
Descriptive Statistics
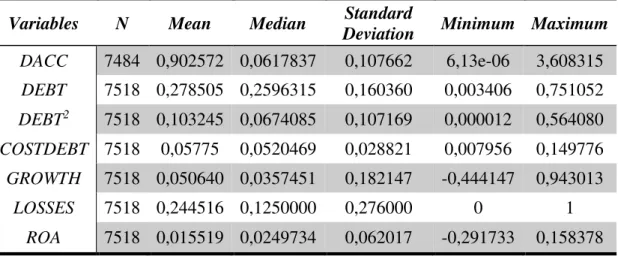
Table III - Variables descriptive statistics
Variables N Mean Median Standard
Deviation Minimum Maximum
DACC 7484 0,902572 0,0617837 0,107662 6,13e-06 3,608315
DEBT 7518 0,278505 0,2596315 0,160360 0,003406 0,751052
DEBT2 7518 0,103245 0,0674085 0,107169 0,000012 0,564080
COSTDEBT 7518 0,05775 0,0520469 0,028821 0,007956 0,149776
GROWTH 7518 0,050640 0,0357451 0,182147 -0,444147 0,943013
LOSSES 7518 0,244516 0,1250000 0,276000 0 1
ROA 7518 0,015519 0,0249734 0,062017 -0,291733 0,158378
Notes: DACC– Discretionary accruals in absolute value;
DEBT– Ratio of total Debt (long-term + short-term) to total assets in year t from firm i;
DEBT2– The square of the ratio of total Debt (long-term + short-term) to total assets in year t from firm i;
COSTDEBT– Interest expense deflated by total debt (long-term + short-term) in year t from firm i;
GROWTH – Change in sales from year t to year t-1 deflated by the year t-1 sales;
LOSSES– Portion of years with negative earnings from firm i;
ROA– Return on assets obtain through the net income deflated by total assets in year t from firm i.
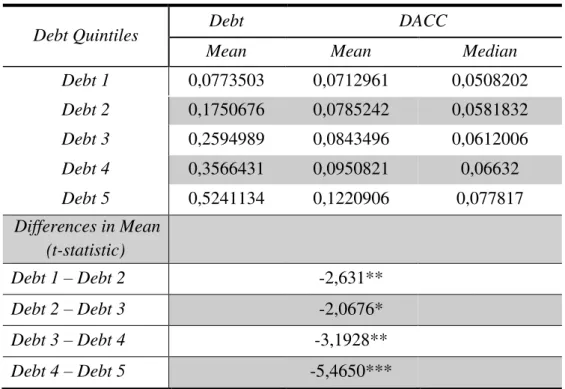
In addition, the sample was divided in five portfolios of Debt and it was used the discretionary accruals (DACC) as a proxy for earnings management. Like Table IV shows, Debt 1 represents the observations with the lowest debt levels where the mean was 0,077 and Debt 5 contains the observations with highest debt levels where the mean was 0,524.
Also, it was tested if the differences between the means of Debt 1 and Debt 2, Debt 2 and Debt 3, Debt 3 and Debt 4 and, finally, Debt 4 and Debt5 were statistically significant, which was confirmed by the outputs described in Table IV.
The Relationship Between Debt Financing and Earnings Management
Table IV - Residuals Across Debt Quintiles
Debt Quintiles Debt DACC
Mean Mean Median Debt 1 0,0773503 0,0712961 0,0508202
Debt 2 0,1750676 0,0785242 0,0581832
Debt 3 0,2594989 0,0843496 0,0612006
Debt 4 0,3566431 0,0950821 0,06632
Debt 5 0,5241134 0,1220906 0,077817
Differences in Mean (t-statistic)
Debt 1 – Debt 2 -2,631**
Debt 2 – Debt 3 -2,0676*
Debt 3 – Debt 4 -3,1928**
Debt 4 – Debt 5 -5,4650***
Notes: *, **, *** indicate the existence of statistical significance at the level of 5%, 1% and 0,01% respectively.
DACC– Discretionary accruals in absolute value;
DEBT– Ratio of total Debt (long-term + short-term) to total assets in year t from firm i.
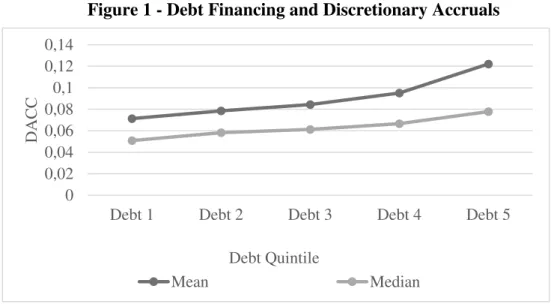
Figure 1 shows the relationship between the discretionary accruals (mean and median) and the debt quintiles. As one can see, the mean and the median discretionary accruals grows with the increase of debt. Moreover, comparing the increase percentage of the discretionary accruals between two consecutive debt quintiles, it is clear that the growth of discretionary accruals along the debt quintiles is not constant. The increase percentage between the last two consecutive debt quintiles is higher than in the other cases, which shows that the growth is not linear.
Notes:DACC– Discretionary accruals in absolute value;
DEBT– Ratio of total Debt (long-term + short-term) to total assets in year t from firm i.
4.2.
Correlation Matrix
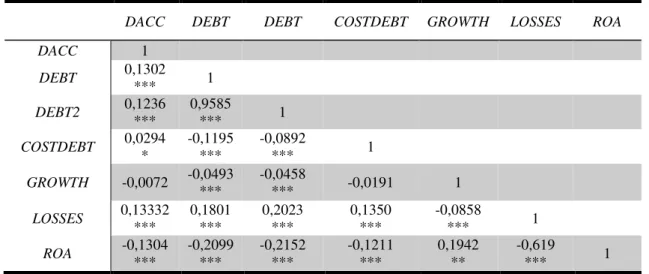
Table V presents the Pearson correlations between the variables of the model. The correlation between Debt and Debt2 is the higher, since this second variable is the square
of the first. Besides that, the other correlation values are lower than 0,22 suggesting that almost all the variables have a weak correlation with the others.
The dependent variable (DACC) is positively correlated with the variables DEBT, DEBT2, COSTDEBT and LOSSES and these correlations are statistically significant. On the other hand, it is negatively correlated with the variable GROWTH and ROA, but only the correlation with ROA is statistically significant. These results suggest that companies with higher levels of debt and cost of debt, with more periods of losses and lower growth have higher discretionary accruals.
0 0,02 0,04 0,06 0,08 0,1 0,12 0,14
Debt 1 Debt 2 Debt 3 Debt 4 Debt 5
DACC
Debt Quintile
Mean Median
The Relationship Between Debt Financing and Earnings Management
Table V - Variables Correlation Matrix
DACC DEBT DEBT COSTDEBT GROWTH LOSSES ROA
DACC 1
DEBT 0,1302
*** 1
DEBT2 0,1236
***
0,9585
*** 1
COSTDEBT 0,0294
*
-0,1195 ***
-0,0892
*** 1
GROWTH -0,0072 -0,0493
***
-0,0458
*** -0,0191 1
LOSSES 0,13332
*** 0,1801 *** 0,2023 *** 0,1350 *** -0,0858
*** 1
ROA -0,1304
*** -0,2099 *** -0,2152 *** -0,1211 *** 0,1942 ** -0,619
*** 1 Notes: *, **, *** indicate the existence of statistical significance at the level of 5%, 1% and 0,01% respectively.
DACC– Discretionary accruals in absolute value;
DEBT– Ratio of total Debt (long-term + short-term) to total assets in year t from firm i;
DEBT2– The square of the ratio of total Debt (long-term + short-term) to total assets in year t from firm i;
COSTDEBT– Interest expense deflated by total debt (long-term + short-term) in year t from firm i;
GROWTH – Change in sales from year t to year t-1 deflated by the year t-1 sales;
LOSSES– Portion of years with negative earnings from firm i;
ROA– Return on assets obtain through the net income deflated by total assets in year t from firm i.
4.3.
Regression Results
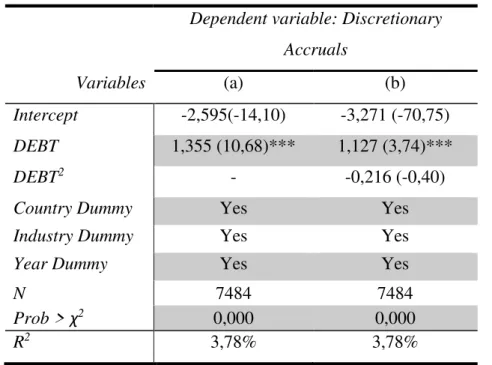
The results from the regressions (executed in STATA 13) are presented in Table VI and Table VII. Table VI presents the results of regressions that comprehend only
DEBT and DEBT2. The first column, (a), represents a univariate model using only debt as an independent variable. Debt serves as a point of reference for the relationship between earnings management and debt financing. In this model, it was obtained a statistically significant and positive coefficient for DEBT, which supports the idea that earnings management increases in the presence of debt. Therefore, the results of this univariate model suggest a positive relation between debt financing and earnings management.
statistically significant, although the coefficient of DEBT2 is not statistically significant. These results do not confirm the hypothesis of non-linear relationship between debt financing and earnings management which is consistent with the conclusions taken after analyzing Table IV and Figure I. When debt increases the financial report’s quality decreases, which propose a dominating positive influence of debt on earnings management. Thus, when managers face high debt levels, they are more likely to practice earnings management.
Table VI - Debt Financing and Earnings Management: Multivariate Results
Variables
Dependent variable: Discretionary Accruals
(a) (b)
Intercept -2,595(-14,10) -3,271 (-70,75)
DEBT 1,355 (10,68)*** 1,127 (3,74)***
DEBT2 - -0,216 (-0,40)
Country Dummy Yes Yes
Industry Dummy Yes Yes
Year Dummy Yes Yes
N 7484 7484
Prob > χ2 0,000 0,000
R2 3,78% 3,78%
Notes: *, **, *** indicate the existence of statistical significance at the level of 5%, 1% and 0,01% respectively.
Table reports the coefficients and the t-statistics in parenthesis.
DACC– Discretionary accruals in absolute value;
DEBT– Ratio of total Debt (long-term + short-term) to total assets in year t from firm i;
DEBT2– The square of the ratio of total Debt (long-term + short-term) to total assets in year t from firm i;
The Relationship Between Debt Financing and Earnings Management
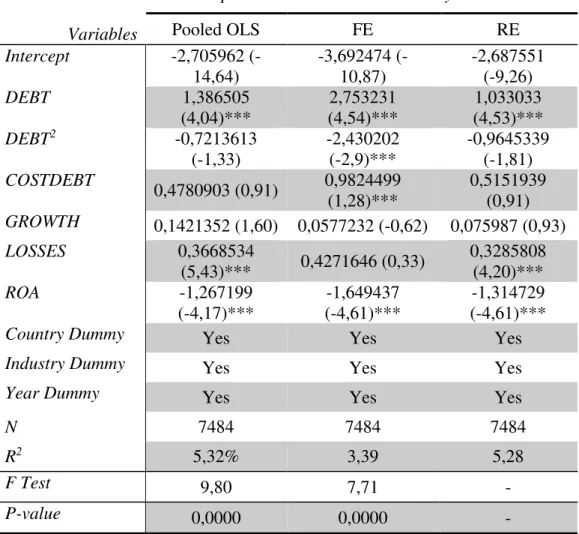
Effects. The results of this test conclude that the Fixed Effects is the model that gives the results with more assurance. Subsequently, to choose between the Pooled OLS and the Fixed Effects model it was used the F test. This test elected the Pooled OLS as the model that is more adaptable to this sample. Thus, this method is the one used to obtain the main results of this study.
Table VII - Debt Financing and Earnings Management: Regression Methods
Variables
Dependent variable: Discretionary Accruals
Pooled OLS FE RE
Intercept -2,705962 (-14,64)
-3,692474 (-10,87)
-2,687551 (-9,26)
DEBT 1,386505 (4,04)***
2,753231 (4,54)***
1,033033 (4,53)***
DEBT2 -0,7213613
(-1,33) -2,430202 (-2,9)*** -0,9645339 (-1,81) COSTDEBT
0,4780903 (0,91) 0,9824499 (1,28)***
0,5151939 (0,91)
GROWTH 0,1421352 (1,60) 0,0577232 (-0,62) 0,075987 (0,93) LOSSES 0,3668534
(5,43)*** 0,4271646 (0,33)
0,3285808 (4,20)***
ROA -1,267199
(-4,17)***
-1,649437 (-4,61)***
-1,314729 (-4,61)***
Country Dummy Yes Yes Yes Industry Dummy Yes Yes Yes Year Dummy Yes Yes Yes
N 7484 7484 7484
R2 5,32% 3,39 5,28
F Test 9,80 7,71 -
P-value 0,0000 0,0000 -
Notes: *, **, *** indicate the existence of statistical significance at the level of 5%, 1% and 0,01% respectively.
Table reports the coefficients and the t-statistics (Pooled OLS and FE) or the z-statistics ( RE) in parenthesis.
DACC– Discretionary accruals in absolute value;
DEBT– Ratio of total Debt (long-term + short-term) to total assets in year t from firm i;
DEBT2– The square of the ratio of total Debt (long-term + short-term) to total assets in year t from firm i;
In comparison with model (a) and model (b) from Table VI, the coefficient of DEBT
becomes higher and persist statistically significant. This suggest that companies with higher debt practice more earnings management, which is consistent with Beatty & Weber (2003) and Dechow et al. (1995). Also, the DEBT2’s coefficient gets bigger but isn’t statistically significant which doesn’t support the hypothesis of the non-linear relationship between debt financing and earnings management, since the previous results contradict it. Therefore, in contrast with the expected, this results are not consistent with Ghosh & Moon (2010) findings about the USA companies.
Besides that, the LOSSES variable comprehends a positive coefficient too, which reinforce the idea that companies with negative results practice more earnings management than companies with positive earnings. This variable is also statistically significant to the model. Additionally, ROA, that represents the return on assets, has a statistically significant negative coefficient, which suggests a negative influence on earnings management. This proposes that, when the return on assets is higher, the earnings management practices are less frequent, which was expectable from the previous literature (Tendeloo & Vanstraelen, 2008).
Finally, only 5,32% of the change in the discretionary accruals (absolute value) is explained by the model variables. It is common in regressions like these, that use accruals as independent variable, to obtain lower values of R2 (Arun et al., 2015). Through the p-value of the F test (p-p-value = 0,00) it is possible to reject the null hypothesis and confirm that the model is valid to explain the change in the discretionary accruals.
The Relationship Between Debt Financing and Earnings Management
4.4.
Robustness Analysis
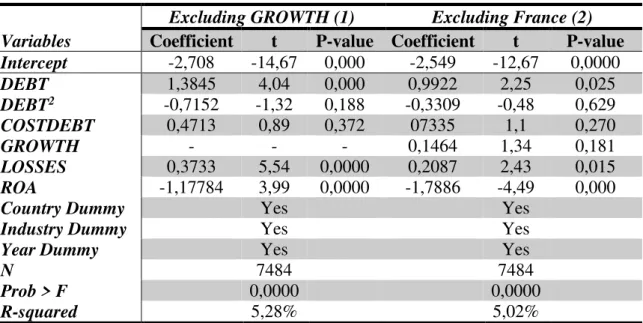
As a robustness analysis, were made some changes on the main regression. The
first change was to remove the variable that presented a coefficient that wasn’t statistically
significant, GROWTH. This alteration is important since, not only, this variable may be
declining the model’s explanatory power, but also, it is the only variable that presented values in the Person Correlation Matrix that had no statistical significance with DACC
and COSTDEBT. The results of this regression, presented in Table VIII, are identical with the ones obtained before. The R2 turns out to be smaller but this decrease is not
significant.
Table VIII - Robustness Analysis
Excluding GROWTH (1) Excluding France (2) Variables Coefficient t P-value Coefficient t P-value
Intercept -2,708 -14,67 0,000 -2,549 -12,67 0,0000 DEBT 1,3845 4,04 0,000 0,9922 2,25 0,025
DEBT2 -0,7152 -1,32 0,188 -0,3309 -0,48 0,629
COSTDEBT 0,4713 0,89 0,372 07335 1,1 0,270 GROWTH - - - 0,1464 1,34 0,181 LOSSES 0,3733 5,54 0,0000 0,2087 2,43 0,015
ROA -1,17784 3,99 0,0000 -1,7886 -4,49 0,000
Country Dummy Yes Yes
Industry Dummy Yes Yes
Year Dummy Yes Yes
N 7484 7484
Prob > F 0,0000 0,0000
R-squared 5,28% 5,02%
Notes: DACC– Discretionary accruals in absolute value;
DEBT– Ratio of total Debt (long-term + short-term) to total assets in year t from firm i;
DEBT2– The Square of the ratio of total Debt (long-term + short-term) to total assets in year t from firm i;
COSTDEBT– Interest expense deflated by total debt (long-term + short-term) in year t from firm i;
GROWTH – Change in sales from year t to year t-1 deflated by the year t-1 sales;
LOSSES– Portion of years with negative earnings from firm i;
ROA– Return on assets obtain through the net income deflated by total assets in year t from firm i.
representation could change the results obtained before. Through the results presented in Table VIII, it’s observable that they didn’t diverge from the previous models. The R2 becomes even smaller, although the general conclusions remain, and this part of the
sample didn’t mislead the results.
5.
Conclusions
5.1.
General overview of the study
The quality of the financial report is a factor of the utmost importance, as long
as it influences the decisions of the company’s stakeholders. The lack of earnings quality can mislead the market, as it gives the wrong perception of the company and make the investors incurring in wrong decisions. This quality can be affected by several factors, being one of them the Debt Financing.
The Relationship Between Debt Financing and Earnings Management
The results of this study suggest that European listed companies, in the presence of debt, practice more earnings management, which is consistent with the previous literature (An et al. ,2016) . Besides that, the hypothesis of the non-linear relationship between debt financing and earnings management is rejected, proposing that this behavior
doesn’t happen in European listed companies.
Additionally, it is conclusive that companies with more losses by year and with lower returns on assets have more discretionary accruals and consequently incur more in practices that denigrate the earnings quality.
The results of this study contribute to the literature about the earnings management and their relationship with the debt financing, specifically, in European listed companies.
5.2.
Limitations
This study has several limitations that could misleading the conclusions.
The first limitation deals with the difficulty of measuring the earnings management. Leuz et al. (2003) describe this process as problematic and hard, since it could manifest itself in diverse forms, something that is found in several studies of this nature.
The fact that, there was an economic crisis, that begun in the end of 2007, could make the behavior of companies, and their managers, change, as the comportment of banks on conceiving debt to companies. Consequently, this study conclusions can be misleading by this singularity.
Lastly, this study doesn’t make a distinction between the public and private debt,
5.3.
Further Research
The Relationship Between Debt Financing and Earnings Management
References
An, Z., Li, D. & Yu, J., 2016. Earnings management, capital structure, and the role of institutional environments. Journal of Banking & Finance, 68, pp.131–152.
Arun, T.G., Almahrog, Y.E. & Aribi, Z.A., 2015. International Review of Financial
Analysis Female directors and earnings management : Evidence from UK
companies. International Review of Financial Analysis, 39, pp.137–146.
Ball, R. & Shivakumar, L., 2005. Earnings quality in UK private firms: Comparative loss recognition timeliness. Journal of Accounting and Economics, 39(1), pp.83–128. Beatty, A., Liao, S. & Weber, J., 2010. Financial reporting quality, private information,
monitoring, and the lease-versus-buy decision. Accounting Review, 85(4), pp.1215– 1238.
Beatty, A. & Weber, J., 2003. The Effects of Debt Contracting on Voluntary Accounting Method Changes. The Accounting Review, 78(1), pp.119–142.
Beneish, M.D., 2001. Earnings management : A perspective. Managerial Finance, 27(12), pp.3–17.
Bhattacharya, N., Desai, H. & Venkataraman, K., 2013. Does Earnings Quality Affect
Information Asymmetry ? Evidence from Trading Costs.Contemporary Accounting
Research , 30(2), pp.482–516.
Boone, J.P., Khurana, I.K. & Raman, K.K., 2010. Do the big 4 and the second-tier firms provide audits of similar independence? Journal of Accounting and Public Policy, 29, pp.330–352.
Corina, M., & Nicolae M. (2012) Quality of accounting information to optimize the decisional process."Annals of Faculty of Economics, 1(2), pp.694–699.
Dechow, P.M., 1994. Accounting & Economics The role of accounting accruals. Journal of Accounting and Economics, 18, pp.3–42.
Dechow, P.M. & Dichev, I.D., 2002. The Quality Earnings of Accruals and Earnings: The of Role of Estimation Errors. The Accounting Review, 77, pp.35–59.
Dechow, P.M. & Schrand, C.M., 2004. Earnings quality. Monograph of the Research Foundation of CFA Institute, Charlottesville, Virginia.
Dechow, P.M., Sloan, R.G. & Sweeney, A., 1995. Detecting Earnings Management.
Accounting Review, pp.193–225.
Diamond, D., 1984. Financial intermediation and delegated monitoring. Review of Economic Studies, 51(3), pp.393–414.
Diamond, D., 1991. Monitoring and Reputation: The Choice between Bank Loans and Directly Placed Debt. Journal of Political Economy, 99(4), pp.689–721.
Feltham, G., Robb, S. & Zhang, P., 2007. Precision in accounting information, financial leverage and the value of equity. Journal of Business Finance and Accounting, 34(7– 8), pp.1099–1122.
Francis, J. et al., 2004. Cost of equity and earnings attributes. The Accounting Review, 79, pp.967–1010.
Francis, J. et al., 2005. The market pricing of accruals quality. Journal of Accounting and Economics, 39(2), pp.295–327.
Francis, J., Olsson, P. & Schipper, K., 2008. Earnings quality. Foundations and Trends® in Accounting, 1(4), 259-340.
The Relationship Between Debt Financing and Earnings Management
Power of Earnings and Alternative (to Earnings) Performance Measures for Returns.
Contemporary Accounting Research, 20(1), pp.121–164.
García-teruel, P.J., Martínez-Solano, P. & Sánchez-Ballesta, J.P., 2010. Accruals quality and debt maturity structure. Abacus, 46(2), pp.188–210.
Ghosh, A. & Moon, D., 2010. Corporate debt financing and earnings quality. Journal of Business Finance and Accounting, 37(5–6), pp.538–559.
Gopalakrishnan, V. & Parkash, M., 1995. Borrower and Lender Perceptions of Accounting Information in Corporate Lending Agreements. Accounting Horizons, 9, pp.13–26.
Grossman, S.J. & Hart, O.D., 1982. Corporate Financial Structure and Managerial Incentives,
Healy, P. m & Wahlen, J.M., 1999. A Review of the Earnings Management Literature and Its Implications for Standard Setting. Accounting horizons, 13(4), pp.365–383. Healy, P.M. & Palepu, K.G., 2001. Information asymmetry, corporate disclosure, and the capital markets: A review of the empirical disclosure literature. Journal of Accounting and Economics, 31(1–3), pp.405–440.
Iatridis, G. & Kadorinis, G., 2009. Earnings management and firm financial motives: A financial investigation of UK listed firms. International Review of Financial Analysis, 18(4), pp.164–173.
Jensen, M.C., 1986. Agency Costs of Free Cash Flow, Corporate Finance, and Takeovers.
The American economic review, 76(2), pp.323–329.
Accounting Research, 29(2), p.193.
Kothari, S.P., Leone, A.J. & Wasley, C.E., 2005. Performance matched discretionary accrual measures. Journal of Accounting and Economics, 39(1), pp.163–197. Leuz, C., Nanda, D. & Wysocki, P.D., 2003. Earnings management and investor
protection: an international comparison. Journal of financial economics , 69, pp.505– 527.
Osma, B.G. & Noguer, B., 2005. Corporate Governance and Earnings Management in Spain . Working Paper, Universitat Jaume I, Madrid.
Pope, P., 2003. Disclosure practices, enforcement of accounting standards, and analysts’
forecast accuracy: An International study. Journal of Accounting Research, 41(2), pp.273–283.
Schipper, K., 1989. Commentary on Earnings Management. Accounting Horizons, 3, pp.91–102.
Schipper, K. & Vincent, L., 2003. Earnings Quality. Accounting Horizons, 85, pp.97– 110.
Smith, C.W., 1993. A Perspective on Accounting- Based Debt Covenant Violations.
Accounting Review , 68(2), pp.289–303.
Tendeloo, B.V.A.N. & Vanstraelen, A.N.N., 2008. Earnings Management and Audit
Quality in Europe : Evidence from the Private Client Segment Market. European
Accounting Review , 17(3), pp.447–469.
Watts, R.L. & Zimmerman, J.L., 1990. Accounting Year Theory : Ten Year Perspective.
Review Literature And Arts Of The Americas, 65(1), pp.131–156.