EU Enlargement and the Portuguese Economy
Frank Barry*, Nuno Crespo** and M. Paula Fontoura***
* University College Dublin
** ISEG, Technical University of Lisbon
*** CEDIN and ISEG, Technical University of Lisbon
Abstract
:
Ten states, primarily from Central and Eastern Europe, will be admitted to the EU in 2004. The present paper assesses the competitiveness implications of this enlargement for Portugal. Four specific topics are considered: the trade and industry effects, the implications for Portugal’s ability to attract FDI, the likely levels and consequences of immigration from Central and Eastern Europe and the implications for Portugal’s budgetary relations with the rest of the EU.JEL Codes: F14, F15, F21, F22
Keywords: European Union, Enlargement, Portugal, Central and Eastern European
Countries.
Correspondence address: fontoura@iseg.utl.pt
1. Introduction
After the accession of Ireland, U.K. and Denmark in the 1970’s, Greece, Spain and
Portugal in the 1980’s and Sweden, Finland and Austria in the 1990’s, the EU’s border is
now expanding eastwards. Eight Central and Eastern European countries – the Czech
Republic, Hungary, Poland, Slovenia, Estonia, Latvia, Lithuania, Slovakia (the CEEC8)
– plus Malta and Cyprus will be full members in 2004. Romania and Bulgaria are
expected to accede in 2007. The opening of negotiations with Turkey remains conditional
on its meeting the political criteria for accession. Given the small size of the Maltese and
Cypriot economies, previous analyses on the subject have concentrated on the
implications of the accession of the CEEC only. This is also the position we adopt.
With Eastern enlargement, a region of about 100 million inhabitants emerging
from almost half a century of Soviet domination will be integrated into the EU. A
process of economic integration as profound and extensive as this will have far-reaching
implications for the current EU member states. As in any similar liberalisation process,
the lifting of trade barriers already accomplished under the Europe Agreements allows
for productive factors to be reallocated to more efficient activities, reflected in the
productive specialisation of the CEE countries and, by extension, in the volume and
pattern of their trade.1 International direct investment flows – in terms of volume and
geographical and sectoral distribution – will be further affected by accession, as will
overall industrial location. But the particular past of the CEE candidates poses entirely
new issues for the EU. First of all, the applicants are in a process of transition to the
market economy and much of the analysis of the impact of enlargement depends upon
assessments of the extent to which the process has been completed. Secondly, the
purpose is to integrate into the “rich man’s club” countries starting from very low levels
of income per head (39 % of the average in the EU15). The accession of Greece, Portugal
and Spain in the 1980s also brought relatively low-income partners into the Union,
1
though per-capita PPP-based income levels in those countries were already at about 62
percent of the levels pertaining to EU incumbents at that time.
The low level of economic development of the Eastern candidate countries and
the relatively large size of their agricultural sectors lie at the heart of most of the “high
profile” enlargement issues, such as the planned extension of the structural funds and
Common Agricultural Policy programmes, east-west migration and labour-market
effects. Thus, the pressure has been to establish transition periods before new members
achieve full access to regional and agricultural programmes. For example, the capping of
structural fund transfers to new members at the 4 % of their GDP, as decided by the
Berlin Council, is likely to be extended beyond 2006. Recent studies suggest that
enlargement should not put an unbearable strain on the EU budget, though the
distribution across member states is important. Accession of the CEEC is also expected
to lead to significant EU migration inflows, with the possibility of wage reductions and
job losses for unskilled incumbents.
Many studies have demonstrated that all of these issues are manageable and
should not cause substantial economic problems to the Union as a whole. Besides, the
benefits in terms of further trade integration and migration are substantial and will largely
outweigh the costs of accession at the EU aggregate level (Baldwin et al.,1997; Lejour et
al., 2001; Breuss, 2001). However difficulties may arise in the case of particular
members, particularly Portugal, as suggested, for instance, by Baldwin et al.(1997).
The present paper is a broad reflection on the economic impact of Eastern
enlargement on the Portuguese economy. Section 2 deals with external trade; Section 3
with inward FDI; Section 4 with migration flows and Section 5 with the Structural and
Cohesion Fund programmes. Section 6 concludes.
2. Trade Effects of Enlargement
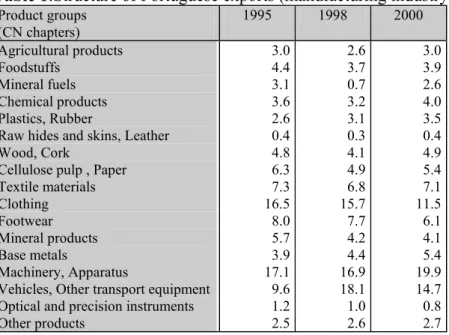
After Portuguese accession to the EU an important change in the country’s export
structure occurred. As shown in Table 1, the share of the labour intensive traditional
sectors (textiles, clothing, footwear) decreased, while the share of machinery, apparatus,
of foreign equity in Portuguese manufacturing – increased. In 2000, the weight of this
last group clearly overcame the traditional one (by 10 percentage points), a notable
feature considering the predominance of the latter in the past. However, at the end of the
1990s the weight of the traditional sector in total exports was still much higher for
Portugal than was the case for the EU average (respectively 30% and 6 % in the second
half of the 1990s).
Table 1:Structure of Portuguese exports (manufacturing industry) Product groups
(CN chapters)
1995 1998 2000 Agricultural products
Foodstuffs Mineral fuels Chemical products Plastics, Rubber
Raw hides and skins, Leather Wood, Cork
Cellulose pulp , Paper Textile materials Clothing Footwear Mineral products Base metals Machinery, Apparatus
Vehicles, Other transport equipment Optical and precision instruments Other products 3.0 4.4 3.1 3.6 2.6 0.4 4.8 6.3 7.3 16.5 8.0 5.7 3.9 17.1 9.6 1.2 2.5 2.6 3.7 0.7 3.2 3.1 0.3 4.1 4.9 6.8 15.7 7.7 4.2 4.4 16.9 18.1 1.0 2.6 3.0 3.9 2.6 4.0 3.5 0.4 4.9 5.4 7.1 11.5 6.1 4.1 5.4 19.9 14.7 0.8 2.7 Source: Instituto Nacional de Estatística (INE)
The Portuguese economy is highly open (with exports and imports summing to 75 percent of GDP), with most of the export and import flows taking place with the EU15
(80.3 and 75.1 % of total exports and imports, respectively, in 2000). This exceeds the
EU15 average by almost 20 percentage points (again evaluated over the second half of
the 1990s).
With the elimination of trade barriers between incumbents and accession states,
two effects on the Portuguese economy may be predicted: a trade creation effect in terms
of an increase in bilateral flows with the CEEC, and a shift effect, as CEE countries
displace some Portuguese exports to EU markets.2
2
The extent of pre-accession integration of Eastern applicants is already substantial
as the Europe Agreements have led to the removal of tariffs on industrial products
(though impediments to trade in agriculture and food processing remain). Thus many of
the static trade effects of enlargement are already noticeable.
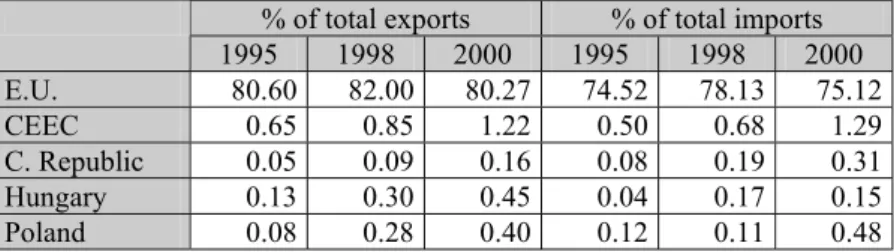
As shown in Table 2, the weight of CEE countries in Portuguese external trade
has increased from the very modest levels achieved in 1995. However, in 2000, the
CEEC accounted for no more than 1.22 % of Portuguese exports and 1.29 % of imports.
Among the CEE countries, Poland, the Czech Republic and Hungary are Portugal’s main
trading partners (accounting for 82.8% of total exports to the CEEC and 72.9% of total
imports from the CEEC). This fact suggests that we focus particular attention on these
three countries.
Table 2: Portuguese external trade with EU and CEEC % of total exports % of total imports 1995 1998 2000 1995 1998 2000 E.U. 80.60 82.00 80.27 74.52 78.13 75.12
CEEC 0.65 0.85 1.22 0.50 0.68 1.29
C. Republic 0.05 0.09 0.16 0.08 0.19 0.31
Hungary 0.13 0.30 0.45 0.04 0.17 0.15
Poland 0.08 0.28 0.40 0.12 0.11 0.48
Source: Instituto Nacional de Estatística (INE)
Although Portuguese trade with the CEEC increased at a much higher rate than
with other partners, the importance of these countries for Portuguese external trade
remains small. It is noteworthy that imports from CEEC have increased at a higher speed
than exports towards these markets, unlike in the Irish case for example. Other EU
countries also registered a significant increase in trade with the CEEC – particularly
Germany, Austria, France and Italy.3 The same three CEE countries account for the bulk
of trade with the rest of the EU also.
Let us now evaluate the second effect. Is it reasonable to consider a significant
diversion of EU imports away from Portugal and towards the CEE countries? It seems to
us that the answer is a qualified yes. The reasons are twofold: the high degree of
for the majority of Portuguese export sectors, CEEC became progressively more
competitive during the second half of the 1990’s, as shown by an analysis of EU market
share data.
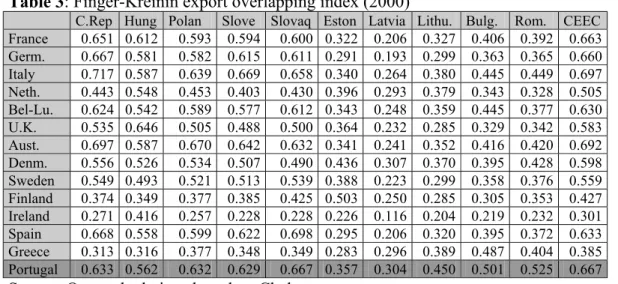
Similarities in export structures are evaluated using the Finger–Kreinin export
overlapping index.4 Table 3 shows the index for exports to the EU market of countries
"a" and "b", where "a" is a EU member and "b" a CEE country (including Bulgaria and
Romania). An index value of 1 would indicate that the relative weight of the products
considered in total exports is the same for both economies, while a value of zero would
indicate a complete difference.
Table 3: Finger-Kreinin export overlapping index (2000)
C.Rep Hung Polan Slove Slovaq Eston Latvia Lithu. Bulg. Rom. CEEC France 0.651 0.612 0.593 0.594 0.600 0.322 0.206 0.327 0.406 0.392 0.663 Germ. 0.667 0.581 0.582 0.615 0.611 0.291 0.193 0.299 0.363 0.365 0.660 Italy 0.717 0.587 0.639 0.669 0.658 0.340 0.264 0.380 0.445 0.449 0.697 Neth. 0.443 0.548 0.453 0.403 0.430 0.396 0.293 0.379 0.343 0.328 0.505 Bel-Lu. 0.624 0.542 0.589 0.577 0.612 0.343 0.248 0.359 0.445 0.377 0.630 U.K. 0.535 0.646 0.505 0.488 0.500 0.364 0.232 0.285 0.329 0.342 0.583 Aust. 0.697 0.587 0.670 0.642 0.632 0.341 0.241 0.352 0.416 0.420 0.692 Denm. 0.556 0.526 0.534 0.507 0.490 0.436 0.307 0.370 0.395 0.428 0.598 Sweden 0.549 0.493 0.521 0.513 0.539 0.388 0.223 0.299 0.358 0.376 0.559 Finland 0.374 0.349 0.377 0.385 0.425 0.503 0.250 0.285 0.305 0.353 0.427 Ireland 0.271 0.416 0.257 0.228 0.228 0.226 0.116 0.204 0.219 0.232 0.301 Spain 0.668 0.558 0.599 0.622 0.698 0.295 0.206 0.320 0.395 0.372 0.633 Greece 0.313 0.316 0.377 0.348 0.349 0.283 0.296 0.389 0.487 0.404 0.385 Portugal 0.633 0.562 0.632 0.629 0.667 0.357 0.304 0.450 0.501 0.525 0.667 Source: Own calculations based on Chelem
Portugal has, together with France, Germany, Italy, Austria and Spain the highest
value. Being so, these countries can potentially be significantly affected by this shift
effect. Furthermore, it is worthwhile noting that, among these countries, Portugal is the
one that stands to benefit least from the first effect analysed above.
To compare the competitiveness of Portuguese and CEEC exports in the EU15
market we consider two years: 1995 and 2000. The latter year is the most recent for
3
These countries are the main trade partners of CEEC with Germany at the top, responsible in 1999, for about 25 % of imports from CEEC and receiving about 33% of their exports (Martín et al. , 2002). 4
The Finger–Kreinin index is given by: ∑ min (Siac ,Sibc) where Siac is the weight of product i in country a exports to country c and Sibc is the weight of product i in country b exports to country c. In this
which data are available, and the former is chosen as the start date because the Europe
Agreements had just come into force at that time. Exports to the EU during this period
will be evaluated in terms of the dynamism of EU demand and also by making use of two
typologies that allow us to aggregate the different sectors according to relevant
characteristics – the so-called specialisation factors and the level of technology.5 We use
the Chelem data set elaborated by CEPII (Centre d’Études Prospectives et d’Informations
Internationales) which gives information on trade flows disaggregated into 72 sectors.
For purposes of comparison we use the other EU Cohesion countries – Spain, Greece and
Ireland.
Let us start with the demand-dynamism criterion. Based on average annual
growth in EU imports between 1995 and 2000, we distinguish three categories: dynamic
demand (a growth rate above 5 %), sluggish demand (a positive growth rate but below
5%) and declining demand (a negative growth rate). The results are presented in Table 4.
Table 4: Exports to the EU by EU demand dynamism ( % of total exports)
1995 2000
Dynamic demand
Slow growth Demand
Declining demand
Dynamic demand
Slow growth Demand
Declining demand
C. Republic 7.2 45.5 47.3 8.2 62.4 29.4
Hungary 9.7 47.2 43.1 22.1 56.5 21.4
Poland 5.3 38.0 56.7 6.4 53.7 39.9
CEEC(10) 7.8 40.5 51.7 12.9 52.3 34.8
Ireland 38.3 34.3 27.4 46.7 39.7 13.6
Greece 8.4 28.7 62.9 9.3 29.0 61.7
Spain 6.7 53.5 39.8 9.1 54.6 36.3
Portugal 5.5 54.6 39.9 5.3 58.4 36.3
Source: Own calculations based on Chelem
CEE countries, and Hungary in particular, increased their exports in sectors in
which EU demand is dynamic. The same is true of the Cohesion countries other than
Portugal, where exports in dynamic sectors declined in importance. In 2000, Portugal
displays the lowest value in this group of sectors.
More important than the relative weight of the different categories in total exports
is the evolution, for each of them, of the market share of the different countries in the
European economic area. Table 5 presents these results.
5
Table 5: EU market share by EU demand dynamism
1995 2000
Dynamic demand
Slow growth demand
Declining demand
Total Dynamic
demand
Slow growth demand
Declining demand
Total
C. Repub. 0.21 0.65 0.77 0.60 0.24 1.30 0.90 0.87
Hungary 0.24 0.57 0.59 0.51 0.65 1.19 0.66 0.87
Poland 0.21 0.73 1.25 0.82 0.20 1.23 1.33 0.95
CEEC(10) 1.12 2.87 4.18 2.99 1.71 5.00 4.84 3.97
Ireland 3.09 1.37 1.25 1.68 3.37 2.07 1.03 2.16
Greece 0.14 0.24 0.59 0.35 0.08 0.17 0.53 0.24
Spain 1.12 4.39 3.73 3.46 1.11 4.80 4.64 3.65
Portugal 0.25 1.25 1.04 0.96 0.15 1.21 1.09 0.86
Source: Own calculations based on Chelem
In global terms, of the countries considered, only two lost market share in the EU
between 1995 and 2000: Greece and Portugal.6 The Portuguese evolution is mainly
explained by its loss of relative position in the dynamic-demand sectors, though the same
occurred to a lesser extent in the sluggish-demand sectors. Only in the declining-demand
sectors was there a small increase. CEE countries, on the other hand, registered
significant improvements in their positions not only in global terms but also in all of the
segments considered. Of course the CEEC are not the only cause of Portugal’s declining
market share: one must also mention the effects of the tariff and non - tariff reductions of
the Uruguay Round.
Next we categorise EU imports in terms of the main determining factor,
categorised as: natural resources, labour costs, scale economies, product differentiation
and R&D.7 Table 6 shows the weight of the sectors in each one of these categories in the
total exports of each country.
sectors are excluded due to their heterogeneity.
6
Concerning the Portuguese situation, the Ministry of Economy (2002) presents a similar result. 7
Table 6: Exports to the EU by specialisation factors (as a share of total exports)
1995 2000
Nat. Resou.
Labour costs
Scale econ.
Prod. Differ.
R&D Nat. Resou.
Labour costs
Scale econ.
Prod. Differ.
R&D C. Republic 18.4 21.1 28.2 17.8 14.5 10.5 14.7 35.4 24.3 15.1 Hungary 20.3 23.5 16.7 24.9 14.6 9.5 12.4 17.3 28.4 32.4 Poland 26.4 35.3 20.1 8.3 9.9 19.6 27.5 24.8 16.5 11.6 CEEE(10) 21.9 30.6 22.6 13.6 11.3 15.0 24.3 24.2 19.3 17.2
Ireland 27.7 5.6 8.1 7.6 51.0 13.1 3.0 9.6 6.6 67.7
Greece 43.7 38.6 8.7 3.6 5.4 45.0 35.7 8.3 4.5 6.5 Spain 23.5 10.1 44.5 10.1 11.8 22.4 9.9 43.6 10.5 13.6 Portugal 20.9 35.4 18.9 11.7 13.1 17.8 30.9 26.4 11.4 13.5 Source: Own calculations based on Chelem
In 2000, among the countries considered, Portugal and Greece are those with the
highest weight in the group of sectors in which labour costs are the key element, above
the values of the CEEC and particularly those of the Czech Republic and Hungary. In
sectors in which the main factor is product differentiation or R&D, on the other hand, the
CEEC have a higher weight than Portugal. In terms of evolution, the share of these
sectors in CEE exports increased considerably whilst in Portugal it remained practically
unchanged. Table 7 uses the same typology but now for the EU market share.
Table 7: Market share in the EU by specialisation factors
1995 2000
Nat. Resou.
Labour costs
Scale econ.
Prod. Diffe
R& D
Nat. Resou.
Labour costs
Scale econ.
Prod. Differ.
R&D C. Republic 0.43 0.95 0.69 0.84 0.37 0.39 1.11 1.39 1.67 0.47 Hungary 0.41 0.91 0.35 1.02 0.32 0.36 0.97 0.70 2.02 1.04 Poland 0.86 2.20 0.68 0.55 0.35 0.81 2.31 1.08 1.26 0.40 CEEC(10) 2.61 6.95 2.80 3.26 1.47 2.58 8.53 4.42 6.16 2.48 Ireland 1.61 0.62 0.49 0.89 3.23 1.10 0.51 0.86 1.03 4.80 Greece 0.60 1.01 0.12 0.10 0.08 0.47 0.76 0.09 0.09 0.06 Spain 3.27 2.69 6.43 2.82 1.79 3.55 3.21 7.33 3.09 1.81 Portugal 0.82 2.64 0.76 0.91 0.56 0.67 2.38 1.06 0.80 0.43 Growth rate
(1995-2000)*
1.46 0.13 0.96 3.01 6.87
* average annual growth rate
Source: Own calculations based on Chelem
The groups of sectors where product differentiation and R&D are the decisive
determinants are those where demand in the European market grew fastest between 1995
fact, other than in sectors in which scale economies are the key factor, the Portuguese
position deteriorated in all categories. On the contrary, CEEC gained market share in all
segments other than those in which natural resources are most important (and trade
liberalisation, it must be remembered, is less advanced in these sectors). Starting from an
unfavourable situation, the Czech Republic and Hungary had already attained, by 2000, a
market share higher than the Portuguese one in sectors with more dynamic specialisation
factors.
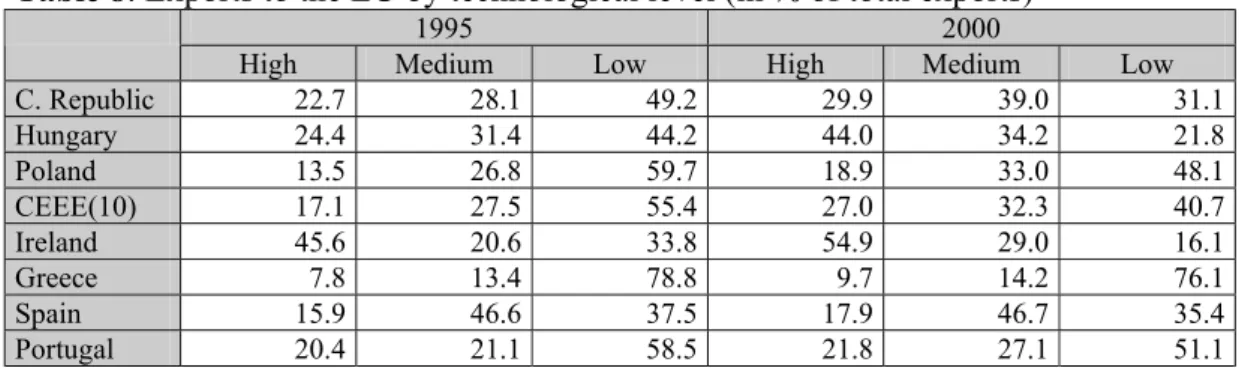
Let us now make the evaluation according to the technological level (high,
medium and low), as reported in Table 8.
Table 8: Exports to the EU by technological level (in % of total exports)
1995 2000
High Medium Low High Medium Low
C. Republic 22.7 28.1 49.2 29.9 39.0 31.1
Hungary 24.4 31.4 44.2 44.0 34.2 21.8
Poland 13.5 26.8 59.7 18.9 33.0 48.1
CEEE(10) 17.1 27.5 55.4 27.0 32.3 40.7
Ireland 45.6 20.6 33.8 54.9 29.0 16.1
Greece 7.8 13.4 78.8 9.7 14.2 76.1
Spain 15.9 46.6 37.5 17.9 46.7 35.4
Portugal 20.4 21.1 58.5 21.8 27.1 51.1
Source: Own calculations based on Chelem
In 2000, low technology exports represented more than 50% of total Portuguese
exports whilst in the case of the CEEC the value was 40.7%. In Hungary, the figure was
as low as 21.8%. In the CEEC (and mainly in Hungary), during the time-period analysed,
there was a strong increase in the weight of high technology sectors in total exports. In
Portugal, the increase was marginal. Ireland is a special case with 55% of total exports
coming from high technology sectors. The evaluation of market shares according to these
Table 9 : Market share in the EU by technological level
1995 2000
High Medium Low High Medium Low
C. Republic 0.50 0.53 0.73 0.82 1.13 0.75
Hungary 0.47 0.51 0.57 1.24 1.02 0.54
Poland 0.41 0.70 1.23 0.57 1.06 1.29
CEEE(10) 1.91 2.62 4.16 4.67 4.77 4.74
Ireland 2.48 0.96 1.24 3.41 1.92 0.89
Greece 0.10 0.15 0.68 0.08 0.12 0.52
Spain 2.08 5.18 3.29 2.09 5.78 3.67
Portugal 0.75 0.66 1.44 0.61 0.80 1.26
Growth rate (1995-2000)*
6.43 1.87 0.70
* average annual growth rate
Source: Own calculations based on Chelem
The results are clear: concerning the high technology sectors, Ireland and CEEC
improved their positions significantly, Portugal fell substantially while Spain and Greece
remained relatively stable. It is also interesting to note that the CEEC gained market
share in EU in all sectoral groups, with higher gains recorded in higher technology
sectors.
To complement the analysis, we evaluate changes in EU market share by
considering those products where Portugal displays high levels of revealed comparative
advantage (RCA), as measured by the Balassa export performance index for the EU
market.8 The sectors where Portugal has, in 2000, the highest RCA values (in decreasing
order and considering only sectors with an RCA score greater than 5) are: knitwear,
wood products, carpets, leather, consumer electronics and clothing. Other than consumer
electronics, all are low-tech sectors in which production is based on low labour costs and,
in the case of wood articles, on natural resources. In contrast, consumer electronics is a
high technology sector in which R&D is important. In all six sectors, demand is either
sluggish or declining.
The evolution of the market shares of these key-sectors for the Portuguese
economy is presented in Table 10.
8
Table 10: EU market share for the sectors with highest RCA in Portugal Portugal CEEC C. Republic Hungary Poland Sectors 1995 2000 1995 2000 1995 2000 1995 2000 1995 2000 Knitwear 6.50 4.92 5.66 7.25 0.66 0.51 1.22 1.25 1.24 1.31 Wood
articles
5.16 4.62 11.28 13.65 1.80 1.98 0.94 1.06 4.72 5.61
Carpets 4.27 4.25 4.91 6.60 1.31 1.75 0.68 0.50 1.54 2.23 Leather 4.72 4.59 6.05 7.04 0.98 0.57 1.16 1.22 0.98 0.84 Consumer
electronics
3.84 3.23 1.61 9.07 0.01 0.86 1.06 5.61 0.37 2.26 Clothing 3.57 2.67 13.54 14.84 1.04 0.83 1.52 1.30 4.80 3.69 Source: Own calculations based on Chelem
In all sectors presented in Table 10, Portugal lost market share between 1995 and
2000 whilst the CEEC share expanded. In spite of this, in most cases the improvement in
CEEC performance is relatively modest. The exception interestingly is consumer
electronics, where both CEEC as a whole and the Czech Republic, Hungary and Poland,
individually, increased their market shares substantially.
It is possible that the price-quality structure of Portuguese exports in the EU
market corresponds to different market segments as compared to the exports of the CEE
countries. Caetano et al. (2002, Table 22) measure the percentages of high, medium and
low quality exports in the total EU exports of Portugal and the CEE10 by using the
‘trade flow unit value’ approach of Freudenberg and Müller (1991). For exports where
the ratio A of the country’s export unit value to the average EU import unit value is
above 1.15, the quality is considered to be high; the quality is medium if 0.85 ≤ A ≤
1.15, and is low if A< 0.85.
In 2000 only Estonia, Hungary and Slovenia had a higher share of high-quality
exports than Portugal. The general picture is that medium quality exports predominate in
Portugal (45.5 % of the total in 2000) whilst in the CEE countries (other than Bulgaria)
the low quality range predominates. Thus, it may be the case that even in sectors in which
Portugal is losing market share it is competing successfully with the CEEC in terms of
quality. However this advantage could be eroded since all CEE countries other than
Latvia and Slovenia improved the price-quality of their exports between 1993 and 2000
The market-share analysis has shown that the growing penetration of CEE exports
in the EU market has occurred mainly in medium and high technology sectors in which
demand is dynamic and whose competitiveness depends largely on product
differentiation and R&D. These are precisely the sectors in which Portugal fared worst in
terms of EU market share. The role of FDI is relevant in explaining this evolution, in that
FDI is largely responsible for the transformation of the comparative advantage of CEE
countries. Multinational firms attracted to CEE countries began to export to the EU.
Export-oriented FDI, furthermore, is more important in dynamic high value-added
sectors, and has thus contributed to the increasing specialisation of the CEEC in these
sectors.9
It is very likely that the trade adjustment process is not yet complete, particularly
in labour-intensive sectors where liberalisation was slower. For Portugal this may mean a
further diminution in the traditional sectors. On the other hand however, it is also likely
that the CEEC position in the more dynamic modern sectors will improve further. This
may make it more difficult for Portugal to replace its traditional sectors by more dynamic
ones, as illustrated in Table 1. These difficulties will be accentuated if FDI is displaced,
which is the topic to which we now turn.
3. Inward FDI – Competition between Portugal and CEEC?
Inward FDI can be of considerable importance for peripheral countries seeking to
converge on the more developed EU core. FDI impacts on a range of important areas:
capital formation, employment creation, tax revenue generation and trade. FDI also has a
number of indirect effects, involving the accumulation of technology, knowledge, skills
and other resources representing the intangible assets of multinational firms (Blömstrom
et al., 2000). The competitive pressures it introduces can also act as a stimulus to greater
efficiency on the part of domestic firms. FDI is therefore likely to increase productivity
9
and promote economic growth. This effect was confirmed for the Portuguese economy by
Flôres et al. (2002) and Proença et al. (2002).
There has been a spectacular increase in CEE-bound FDI over the last decade, as
shown in Table 11. But there are several reasons to assume that this trend will receive a
further stimulus after adhesion. Firstly, the fact that efforts to remove any remaining
non-tariff barriers are likely to be pursued more vigorously in the case of intra-EU trade.
Secondly, accession will increase the confidence of foreign investors by allowing the
possibility of appeal beyond the courts of the associated countries to those of the
European Union in the event of legal disputes arising. Thirdly, EU membership serves as
some guarantee of transparency in the legal and business environment because of the
acquis communautaire and the culture of checking the probity of Structural Funds
expenditures and fourthly, entry to the Single Market will fully remove customs frontiers
and trade barriers associated with different technical standards, and will allow full access
to government procurement contracts throughout the EU. For all these reasons accession
is likely to represent as dramatic a change in the CEE climate for foreign investors as it
did for Ireland, Spain and Portugal upon their respective accessions to the EU (Barry,
2003).
Table 11 : FDI inward stock (in millions of current US dollars)
1990 1995 2000
In the case of Portugal, FDI inflows increased significantly after EU accession,
reaching a peak of nearly 5% of GDP in 1991. Between 1991 and 1994 there was a
decrease, but after that period of time the increase in FDI inflows was resumed.
From 1996 onwards however, significant divestment flows have been registered,
with an increasing tendency at least until 2000.10 In 1999, foreign direct investment net
of divestment was only 1% of GDP and was actually negative in terms of firms’ equity.
Manufacturing industry, furthermore, received a declining share of FDI; while in 1994
this sector captured 45.8 % of total FDI, in 2000 the percentage decreased to only 1.9%.11
FDI in Portugal goes primarily to the property sector and to other services, mainly
financial. This is in contrast to the situation in the CEE countries and some of the other
Cohesion countries. For example, manufacturing’s share of FDI inflows averaged around
40% in Hungary and Poland and 30 % in the Czech Republic.
Some recent evidence on the diversion of FDI flows away from Southern Europe
to the CEE countries is provided by Braconier and Ekholm (2001), who analyse a
firm-level dataset on the operations of Swedish multinational companies. They show that the
expansion in affiliate-firm employment in CEE countries, which totalled 15,000 over the
period 1990 to 1998, came at the expense of affiliate activity in Southern Europe where
employment fell by 14,000 over the same period.
A fact that may counteract this possible FDI diversion effect is that an increasing
part of FDI comes from the neighbouring Spanish economy. In terms of FDI stock, in
2000, Spain was the main investor, with 14.5 % of total (in 1995, Spain occupied the
third place, after France and UK), followed by the UK and France (12.9% and 11.8%,
respectively). Between 1995 and 2000, Germany and UK slightly decreased their share in
total FDI stock and, in the case of France, the reduction was greater, at around 5
percentage points. This evolution is consistent with the idea that geographic proximity
influences the location of FDI.
Analysis of the threat that CEEC represent as competitors for foreign investment
cannot, however, be confined to an extrapolation of recent flows. As mentioned earlier,
10
foreign investors are unlikely to see free trade as equivalent to EU membership and after
adhesion the advantages of the CEE countries will increase. Thus, it seems more relevant
to conduct a comparative evaluation of the competitive position of CEEC, Portugal and
the remaining Cohesion countries in terms of the relevant factors for the attraction of
FDI. This is the purpose of the remainder of this section, which uses information supplied
by the Institute for Management Development (IMD). This source provides a wide range
of data up to the year 2002.
In its annual report, IMD assesses 49 countries in terms of factors relevant to this
aspect of competitiveness. In what follows we discuss the most relevant of these. All the
evaluations are presented in a scale from 0 (representing the worst competitive position)
to 10 (representing the best), with some exceptions. Our purpose is mainly to evaluate the
relative position for each indicator for Portugal, the other EU Cohesion countries and the
most relevant CEE countries (Hungary, the Czech Republic and Poland). Table 12
presents a first group of competitiveness indicators concerning government efficiency.
11
Table 12: Competitiveness factors –government efficiency (2002)
Criterion: Portugal Spain Greece Ireland Hungary C. Rep. Poland [1] The legal framework is not
detrimental to competitiveness
3.53 (42) 5.85 (24) 4.09 (37) 6.91 (12) 5.93 (23) 4.25 (34) 2.91 (46) [2] Real corporate taxes do not
discourage entrepreneurial activity 3.94 (39) 5.73 (19) 4.38 (33) 7.96 (2) 6.59 (9) 4.50 (32) 2.96 (48) [3] Economic policies adapt
quickly to changes in the economy 2.85 (45) 5.64 (12) 4.00 (38) 6.53 (4) 5.56 (13) 4.67 (25) 3.13 (42) [4] Government decisions are
effectively implemented 2.70 (46) 5.58 (15) 3.16 (40) 6.32 (8) 5.56 (16) 4.67 (26) 3.03 (44) [5] Transparency of government
policy 3.07 (46) 5.94 (18) 3.81 (38) 6.19 (15) 3.41 (43) 4.40 (32) 3.20 (45) [6] Bureaucracy does not hinder
business activity 1.69 (44) 3.82 (21) 1.91 (42) 5.32 (8) 3.63 (23) 3.00 (26) 1.26 (48) [7] Personal security and private
property are adequately protected
6.48 (23) 6.33 (26) 6.70 (20) 7.37 (18) 5.70 (32) 5.67 (33) 2.86 (42) [8] Foreign companies are not
discriminated against by domestic legislation 8.44 (16) 8.18 (23) 7.84 (28) 9.37 (3) 7.93 (27) 8.28 (19) 6.88 (44) [9] Labour regulations are
flexible enough 2.50 (47) 3.82 (33) 3.81 (34) 6.04 (12) 7.19 (6) 5.44 (16) 2.52 (45) [10] Access to local capital
markets is not restricted for foreign firms 8.85 (12) 8.38 (26) 8.63 (20) 9.05 (10) 8.52 (21) 8.72 (17) 6.68 (43) [11] Investment incentives are
attractive to foreign investors
6.39 (24) 6.46 (23) 5.02 (36) 8.60 (2) 7.56 (8) 8.83 (1) 4.60 (40) [12] Venture capital is easily
available for business development 4.58 (28) 4.89 (22) 4.63 (26) 6.67 (5) 3.48 (35) 3.17 (40) 3.42 (37) [13] Banking services are widely
developed 7.92 (26) 8.03 (25) 7.03 (33) 8.07 (24) 7.11 (32) 5.89 (41) 6.38 (37) [14] Stock markets provide
adequate financing to firms
4.25 (34) 6.25 (17) 5.72 (24) 6.04 (22) 3.63 (41) 2.17 (46) 3.97 (37) [15] Image abroad supports the
development of business
4.78 (34) 6.39 (21) 4.44 (37) 8.32 (3) 6.67 (19) 6.25 (23) 3.82 (39) Note: Values between brackets represent the country ranking in a total of 49 countries
Source: IMD
As one could expect, Ireland is by far the country best positioned across most
criteria. Several weaknesses are evident in the Portuguese position relative to the CEEC.
First, the justice system, a key element for the regular functioning of a market economy
and for generation trust among investors, appears to be deficient. Other weaknesses
appear at the level of government action: an uncompetitive fiscal system, a weak
Another relevant aspect is the excessive rigidity of labour markets.12 In what concerns the
existence of venture capital and the functioning of banking services, the Portuguese
situation is reasonable. Concerning the CEEC, two aspects should be pointed out: first,
the strong position in particular of Hungary and the Czech Republic in the generality of
the criteria considered, and second, their strong position with respect to criterion 11,
reflecting the enormous effort made by these countries to attract FDI.13
Table 13 displays information concerning infrastructure.
12
New labour legislation to allow greater flexibility is to be implemented in Portugal. 13
Table 13: Competitiveness factors - basic, technological, health and environment infrastructures (2002)
Criterion Portugal Spain Greece Ireland Hungary C. Rep. Poland [1] Maintenance and development
of infrastructure is adequately planned and financed
4.97 (28) 6.12 (18) 4.81 (30) 4.32 (31) 4.22 (32) 4.97 (28) 2.65 (45) [2] Quality of air transportation is
adequate and efficient
6.82 (27) 6.48 (31) 6.13 (35) 5.75 (39) 5.93 (38) 7.00 (23) 4.55 (45) [3] The distribution infrastructure
of goods and services is efficient
6.03 (28) 6.15 (26) 5.05 (35) 3.54 (46) 4.89 (36) 5.67 (30) 3.68 (43) [4] Energy infrastructure is
adequate and efficient
6.28 (30) 5.18 (38) 5.41 (36) 5.86 (33) 6.69 (26) 7.94 (15) 5.57 (35) [5] Adequacy of communications
(availability, reliability, cost)
6.47 (34) 6.06 (38) 6.53 (32) 6.48 (33) 7.19 (26) 7.17 (27) 4.93 (47) [6] New information technology
and its implementation meet business requirements 6.64 (33) 5.76 (45) 6.13 (42) 6.49 (36) 6.81 (30) 7.14 (27) 4.70 (49) [7] Suitable internet access
(availability, speed, cost) is provided 6.92 (34) 6.09 (44) 6.59 (36) 6.00 (46) 6.07 (45) 6.94 (31) 4.16 (49) [8] Fixed telephone lines-number
of main lines per 1000 inhabitants* 441 (28) 460 (26) 578 (17) 503 (22) 368 (32) 378 (30) 296 (34) [9] Mobile telephone-number of
subscribers per 1000 inhabitants*
823.1 (7) 731.4 (14) 729.3 (17) 753.5 (12) 484.5 (28) 676.4 (21) 258.6 (35) [10] Number of computers per
1000 people* 178 (31) 231 (27) 112 (35) 461 (14) 176 (32) 179 (30) 122 (34) [11] Number of internet users per
1000 people* 190 (31) 199.3 (29) 155.5 (34) 289.5 (24) 168.8 (33) 198.3 (30) 125.5 (35) [12] Health infrastructure meets
the needs of society
3.53 (39) 7.15 (13) 4.00 (35) 4.63 (30) 2.15 (47) 6.50 (22) 2.38 (46) [13] Environmental laws and
compliance do not hinder the competitiveness of business
6.11 (24) 6.48 (17) 5.72 (32) 6.56 (14) 6.52 (16) 5.61 (35) 4.41 (48)
[14] Quality of life 6.00
(29) 8.58 (15) 6.50 (24) 7.93 (19) 5.19 (35) 6.33 (25) 3.51 (44) [15] National culture is open to
foreign ideas 8.00 (11) 6.85 (34) 7.25 (25) 7.65 (19) 6.89 (32) 6.61 (38) 5.85 (45) [16] Values of the society support
competitiveness 5.64 (39) 5.76 (35) 5.88 (33) 7.54 (10) 6.59 (25) 5.72 (37) 4.61 (46) [17] Office rent – total occupation
cost (US$/Sq. M. per year)*
302 (21) 461 (38) 438 (33) 568 (44) 254 (15) 284 (19) 413 (31) Note: Values between brackets represent the country ranking in a total of 49 countries
Source: IMD ; * - values in 2001
In this case, in contrast to the indicators related to government efficiency, the
Portuguese position is not dramatically different from that of the CEEC (once again with
fact, despite specific differences, we do not detect, in this group of indicators, a clear
obstacle to the attraction of FDI in any of the countries considered.
The quality of human capital is generally agreed to be one of the major
weaknesses of the Portuguese economy and so it deserves a more detailed study. Table
14 supplies information on this.
Table 14 : Competitiveness factors - human capital (education and science) -2002 Criterion Portugal Spain Greece Ireland Hungary C. Rep. Poland [1] PISA results (15 years of
age)- reading literacy – 23 countries* 470 (22) 493 (15) 474 (21) 527 (3) 480 (19) 492 (16) 479 (20) [2] PISA results (15 years of
age)- scientific literacy – 23 countries* 459 (22) 491 (16) 461 (21) 513 (7) 496 (13) 511 (9) 483 (18) [3] PISA results (15 years of
age)- mathematical literacy–23 countries* 454 (21) 476 (18) 447 (22) 503 (12) 488 (17) 498 (14) 470 (19) [4] Total public expenditure on
education – percentage of GDP
5.6 (20) 4.5 (28) 3.4 (44) 6.7 (12) 6.3 (15) 4.2 (30) 5.9 (18) [5] The educational system meets
the needs of a competitive economy 3.03 (44) 4.89 (25) 3.47 (42) 8.00 (2) 6.67 (10) 5.64 (20) 3.64 (40) [6] University education meets
the needs of a competitive economy 3.89 (45) 5.14 (32) 3.88 (46) 8.04 (3) 6.96 (13) 6.03 (22) 3.94 (44) [7] Economic literacy 3.53
(42) 4.77 (30) 4.75 (31) 7.02 (8) 5.78 (22) 5.11 (28) 2.90 (47) [8] Qualified engineers are
available in labour market
5.53 (42) 6.95 (26) 7.09 (25) 7.29 (22) 8.30 (4) 7.67 (16) 6.63 (30) [9] Knowledge transfer between
firms and universities
2.86 (45) 3.36 (36) 3.34 (37) 5.65 (11) 4.44 (25) 4.42 (27) 2.72 (46) [10] Total expenditure on R&D –
percentage of GDP
0.753 (31) 0.897 (28) 0.705 (32) 1.608 (20) 0.806 (30) 1.352 (23) 0.700 (33)
[11] Science in schools is
adequately taught 3.25 (45) 4.58 (32) 5.50 (23) 5.09 (25) 7.00 (3) 6.39 (10) 3.79 (40) [12] Information technology skills
are readily available in labour force 6.11 (40) 6.06 (42) 6.16 (39) 7.93 (10) 7.26 (26) 6.72 (32) 6.59 (33)
[13] Labour relations are
generally productive 5.53 (33) 5.88 (30) 5.19 (39) 7.26 (11) 6.74 (18) 6.17 (27) 4.76 (43)
[14] Worker motivation is high 4.53
(40) 5.42 (32) 4.44 (42) 7.16 (8) 5.85 (25) 5.56 (30) 3.71 (46) [15] Skilled labour is available in
labour market 5.07 (43) 6.33 (36) 6.03 (39) 7.05 (26) 7.11 (23) 7.33 (18) 6.38 (34) Note: Values between brackets represent the country ranking in a total of 49 countries
Here there is a wide gap between Portugal, Greece and Poland on the one hand, as
against the other countries considered. The comparison between Portugal and the CEEC
is particularly damning because the central problem for Portugal is not an input question
(the expenditures with education and R&D are at levels similar to those of the other
countries) but because of the quality of the education and science systems, their
connection with entrepreneurial activity and their capacity to satisfy the needs of a
competitive economy. The low levels of literacy and the lack of skilled labour capable of
fulfilling firms’ needs represent weaknesses of the Portuguese economy and compromise
the ability of the country to attract FDI mainly in the case of sectors with a higher
technological component and skilled labour requirements.
Portugal has the lowest productivity levels in the EU15. This global picture in
terms of human capital, together with a specialisation in sectors of low added value,
labour intensity, facing declining demand and with a weak technological component (as
emphasised in section 2), are decisive factors in explaining this.
The degree of centrality (or “closeness to purchasing power”) also affects FDI in
certain particular sectors.14 Schürmann and Talaat (2000) rank EU and CEE countries in
this regard. Their index provides a measure of travel costs between points within the
overall region weighted by the purchasing power that each point represents. The most
peripheral regions at present are the Baltic states, Northern Sweden and Finland, Bulgaria
and Romania. Hungary, Slovenia, the Czech and Slovak Republics and the Southwest of
Poland are no more peripheral than Ireland, Spain or Portugal and are less peripheral than
Greece.
The main weaknesses in Portugal can only be addressed over time. On the
contrary, the CEEC, and in particular the Czech Republic and Hungary, not only have
displayed rapid progress in some of these respects but they are on the way to correct the
more relevant in their case, i.e. at the infrastructure level, particularly with the
implementation of the huge TINA transport infrastructure plans for Central and Eastern
Europe.
14
Portuguese disadvantage can be illustrated with reference to the 2002 report of the
international consultancy AT Kearney. AT Kearney makes an annual inquiry into the
planned foreign investment decisions of the 1000 largest firms in the world. In the 2002
report, which puts China and the US at the top of the table, Portugal is, as in the last 5
years, not included in the first 25 countries. This report points out three explanations for
the Portuguese situation. First, large world firms’ managers put great emphasis on the
budgetary and monetary policies of the different countries. The recent evolution of the
Portuguese deficit, reaching 4.1% of GDP in 2001, weakened Portugal’s image within the
euro zone (though it was reduced to less than 3 % by the end of 2002). A second factor is
related to FDI origin. Propensity to invest is at present higher in USA and Japan but FDI
inflows in Portugal are mainly of European origin. The third problem is competition from
the CEEC. In fact, by contrast to the Portuguese position, the three main CEE countries
that host FDI are all well positioned in the ranking of AT Kearney.
As against this, however, it is important to note that each previous
trade-liberalisation episode within Europe increased the pool of FDI both from within Europe
and from outside (Dunning, 1997a, b). The goods produced by multinational firms also
tend to have relatively high income elasticities of demand so that the expected growth in
the CEEC10 consequent on enlargement should generate further flows of FDI into and
within the newly expanded EU (Barry and Hannan, 2003a). A further relevant detail is
that the Single Market liberalisation was associated with an expansion in the average
number of plants that the leading multinational firms in the EU maintained. Among such
firms with plants in Portugal for example, the average number of EU countries (other
than their home bases) in which they maintained plants rose from 4.4 in 1987 to 5 in
1993, while the share of their European foreign production that they located in Portugal
increased by 8 percent (Pavelin and Barry, 2003). This suggests that the development of
the Single Market was associated with a further fragmentation of the production chain. If
this proves to be the case it will be efficiency-enhancing and should operate to the further
benefit of Portugal’s foreign-owned industry.
The notion that enlargement will considerably enhance the attractiveness of the
CEE countries as a location for export-oriented foreign direct investment, and as such
stimulate Portuguese firms to invest in these countries. While Portugal has recently
become a net investor abroad and Portuguese investment in CEE markets is increasing, it
remains slight, with a weight of no more than 1 % of total Portuguese direct investment
abroad. Poland is the main destination for these firms, with 98% of the total in the
1996-99 period.15
4. Migration Issues
The possibility of substantial migration flows from CEE countries to the EU15 is
a widely discussed issue because of the very large income gap that exists, as well as the
geographical proximity of the accession countries. This has led EU incumbents to favour
only a gradual opening up of labour markets, in the knowledge that ongoing convergence
in living standards will make substantial migration less likely.
So far, migration flows from CEEC have been very modest, which is not
surprising given the rigid immigration legislation in EU countries. At the end of the
1990’s, the stock of foreign residents who have immigrated from the CEEC-10 to the EU
is estimated at some 870,000 individuals, accounting for around 0.5 % of the total CEE
population, 0.2 % of the total EU population and 0.3 % of the total EU workforce. The
consensus is that, even with full liberalisation, such flows will not increase dramatically.
The main reason is that economic convergence is likely over the medium term, while
migration is hindered by high transaction costs and the limited absorption capacity of
labour markets in the destination countries.
The experience of the previous southern enlargement of Greece, Portugal and
Spain is usually taken as a benchmark. These acceding countries also displayed
substantial differences in terms of incomes and wages (though more attenuated) and
geographical proximity to EU incumbent countries, but the results were very modest.
Some of these traditional EU emigration countries have even turned into immigration
countries. According to Brücker (2001), the stock of foreign residents from the Southern
15
EU members had already reached equilibrium levels when free movement was allowed
(between 6 and 7 years after accession).
Estimates of likely migration patterns take into account income differences,
distances and traditional ties between sending and receiving economies, the
labour-market characteristics and demographics of the various countries and expectations of
future economic evolutions. Boeri and Brücker (2000) incorporate these various
determinants, and, based on an assumed convergence of 2 percent per annum between
CEEC and EU income levels and no significant change in unemployment rates, conclude
that after full liberalisation a maximum of 350,000 immigrants will move in the first year
with this figure declining to less than 150,000 a decade after. In the long term (2030) the
population of CEEC living in the EU is expected to increase from the current 0.2% level
to 1.1 %.
These potential flows, furthermore, will be concentrated in particular on
Germany and Austria, which are at the end location for over 80 percent of CEE migrants
at present.
Traditionally, Portugal has been characterised by emigration rather than
immigration, and substantial immigration is not envisaged in most studies on
enlargement. Boeri and Brücker (2000) predict the stock of CEE residents in Portugal to
rise from a figure of 780 that they quote for 1998 to a total of 3,560 by 2030. However,
recently, there has been a significant inflow of migrants, including from Eastern
countries, to occupy less skilled jobs in the construction sector (which registered a boom
in the 1990’s, in part supported by European Funds), and also in sectors such as
restaurants and domestic services.
Portugal has also adopted what appeared to be a more permissive immigration
legislation than a number of other EU countries. In 1992-93 and again in 1996, illegal
immigrants were allowed to apply for a “residence permit”. The result was the
legalisation of around 70,000 individuals, and the prospect of a “friendly” policy towards
immigration that largely contributed to new inflows in the late 1990’s.
The Decree Law nº 4/2001 aimed to counteract the facilities of the previous
decade by creating the legal notion of “temporary stay permit” in addition to the
contract, with the possibility of being renewed for a maximum of five years. Only in the
end of this period may foreigners apply for a “residence permit”. The purpose of this law
was to reduce expectations of a permanent legalisation and also to deter employment of
illegal immigrants. It is highly expectable, however, that a significant proportion of this
new legal segment of “temporary workers” acquire a more permanent resident status as
shown by the experience of other European host countries that have adopted a similar
policy decades ago16.
National statistics show that in 1980 there was only 50,750 legalised immigrants
in Portugal (0.5 per cent of total Portuguese population), while by 1999 the total number
of foreigners had increased almost fourfold to more than 190,000 (1.9 per cent of total
population). Most of Eastern immigration is not included in these figures as just a few
people from Eastern Europe were legally in Portugal in 1999. However, some estimates
used by the Portuguese media report between 60,000 to 200,000 illegal immigrants in the
turn of the decade, most of them probably from Eastern Europe (Rita, 2002). The Social
Support to Eastern Immigrants Association in Portugal (ASIL) estimated for mid-2002 a
figure of 300,000 immigrants from there, while an increase to around 500,000, mainly
relatives of those already in residence, is expected by 2004.
Most of these Eastern immigrants in Portugal come from Ukraine, followed at
some distance by Moldovans, Romanians and Russians. Ukrainians already represent the
third largest foreign community in Portugal, with over 40,000 “temporary stay permits”
granted during the legalisation undertaken in 2001, i.e., 35.4 % of the total (Peixoto,
2002). Entrance and stay of many of these immigrants is linked to trafficking networks,
which contributes to speed up the process of migration.
Will Eastern immigration into Portugal increase substantially in the future? It may
do, primarily because of low unemployment relatively to the EU average while the
female participation rate is higher than the EU average (at 63% compared to 59% in
1999). However, there are a range of factors that make Portugal a less desirable location
from the viewpoint of potential immigrants. Per capita income and wage levels are low,
the geographical position is not favourable and there are no significant cultural affinities
16
or historical linkages. Besides, the unemployment rate is rapidly increasing (from 3.9%
in the second quarter of 2001 to 5.1% in the third quarter of 2002). As unemployment
primarily affects unskilled workers, this will make the job market less attractive.
Another relevant issue concerns the impact of immigration. The effect on the
labour market and on per capita income will depend primarily on immigrant skill levels
relative to the indigenous population. If skill levels are equivalent, then with international
capital mobility the effects are minimal. If immigrants are less skilled, the distribution of
income becomes less equitable as downward pressure is exerted on the unskilled wage.
Unemployment may also rise, as it tends to be concentrated among the less skilled. The
net fiscal costs of immigration will also be larger as unskilled immigrants use more
government services and pay less tax. All these effects will be reversed of course if
immigrants are more highly skilled than the indigenous population. But the situation in
Portugal, as in the rest of the EU, is that most immigrants of Eastern European origin are
in occupations which do not fully reflect their skills.
Requests during 2001 on “temporary stay permits” show the following
distribution by sector of the Eastern European population: 43.6 % in construction, 21.3 %
in manufacturing, 15.4 % in services, 6.7 % in trade, 6.5 % in agriculture, fishing and
extractive industries and 6.3 % in hotels and restaurants (Pires, 2002).
A possible indirect impact of future free labour will be a crowding-out of
Portuguese emigrants by migrants from the East. Such an effect would increase further
the pressures on the Portuguese unskilled labour market. Almost 10 per cent of the
Portuguese population are resident in other EU countries, predominantly in France and,
to a lesser extent, in Germany. These two countries received between 1955 and 1996,
respectively, over 1047,000 and 344,000 Portuguese emigrants (Peixoto, 1999). Outflows
to France decreased in the period 1975-96 (to 16% of the total registered in the period
1955-74), but emigration to Germany diminished only slightly between these two
sub-periods. Even if such a crowding-out effect were not to occur in an expressive way,
Eastern migration may always discourage further outflows from Portugal into present EU
5. Economic and Social Cohesion Policy
The coming enlargement will entail a substantial increase in demands upon the
EU budget, notably in the cases of the CAP and the Structural Funds. It has been agreed
however that the ceiling on the EU budget will remain at 1.27% of GDP.
Analyses carried out in advance of the agreement reached in Copenhagen in
December 2002 were based on an assumed net cost of enlargement of around 20 billion
euro per annum. On the basis of the current distribution of net income payments and
receipts across EU member states Portugal’s share of these costs would have come to
around 342 million euro per annum (CEPR, 2002). As is well known however, the
Copenhagen agreement represented a considerably better deal for incumbent EU
members than had long been anticipated. Rather than the 20 billion euro per annum
estimate of Baldwin et al. (1997) and CEPR (2002), gross enlargement costs are now
likely to sum to 41 billion euro over the three years 2004-2006. With 15 billion to be
covered by new member states' contributions this brings the net cost down to only 26
billion euro, or around 9 billion euro per annum.17 Again on the basis of the current
distribution of net income payments and receipts Portugal’s share of these costs would
come to around 152 million euro per annum.
The cost to Portugal would escalate however if costs and benefits were to be
redistributed within the EU in line with current income levels. It is well known that
Germany bears a disproportionate share of the current burden while countries like
France, Ireland and Greece, and to a far lesser extent Portugal, contribute less than the
figures warranted by their current income levels.18 Over time it has to be envisaged that a
more equitable sharing of the burden will be negotiated among EU member states. de la
Fuente and Doménech (2001) calculate that Portugal is currently over-subsidised to the
tune of 600 million euro per annum (compared to an Irish figure of around 2 billion
17
The assessment of the European Enlargement Commissioner delivered to the parliament Foreign Affairs Committee on January 23 was that the likely inability of the accession countries to draw down all the funds available to them may reduce the net cost to as little as 10.3 billion euro over this three year period 2004-2006.
euro!). Given that any scaling upwards of the budgetary costs of enlargement will raise
the profile of this item on the EU agenda, there may be a more substantial change over
time in the flow of funds between Portugal and the rest of the EU.
While it has been agreed that the budgetary funds assigned to each member state
will not change during the period of validity of Agenda 2000 – i.e. until 2006 – due to the
separation principle established in the Inter-institutional Agreement, the position is likely
to change after that date. If the present criterion for Objective 1 eligibility is maintained,
the Portuguese regions of Algarve and Madeira (as well as Lisboa e Vale do Tejo which
have already lost that status) will no longer be eligible for Objective 1 status.19 Based on
current information, the other Portuguese regions are unlikely to lose that status by 2007,
not is it likely that Portugal will lose its eligibility for cohesion funding.20
The Structural Funds – the European Regional Development Fund (ERDF), the
European Social Fund (ESF), the European Agricultural Guidance and Guarantee Fund
(EAGGF) and the Financial Instrument for Fisheries Guidance (FIFG) – and the
Cohesion Funds (for environment and transport infrastructure projects in countries with a
per capita income less than 90% of the EU average) – not only stimulate demand but also
operate on the supply side by supporting investment in infrastructure and human capital
and thus increasing productivity and competitiveness. Total EU transfers in the period
1989-1999 were most pronounced in the Cohesion countries.21 Community support
accounted for almost 15 percent of total investment in Greece in the 1994-99 period, 14
percent in Portugal, 10 percent in Ireland and 7 percent in Spain.
How important have those funds been for the Portuguese economy? Table 15
summarises the impact of Structural Funds in terms of additional growth of GDP.
18
Spain is found to contribute around one and a half billion euro per annum more than is warranted according to these calculations (de la Fuente and Doménech, 2001).
19
The exclusion of Madeira from Objective 1 is probably related to its high weight of off-shore financial activities and does not reflect the structural reality of the region. Nevertheless, owing to the ultra-peripheral region statute there is the possibility of its retaining its Objective 1 status (Ministry of Economy, 2002). 20
Table 15: Impact of Structural Funds (percentage addition to GDP) Demand effects Supply effects Total effects 1994 1999 2020 1994 1999 2020 1994 1999 2020
Ireland 6.2 5.9 4.0 3.4 8.4 6.2 9.3 12.4
Greece 1.1 4.8 1.5 0.1 4.6 8.0 1.2 9.4 9.5*
Spain 1.9 2.9 1.9 1.4 6.8 1.9 4.3 8.7
Portugal 7.0 8.1 7.6 1.1 1.3 7.0 9.2 8.9
Source: European Commission (1999) ; * - 2010
Structural Funds have played an important role in Portuguese growth and
convergence.22 In 1986, when Portugal adhered to EU, Portuguese per capita income
corresponded to 55.1% of EU average. In 2000, that value had increased to 75.3%.
However, it remains a long way from the EU average; the European Commission’s
Second Cohesion Report predicts that it will be at least 20-30 years before this can be
attained. Furthermore, the expected convergence between Portuguese NUTS II regions
did not occur, as divergence increased slightly in recent years (Porto, 2002).
The 75% per capita GDP threshold for Objective 1 eligibility may be revised
upwards to ensure that regions currently eligible for assistance and whose need will
continue beyond 2006 are not rendered ineligible. The crucial point however is how the
additional effort required of an effective regional funding policy in the context of the
enlarged Union is to be financed. One solution would be to increase the limit of the “own
resources”; this limit was fixed at the Edinburgh Summit in 1992 and has not been
changed since then. However, the net contributory countries will hardly accept this
solution. The other - more realistic - solution, is related to the reform of the Common
Agricultural Policy (CAP). CAP expenditure is by far the largest item in the
Community’s global budget – accounting for around 40% of EU expenditures – and
exceeds regional development funding to a significant degree.
CAP reform is required not only because it is one of the main policies of the EU
in budgetary terms, but also because of the size of the agriculture sector in many
acceding countries. With enlargement the CAP becomes even more unsustainable,
21
At present, Cohesion Fund covers one sixth of the EU population. After the enlargement, if the criterion for eligibility is maintained, that value will increase to one third of the EU population.
22
increasing the imperative to shift its focus away from funding production towards the
funding of rural development. This would increase the resources available for regional
development as other monies are freed up.
Portugal is one of the countries that benefits least from the CAP, receiving only
1.6 % of total transfers. In fact, it is the only cohesion country that is a net contributor to
CAP. The transfer of part of current CAP expenditures into regional funding – entailing
abandoning the current limit of 0.46% of EU GDP for Structural Actions – would help
maintain the level of structural support that Portugal receives at present.
6. Conclusion
Enlargement will have important implications for Portugal. To some extent these
are already noticeable in the wake of the Europe Agreements. Portuguese exports bear a
strong similarity to those from Central and Eastern Europe, and have been losing EU
market share as the CEE economies expand. To this extent Portugal can be said to be
“being squeezed from below” in that its traditional export sectors are under threat. At the
same time, its specialisation has been increasingly confined to technology,
low-added-value sectors with declining demand, as strong FDI inflows to the CEEC has led to
an increasing preponderance of more dynamic sectors in their export structures. Thus it is
also “being squeezed from above”. This suggests that there may be substantial industrial
disruption, in response to which labour-market flexibility and dynamic entrepreneurial
response is crucial. A worrying aspect of this is that intersectoral mobility is generally
easier the more highly educated the workforce – an indicator on which Portugal scores
quite poorly.
For this reason, amongst others, many of the CEE countries are in a more
favourable position than Portugal with respect to future FDI inflows. Several have
followed Ireland’s lead in offering low rates of corporation taxes, the more advanced
ones have more highly skilled populations, and labour costs are generally lower than in
Portugal. Upon accession, they will have equally easy access to the high-income markets
integrated with the country’s FDI-oriented industrialisation strategy – appears to help explain its
of Western Europe and, if they learn their lessons correctly, are likely to enjoy stable
macro policy environments and regulatory and public administration systems equivalent
to those elsewhere in the EU. This opens up the possibility that they might compete
directly with Portugal, Spain and Ireland for FDI, as argued by Barry (2003). There is
indeed some evidence that this is already occurring in the case of Southern Europe.
Portugal may be particularly adversely affected given the relatively low human-capital
stock and deficiencies in the efficiency of the government sector.
While the former, in terms of education and training, can only be tackled as part
of a long-term development strategy, public-sector deficiencies and flaws in the conduct
of macroeconomic policy can be tackled more easily – if the political will to do so is
present.
Enlargement will also open up the possibility of more substantial labour
migration. Most studies estimate that inflows will be quite modest, with the majority of
migrants going to Germany and Austria. Portugal will receive only a very limited fraction
of these flows. The impact on wages and living standards will depend on the skills of the
migrants but if inflows are as modest as most studies suggest, these effects will be fairly
negligible. We have pointed out the possibility however that Portuguese emigrants may
be crowded-out from traditional destinations, putting further pressure on the Poruguese
labour market.
The implications of enlargement may be particularly adverse with respect to the
country’s eligibility for Structural Funds post-2006. The low average per capita income
of the CEEC will lead to the Cohesion Countries losing a large part of the funds they
have been receiving in recent years. Also as a consequence of the enlargement, two
Portuguese regions (Algarve and Madeira) will lose their Objective 1 status.
Portugal indeed may well stand to lose most from enlargement, as Baldwin et al.
(1997) and Breuss (2001) suggest. Nevertheless, the capacity to respond to this is
endogenous. One recalls historian Arnold Toynbee’s theory of “challenge and response”,
developed in his Study of History. All cultures and societies face various challenges. It is
References
Baldwin, R., J. Francois and R. Portes (1997), “The Costs and Benefits of Eastern Enlargement: the Impact on the EU and Central Europe”, Economic Policy, 24:125-76.
Barry, F. (2003), “EU Accession and Prospective FDI Flows to CEE Countries” in R. Lipsey and H. Herrmann (ed.) Foreign Direct Investment in the Real and Financing
Sector of Industrial Countries, Deutsche Bundesbank/Springer Verlag (forthcoming).
Barry, F. and A. Hannan (2003a), “Product Characteristics and the Growth of FDI”, Working Paper 03/08, University College Dublin, available at:
http://www.ucd.ie/~economic/workingpapers/2003.htm
Barry, F. and A. Hannan (2003b), “FDI and the Predictive Powers of Revealed Comparative Advantage Indicators”, unpublished ms., University College Dublin.
Bauer, T. and K. Zimmermann (1999), “Assessment of Possible Migration Pressure and its Labour Market Impact Following EU Enlargement to Central and Eastern Europe”,
IZA Research Report No. 3, Bonn.
Blomström, M. , A. Kooko and M. Zejan (2000), Foreign Direct Investment – Firmand
Host Country Stategies, New York: Palgrave.
Boeri, T. and H. Brücker (2000), “The Impact of Eastern Enlargement on Employment and Labour Markets in the EU Member States”, DIW, CEPR, FIEF, IGIER, HIS, Berlin and Milano.
Braconier, H. and K. Ekholm (2001), “Foreign Direct Investment in Central and Eastern Europe: Employment Effects in the EU”, CEPR Working Paper No. 3052.
Breuss, F. (2001), “Macroeconomic Effects of EU Enlargement for Old and New Members”, Working Paper No. 143, Austrian Institute of Economic Research (WIFO).
Brücker, H.(2001), “ The Impact of Eastern Enlargement on EU-Labour Markets”, CEPII
Working Paper No. 01/05.
Caetano, J. A. Galego, E. Vaz, C. Vieira and I. Vieira (2002), “The Eastward Enlargement of the Eurozone – Trade and FDI”, Ezoneplus Working Paper No. 7
CEPR(2002), “Who’s Afraid of the Big Enlargement?”, Policy Paper No. 7, Centre for
Economic Policy Research, London.