Carlos Pestana Barros & Nicolas Peypoch
A Comparative Analysis of Productivity Change in Italian and Portuguese Airports
WP 006/2007/DE _________________________________________________________
António Afonso and Christophe Rault
Bootstrap Panel Granger-Causality Between Government
Budget and External Deficits for the EU
WP 02/2009/DE/UECE _________________________________________________________
Department of Economics
W
ORKINGP
APERSISSN Nº0874-4548
School of Economics and Management
Bootstrap panel Granger-causality between government
budget and external deficits for the EU
*
António Afonso
$and Christophe Rault
#January 2009
Abstract
We investigate the existence of Granger-causality between current account and
government budget balances over the period 1970-2007, for different EU and OECD
country groupings. We use a panel-data approach based on SUR systems and Wald tests
with country specific bootstrap critical values. Our results show a causal relation from
budget deficits to current account deficits for several EU countries: Bulgaria, Czech
Republic, Estonia, Finland, France, Italy, Hungary, Lithuania, Poland, and Slovakia,
along the lines of the so-called twin-deficit relationship. Considering the effective real
exchange rate in the SUR system does not substantially alter the results.
Keywords: panel causality tests, budget deficit, external imbalance, real exchange rates,
EU, OECD.
JEL Classification Numbers: C23, E62, F32; H62.
*
The opinions expressed herein are those of the authors and do not necessarily reflect those of the European Central Bank or the Eurosystem.
$
ISEG/TULisbon - Technical University of Lisbon, Department of Economics; UECE – Research Unit on Complexity and Economics; R. Miguel Lupi 20, 1249-078 Lisbon, Portugal. UECE is supported by FCT (Fundação para a Ciência e a Tecnologia, Portugal), financed by ERDF and Portuguese funds. European Central Bank, Directorate General Economics, Kaiserstraße 29, D-60311 Frankfurt am Main, Germany. Emails: antonio.afonso@ecb.europa.eu, aafonso@iseg.utl.pt.
#
1. Introduction
The argument that a budget deficit leads to a current account deficit results from
the fact that budget deficit increases the domestic interest rate, and this attracts foreign
capital and induces an appreciation of the domestic currency, which in turn leads to an
increase in the current account deficit. Such an effect will be more relevant the higher
the economy’s degree of openness. In practice, the existence of a relationship between
the budgetary position of a country and its current account balance naturally needs to be
assessed empirically. While several studies have analysed the existence of convergence
(or divergence) between the trade and budgetary imbalances on a country basis, only a
few studies have taken advantage of the panel econometrics framework, particularly to
assess the question of our paper, the existence of Granger causality between the two
imbalances.
Empirical analysis does not necessarily provide a positive correlation between
the budget balance and the current account balance. Indeed, the existing evidence is
rather dissimilar, notably regarding single equation analysis, in the sense that budget
balance deteriorations may hardly impinge on the current account position. Overall
there is some mixed evidence in favour of a twin-deficits relationship, but this is neither
robust nor stable over time, which may imply that fiscal tightening may not diminish the
current account deficit. For related empirical analysis see, for instance, Bernheim
(1988), Chinn and Prasad (2003), Corsetti and Müller (2006), and Piersanti (2000),
while Afonso and Rault (2008) provide for a non-exhaustive overview of studies on this
topic.
Moreover, scarcely any evidence relates the specific issue of causality, either
unidirectional or bidirectional, between the two imbalances.
Therefore, this paper contributes to the literature with a bootstrap panel analysis
of causality between budget balances and external balances for the European Union and
OECD countries, during the period 1970-2007. In the approach we use, we allow for
cross-country correlation, without the need of pre-testing for unit roots, and such
methodology is explained in section two. Section three reports the empirical analysis
and section four concludes.
2. Panel Granger causality test methodology
We use a panel data approach developed by Kónya (2006), based on the
bud) or trivariate (here ca; bud; and real effective exchange rate, rex) finite-order vector
autoregressive models:
1 2
1 2
1, 1, , , 1, , , 1, ,
1 1
2, 2, , , 2, , , 2, ,
1 1
1,...,
1,...,
(1 )
1,...,
1,...,
(1 )
i i
i i
p p
it i i j i t j i j i t j i t
j j
p p
it i i j i t j i j i t j j t
j j
ca
ca
bud
t
T i
N
a
bud
ca
bud
t
T i
N
b
α
β
γ
ε
α
β
γ
ε
− − = = − − = =
⎧
=
+
+
+
=
=
⎪
⎪⎪
⎨
⎪
⎪
=
+
+
+
=
=
⎪⎩
∑
∑
∑
∑
(1)
and
1 2 3
1 2 3
1, 1, , , 1, , , 1, , , 1, ,
1 1 1
2, 2, , , 2, , , 2, , , 2, ,
1 1 1
1,..., 1,..., (2 )
1,..., 1,..
i i i
i i i
p p p
it i i j i t j i j i t j i j i t j i t
j j j
p p p
it i i j i t j i j i t j i j i t j i t
j j j
ca ca bud rex t T i N a
bud ca bud rex t T i
α
β
γ
η
ε
α
β
γ
η
ε
− − − = = = − − − = = = = + + + + = = = + + + + = =
∑
∑
∑
∑
∑
∑
.,N (2 )b⎧ ⎪ ⎪⎪ ⎨ ⎪ ⎪ ⎪⎩
(2)
where the index i
(
i
=
1
,...,
N
)
denotes the country, the index t
(
t
=
1
,...,
T
)
the period, j
the lag, and p1i, p2i and p3i, indicate the longest lags in the system. The error terms,
ε
1, ,i tand
ε
2, ,i t, are supposed to be white-noises (i.e. they have zero means, constant variances
and are individually serially uncorrelated) and may be correlated with each other for a
given country, but not across countries.
Systems (1) and (2) are estimated by the Seemingly Unrelated Regressions
(SUR) procedure (since possible links may exist among individual regressions via
contemporaneous correlation
1within equations (1a) and (1b) of system (1); and within
equations (2a) and (2b) of system (2)). Then Wald tests for Granger causality are
performed with country specific bootstrap critical values generated by simulations.
With respect to system (1) for instance, in country i there is one-way Granger- causality
running from bud to ca if in the first equation not all
γ
1,iare zero but in the second
all
β
2,iare zero; there is one-way Granger-causality from ca to bud if in the first equation
all
γ
1,iare zero but in the second not all
β
2,iare zero; there is two-way Granger-causality
1
between ca to bud if neither all
β
2,inor all
γ
1,iare zero; and there is no Granger-causality
between ca to bud if all
β
2,iand
γ
1,iare zero
2.
This procedure has several advantages. Firstly, it does not assume that the panel
is homogeneous, so it is possible to test for Granger-causality on each individual panel
member separately. However, since contemporaneous correlation is allowed across
countries, it makes possible to exploit the extra information provided by the panel data
setting. Secondly, this approach does not require pretesting for unit roots and
cointegration (since country specific bootstrap critical values are generated), though it
still requires the specification of the lag structure. This is an important feature since the
unit-root and cointegration tests in general suffer from low power, and different tests
often lead to contradictory outcomes. Thirdly, this panel Granger causality approach
allows the researcher to detect for how many and for which members of the panel there
exists one-way Granger-causality, two-way Granger-causality or no Granger-causality.
3. Econometric investigation
3.1 Data
All data for current account balances, general government budget balances and
real effective exchange rates are taken from the European Commission AMECO
(Annual Macro-Economic Data) database, from the IMF and from the OECD
databases.
3We consider four different country panels: EU15, EU25, Cgroup21, and
Cgroup26. The data cover respectively the periods from 1970 to 2007 for the EU15
countries, from 1996 to 2007 for the EU25 countries (i.e. EU27 without Cyprus and
Romania, due to short time span availability), from 1970 to 2007 for the Cgroup21 (i.e.
EU15 and Australia, Canada, Iceland, Japan, Norway, USA), and from 1987 to 2007 for
Cgroup26 (i.e. EU15 and Australia, Canada, Iceland, Japan, Korea, Mexico,
New-Zealand, Norway, Switzerland, Turkey, USA). The unbalanced panels within the period
1970-2007 are used for the SUR analysis and Granger-causality testing.
2
As stressed by Kónya (2006) this definition implies causality for one period ahead. Note that in the trivariate system our focus will remain on the bivariate, one-period-ahead relationship between ca and
bud, so we will not study the possibility of causality at longer horizons, nor the possibility of two variables jointly causing the third one. In other words, rex is treated here as an auxiliary variable, and will not be directly involved in the Granger causality analysis.
3
3.2 Empirical results
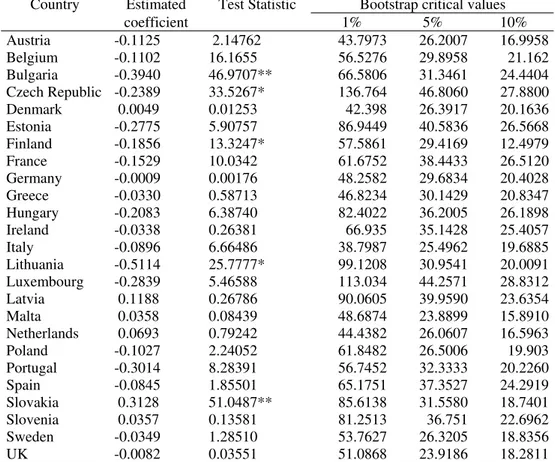
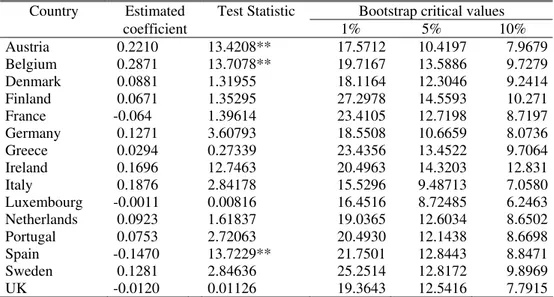
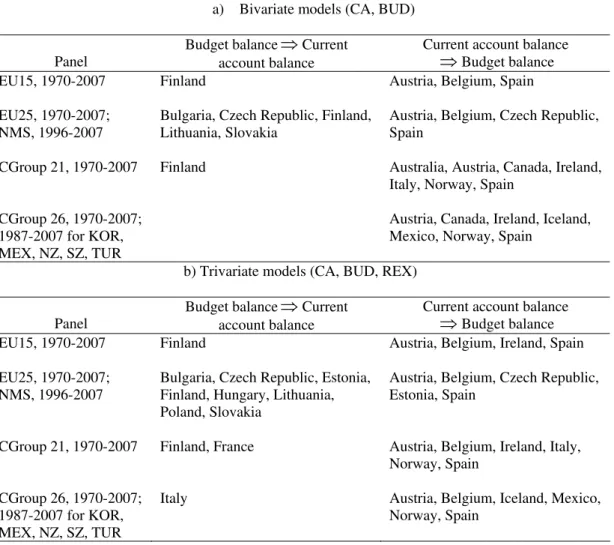
We report in Tables 1 and 2 the results for the Granger causality tests, using a
bivariate model, respectively from budget balances to current account balances, and
from current account balances to budget balances. Those tables present results for the
country groups EU15, EU25 and country group CGroup21, as previously defined.
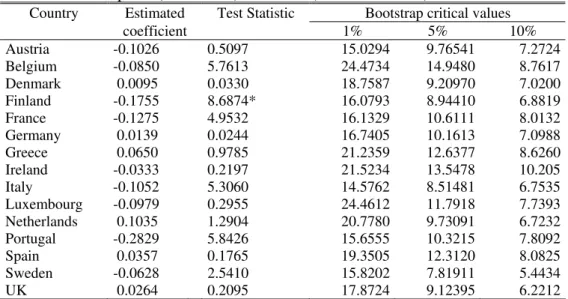
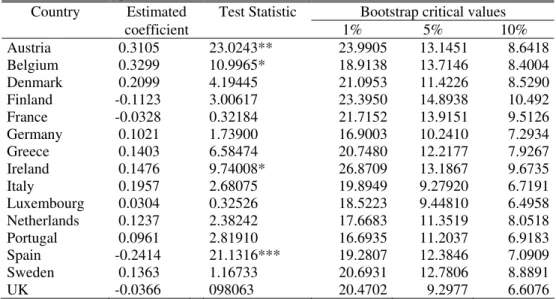
Tables 3 and 4 present a similar set of results for Granger causality tests regarding a
trivariate model where the effective real exchange rate is also included, while the
evidence on statistically significant causality is summarised in Table 5.
4Our results uncover the existence of one-way direct Granger causality from the
government budget balance to the current account balance, in the bivariate model, for
five EU countries: Bulgaria, Czech Republic, Finland, Lithuania, and Slovakia. Out of
this set of countries only Finland is not a New Member State (NMS) of the EU.
Interestingly, these results hold broadly when a trivariate specification is used, and the
effective real exchange rate is considered. In this case, there is also evidence of one-way
causality from the budget balances to the current account balances for some additional
countries: Estonia, Hungary, Poland, France and Italy.
The fact that the majority of the countries, for which causality from the budget
balance to the current account balance is found, are NMS, could be related to the
existence of higher interest rates in those countries, high inflows of foreign investment
and the appreciation of the respective domestic currencies. Notice that the time span
used in the analysis for the NMS covers the period 1996-2007, when these economies
followed a catching-up process, notably attracting foreign capital. Moreover, one can
conjecture that government budgets also contributed to such process notably by raising
internal demand. The evidence of causality from budget balances to the current balances
for France and Italy can also be related to relevant budgetary imbalances and higher
interest rates during the period used in the sample.
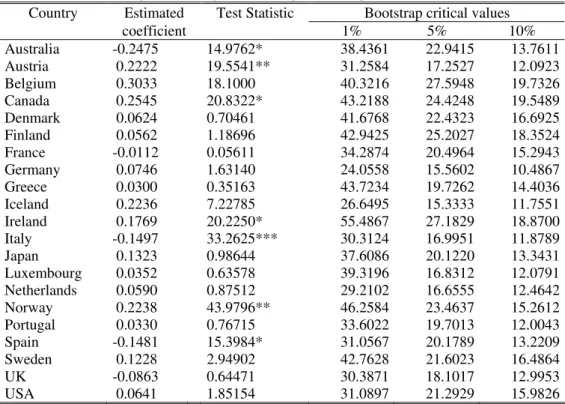
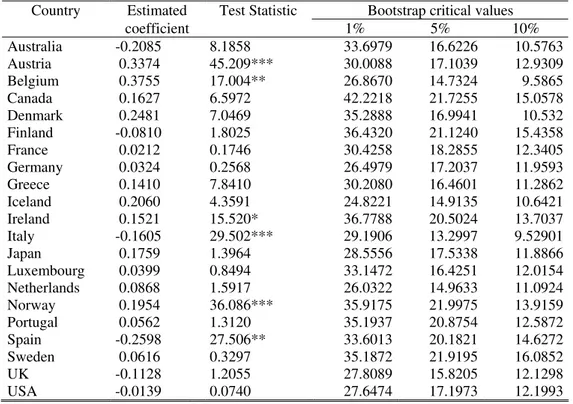
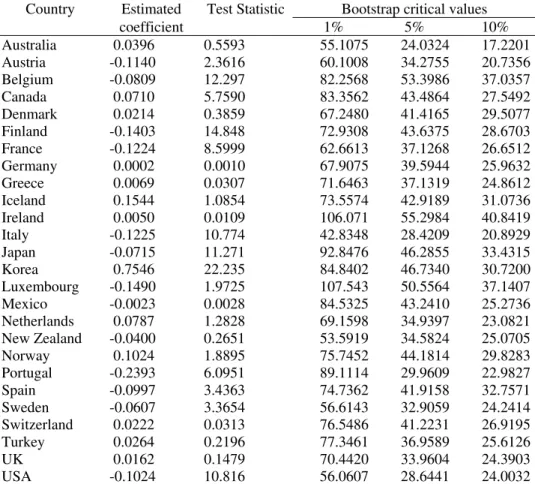
Regarding the existence of causality from the current account balances to the
budget balances, there is statistical evidence for a different set of countries; seven from
the EU (Austria, Belgium, Ireland, Spain, Czech Republic, Estonia, and Italy), and five
other non-EU countries (Australia, Canada, Norway, Iceland, and Mexico). Such
4
evidence is rather unchanged considering or not the effective real exchange rate in the
SUR system.
4. Conclusion
We investigated the existence of Granger-causality between current account and
government budget balances, with and without considering the effective real exchange
rate, over the period 1970-2007, for several EU and OECD country groupings. We used
the panel-data approach of Kónya (2006), which is based on SUR systems and Wald
tests with country specific bootstrap critical values.
Our results support the hypothesis of a causal relation from budget deficits to
current account deficits for several countries in the EU: Bulgaria, Czech Republic,
Estonia, Finland, France, Italy, Hungary, Lithuania, Poland, and Slovakia, along the
lines of the so-called twin-deficit relationship. On the other hand, the possibility of a
reverse causality is found to be statistically significant for a somewhat different sub-set
of OECD countries. Considering the effective real exchange rate in the SUR system
does not substantially alter the causality results.
References
Afonso, A. and Rault, C. (2008). “Budgetary and external imbalances relationship: a
panel data diagnostic”, ECB Working Paper n. 933.
Bernheim, B. (1988). “Budget Deficits and the Balance of Trade”, Tax Policy and the
Economy, 2.
Chinn, D. and Prasad, E. (2003). “Medium-term determinants of current accounts in
industrial and developing countries: an empirical exploration”, Journal of
International Economics, 59 (1), 47-76.
Corsetti, G. and Müller, G. (2006). “Twin Deficits: Squaring Theory, Evidence and
Common Sense”, Economic Policy, 21 (48), 597-638.
Kónya, L. (2006). “Exports and growth: Granger causality analysis on OECD countries
with a panel data approach”, Economic Modelling, 23, 978-982.
Piersanti, G. (2000). “Current Account Dynamics and Expected Future Budget Deficits:
some International Evidence”, Journal of International Money and Finance, 19 (2),
Table 1a – Granger causality tests from budget balances to current account balances for the EU15 panel (1970-2007), bivariate (CA, BUD) models
Country Estimated Test Statistic Bootstrap critical values
coefficient 1% 5% 10%
Austria -0.1218 1.9729 17.6089 9.9709 7.4661
Belgium -0.0960 9.0896 22.1543 14.934 10.314
Denmark 0.0091 0.0304 20.6241 9.8911 6.8413
Finland -0.1801 10.614** 15.3098 10.1621 7.0973
France -0.0955 2.8023 18.5248 10.9349 7.6774
Germany 0.0474 0.2793 18.4403 10.3510 6.2865
Greece -0.0146 0.0743 21.1807 13.2739 9.5517
Ireland -0.0155 0.0491 22.1727 14.7907 9.0896
Italy -0.0788 3.5063 22.0144 12.6893 8.9588
Luxembourg -0.1158 0.5750 24.1254 14.7569 9.2305
Netherlands 0.1178 1.6475 19.9103 11.1683 7.1957
Portugal -0.2672 5.6111 17.8247 9.73810 6.8028
Spain -0.0780 1.2446 24.8919 13.1370 8.8215
Sweden -0.0450 1.5160 18.9911 9.98609 6.0055
UK -0.0025 0.0241 20.2869 11.7501 8.7638
Notes: a) ***, ** and * denotes significance at the 1%, 5% and 10% levels, respectively. b) H0: BUD does not cause CA.
Table 1b – Granger causality tests from budget balances to current account balances for the EU25 panel (1970-2007, 1996-2007 for NMS), bivariate (CA, BUD) models
Country Estimated Test Statistic Bootstrap critical values
coefficient 1% 5% 10%
Austria -0.1125 2.14762 43.7973 26.2007 16.9958
Belgium -0.1102 16.1655 56.5276 29.8958 21.162
Bulgaria -0.3940 46.9707** 66.5806 31.3461 24.4404
Czech Republic -0.2389 33.5267* 136.764 46.8060 27.8800
Denmark 0.0049 0.01253 42.398 26.3917 20.1636
Estonia -0.2775 5.90757 86.9449 40.5836 26.5668
Finland -0.1856 13.3247* 57.5861 29.4169 12.4979
France -0.1529 10.0342 61.6752 38.4433 26.5120
Germany -0.0009 0.00176 48.2582 29.6834 20.4028
Greece -0.0330 0.58713 46.8234 30.1429 20.8347
Hungary -0.2083 6.38740 82.4022 36.2005 26.1898
Ireland -0.0338 0.26381 66.935 35.1428 25.4057
Italy -0.0896 6.66486 38.7987 25.4962 19.6885
Lithuania -0.5114 25.7777* 99.1208 30.9541 20.0091
Luxembourg -0.2839 5.46588 113.034 44.2571 28.8312
Latvia 0.1188 0.26786 90.0605 39.9590 23.6354
Malta 0.0358 0.08439 48.6874 23.8899 15.8910
Netherlands 0.0693 0.79242 44.4382 26.0607 16.5963
Poland -0.1027 2.24052 61.8482 26.5006 19.903
Portugal -0.3014 8.28391 56.7452 32.3333 20.2260
Spain -0.0845 1.85501 65.1751 37.3527 24.2919
Slovakia 0.3128 51.0487** 85.6138 31.5580 18.7401
Slovenia 0.0357 0.13581 81.2513 36.751 22.6962
Sweden -0.0349 1.28510 53.7627 26.3205 18.8356
UK -0.0082 0.03551 51.0868 23.9186 18.2811
Table 1c – Granger causality tests from budget balances to current account balances for the Cgroup21 panel (1970-2007), bivariate (CA, BUD) models
Country Estimated Test Statistic Bootstrap critical values
coefficient 1% 5% 10%
Australia 0.0987 2.47781 22.3057 12.2437 8.03210
Austria -0.1610 4.09952 35.7949 21.2883 11.8195
Belgium -0.0712 8.59699 48.5488 24.7881 16.5793
Canada 0.0543 2.59082 34.0876 19.4779 13.8906
Denmark 0.0238 0.40652 33.4390 19.0888 12.8996
Finland -0.1540 13.3932* 35.8901 20.3575 13.3019
France -0.1148 6.44631 41.9754 21.7033 15.3719
Germany -0.0118 0.02399 31.9677 17.1553 9.69146
Greece -0.0047 0.01174 35.8497 24.0044 17.3849
Iceland -0.0950 5.84384 31.2546 14.9175 10.3450
Ireland -0.0104 0.03865 41.8438 21.6514 15.7192
Italy 0.1649 0.86808 31.7055 18.2363 13.2669
Japan -0.0656 7.76730 40.9027 20.8168 15.8255
Luxembourg -0.1858 1.84990 41.3271 23.2244 14.4388
Netherlands 0.1363 2.76275 31.8408 17.2845 11.1476
Norway 0.0731 0.73817 42.6422 22.4094 15.6983
Portugal -0.2707 7.26021 35.1842 21.9296 13.7191
Spain -0.0832 1.57094 50.8964 24.5849 17.0351
Sweden -0.0465 1.82871 34.6576 17.3003 12.4461
UK 0.0376 0.67360 33.3215 19.2197 12.8902
USA -0.1016 7.62654 27.2683 14.5142 9.69367
Notes: a) ***, ** and * denotes significance at the 1%, 5% and 10% levels, respectively. b) H0: BUD does not cause CA.
Table 2a – Granger causality tests from current account balances to budget balances for the EU15 panel (1970-2007), bivariate (CA, BUD) models
Country Estimated Test Statistic Bootstrap critical values
coefficient 1% 5% 10%
Austria 0.2210 13.4208** 17.5712 10.4197 7.9679
Belgium 0.2871 13.7078** 19.7167 13.5886 9.7279
Denmark 0.0881 1.31955 18.1164 12.3046 9.2414
Finland 0.0671 1.35295 27.2978 14.5593 10.271
France -0.064 1.39614 23.4105 12.7198 8.7197
Germany 0.1271 3.60793 18.5508 10.6659 8.0736
Greece 0.0294 0.27339 23.4356 13.4522 9.7064
Ireland 0.1696 12.7463 20.4963 14.3203 12.831
Italy 0.1876 2.84178 15.5296 9.48713 7.0580
Luxembourg -0.0011 0.00816 16.4516 8.72485 6.2463
Netherlands 0.0923 1.61837 19.0365 12.6034 8.6502
Portugal 0.0753 2.72063 20.4930 12.1438 8.6698
Spain -0.1470 13.7229** 21.7501 12.8443 8.8471
Sweden 0.1281 2.84636 25.2514 12.8172 9.8969
UK -0.0120 0.01126 19.3643 12.5416 7.7915
Table 2b – Granger causality tests from current account balances to budget balances for the EU25 panel (1970-2007, 1996-2007 for NMS), bivariate (CA, BUD) models
Country Estimated Test Statistic Bootstrap critical values
coefficient 1% 5% 10%
Austria 0.2477 27.0823** 51.4192 27.0725 18.8457
Belgium 0.3395 22.9939* 60.7129 33.9597 22.8654
Bulgaria -0.1214 6.53548 81.7843 43.1901 29.6061
Czech Republic 1.1697 280.073*** 85.5306 50.0388 37.0912
Denmark 0.0937 2.05593 65.1437 36.1363 24.1356
Estonia -0.1068 10.3509 55.9677 27.9963 18.7136
Finland 0.0805 2.91939 67.3981 36.3683 24.804
France -0.0055 0.01425 68.8777 37.0922 25.8136
Germany 0.1413 6.81759 53.1155 29.7250 20.3780
Greece 0.0226 0.20797 61.2141 33.9221 23.2058
Hungary 0.2563 21.7206 76.0673 40.0727 27.3466
Ireland 0.1860 17.8076 69.9690 36.2288 24.8724
Italy 0.2078 6.81759 56.3698 30.9851 21.3829
Lithuania 0.1266 8.13473 58.6948 27.3797 17.9579
Luxembourg 0.0464 1.08615 49.6066 25.7339 17.4109
Latvia 0.0025 0.07720 52.4671 25.8900 17.0370
Malta 0.1703 7.68076 73.7735 35.1349 23.2672
Netherlands 0.0907 3.29045 60.7695 33.2827 22.7975
Poland 0.2553 6.49466 66.5200 35.5261 23.944
Portugal 0.0889 5.49646 55.3221 28.6983 19.2603
Spain -0.1721 34.5352** 62.9539 33.0983 22.6032
Slovakia 0.0635 0.19904 80.6109 45.4936 30.8208
Slovenia 0.0789 1.44234 147.694 71.0913 48.2888
Sweden 0.2082 9.97688 65.2674 36.0752 24.7731
UK 0.2477 1.00451 61.465 30.7354 21.4484
Notes: a) ***, ** and * denotes significance at the 1%, 5% and 10% levels, respectively. b) H0: CA does not cause BUD.
Table 2c – Granger causality tests from current account balances to for the Cgroup21 panel (1970-2007), bivariate (CA, BUD) models
Country Estimated Test Statistic Bootstrap critical values
coefficient 1% 5% 10%
Australia -0.2475 14.9762* 38.4361 22.9415 13.7611
Austria 0.2222 19.5541** 31.2584 17.2527 12.0923
Belgium 0.3033 18.1000 40.3216 27.5948 19.7326
Canada 0.2545 20.8322* 43.2188 24.4248 19.5489
Denmark 0.0624 0.70461 41.6768 22.4323 16.6925
Finland 0.0562 1.18696 42.9425 25.2027 18.3524
France -0.0112 0.05611 34.2874 20.4964 15.2943
Germany 0.0746 1.63140 24.0558 15.5602 10.4867
Greece 0.0300 0.35163 43.7234 19.7262 14.4036
Iceland 0.2236 7.22785 26.6495 15.3333 11.7551
Ireland 0.1769 20.2250* 55.4867 27.1829 18.8700
Italy -0.1497 33.2625*** 30.3124 16.9951 11.8789
Japan 0.1323 0.98644 37.6086 20.1220 13.3431
Luxembourg 0.0352 0.63578 39.3196 16.8312 12.0791
Netherlands 0.0590 0.87512 29.2102 16.6555 12.4642
Norway 0.2238 43.9796** 46.2584 23.4637 15.2612
Portugal 0.0330 0.76715 33.6022 19.7013 12.0043
Spain -0.1481 15.3984* 31.0567 20.1789 13.2209
Sweden 0.1228 2.94902 42.7628 21.6023 16.4864
UK -0.0863 0.64471 30.3871 18.1017 12.9953
USA 0.0641 1.85154 31.0897 21.2929 15.9826
Table 3a – Granger causality tests from budget balances to current account balances for the EU15 panel (1970-2007), trivariate (CA, BUD, REX) models
Country Estimated Test Statistic Bootstrap critical values
coefficient 1% 5% 10%
Austria -0.1026 0.5097 15.0294 9.76541 7.2724
Belgium -0.0850 5.7613 24.4734 14.9480 8.7617
Denmark 0.0095 0.0330 18.7587 9.20970 7.0200
Finland -0.1755 8.6874* 16.0793 8.94410 6.8819
France -0.1275 4.9532 16.1329 10.6111 8.0132
Germany 0.0139 0.0244 16.7405 10.1613 7.0988
Greece 0.0650 0.9785 21.2359 12.6377 8.6260
Ireland -0.0333 0.2197 21.5234 13.5478 10.205
Italy -0.1052 5.3060 14.5762 8.51481 6.7535
Luxembourg -0.0979 0.2955 24.4612 11.7918 7.7393
Netherlands 0.1035 1.2904 20.7780 9.73091 6.7232
Portugal -0.2829 5.8426 15.6555 10.3215 7.8092
Spain 0.0357 0.1765 19.3505 12.3120 8.0825
Sweden -0.0628 2.5410 15.8202 7.81911 5.4434
UK 0.0264 0.2095 17.8724 9.12395 6.2212
Notes: a) ***, ** and * denotes significance at the 1%, 5% and 10% levels, respectively. b) H0: BUD does not cause CA.
Table 3b – Granger causality tests from budget balances to current account balances for the
EU25 panel (1970-2007, 1996-2007 for NMS), trivariate (CA, BUD, REX) models
Country Estimated Test Statistic Bootstrap critical values
coefficient 1% 5% 10%
Austria -0.0886 0.5542 41.3010 28.9222 19.2597
Belgium -0.1080 12.467 52.6592 27.4962 17.2239
Bulgaria -0.3604 30.132* 97.1317 46.9680 29.8037
Czech Republic -0.2999 48.945** 94.0543 42.4680 22.0298
Denmark 0.0077 0.0312 41.7944 23.9718 17.2537
Estonia -0.5042 24.019* 87.5025 30.0444 20.2046
Finland -0.2016 14.779* 60.0785 30.4698 14.3326
France -0.1610 11.020 52.2093 26.1209 18.8321
Germany -0.0325 0.2748 46.2398 27.5085 18.8700
Greece 0.0209 0.1388 38.2880 22.4442 16.1207
Hungary -0.4590 25.318* 49.8247 30.8239 19.858
Ireland -0.0525 0.6206 46.1688 25.7545 18.2065
Italy -0.1011 6.9862 32.5002 20.6835 14.6002
Lithuania -0.6572 58.804** 233.146 45.1415 23.5948
Luxembourg -0.2871 3.7869 45.0295 26.2708 19.1888
Latvia -0.0694 0.1149 67.0000 35.8248 27.0371
Malta -0.2203 0.9705 50.9769 31.7786 21.2535
Netherlands 0.0697 0.7486 40.7907 23.8351 16.1974
Poland -0.2310 25.698* 65.6607 27.4022 19.0187
Portugal -0.2760 6.4198 34.2515 23.7551 17.9555
Spain 0.0334 0.1867 22.6425 12.9124 9.4359
Slovakia 0.2889 44.200** 95.2704 31.8745 15.8232
Slovenia 0.0376 0.0911 89.2911 35.7054 19.0756
Sweden -0.0313 0.9367 54.5721 24.4355 16.4764
UK -0.0011 0.0054 53.1380 21.5314 16.3642
Table 3c – Granger causality tests from budget balances to current account balances for the Cgroup21 panel (1970-2007), trivariate (CA, BUD, REX) models
Country Estimated Test Statistic Bootstrap critical values
coefficient 1% 5% 10%
Australia 0.1099 3.1356 23.3271 13.7527 9.8809
Austria -0.0752 0.3189 36.7478 18.3407 11.8442
Belgium -0.0713 6.5864 37.2762 22.5548 14.6701
Canada 0.0821 4.9609 32.2149 19.9396 13.216
Denmark -0.0045 0.0149 29.2877 16.6354 12.2823
Finland -0.1641 11.686* 34.7298 15.2402 11.1207
France -0.1647 12.163* 27.7623 17.0333 10.8271
Germany -0.0330 0.1901 25.0917 12.7338 8.8758
Greece 0.0531 0.8846 33.6928 17.3848 12.7044
Iceland -0.1230 8.3372 28.1537 13.5040 8.8506
Ireland -0.0458 0.6667 32.9734 21.7877 15.2148
Italy 0.2256 1.3431 35.0153 18.2313 12.5074
Japan -0.0430 2.6465 42.5990 21.2979 13.5377
Luxembourg -0.1024 0.4008 24.8104 14.4957 11.1564
Netherlands 0.1233 2.1646 27.7951 12.5450 9.8458
Norway 0.0683 0.7042 32.0350 17.1179 11.8143
Portugal -0.2600 5.7540 34.4611 18.1117 11.9898
Spain 0.0760 0.8992 15.6560 9.01711 6.8910
Sweden -0.0484 1.8375 32.9308 19.4626 11.2882
UK 0.0622 1.4544 28.3879 15.3956 9.7831
USA -0.0933 5.3514 20.8200 14.2052 9.6816
Notes: a) ***, ** and * denotes significance at the 1%, 5% and 10% levels, respectively. b) H0: BUD does not cause CA.
Table 4a – Granger causality tests from current account balances to budget balances for the EU15 panel (1970-2007), trivariate (CA, BUD, REX) models
Country Estimated Test Statistic Bootstrap critical values
coefficient 1% 5% 10%
Austria 0.3105 23.0243** 23.9905 13.1451 8.6418
Belgium 0.3299 10.9965* 18.9138 13.7146 8.4004
Denmark 0.2099 4.19445 21.0953 11.4226 8.5290
Finland -0.1123 3.00617 23.3950 14.8938 10.492
France -0.0328 0.32184 21.7152 13.9151 9.5126
Germany 0.1021 1.73900 16.9003 10.2410 7.2934
Greece 0.1403 6.58474 20.7480 12.2177 7.9267
Ireland 0.1476 9.74008* 26.8709 13.1867 9.6735
Italy 0.1957 2.68075 19.8949 9.27920 6.7191
Luxembourg 0.0304 0.32526 18.5223 9.44810 6.4958
Netherlands 0.1237 2.38242 17.6683 11.3519 8.0518
Portugal 0.0961 2.81910 16.6935 11.2037 6.9183
Spain -0.2414 21.1316*** 19.2807 12.3846 7.0909
Sweden 0.1363 1.16733 20.6931 12.7806 8.8891
UK -0.0366 098063 20.4702 9.2977 6.6076
Table 4b – Granger causality tests from current account balances to budget balances for the EU25 panel (1970-2007, 1996-2007 for NMS), trivariate (CA, BUD, REX) models
Country Estimated Test Statistic Bootstrap critical values
coefficient 1% 5% 10%
Austria 0.3050 29.04767** 42.7471 24.1836 16.5038
Belgium 0.4419 24.14173** 44.5815 22.9847 16.0922
Bulgaria 0.1012 4.921740 83.4110 47.5966 32.8049
Czech Republic 1.0058 189.0767*** 81.9272 47.2400 33.9191
Denmark 0.3214 12.06610 45.6130 23.8499 16.3219
Estonia -0.4970 63.51770** 76.1912 40.1880 26.3485
Finland -0.0743 1.722820 52.7297 29.5373 19.9807
France 0.0400 0.655909 56.3607 29.6258 20.3324
Germany 0.0959 2.407945 48.4721 26.2896 17.8287
Greece 0.1639 12.14297 40.1092 21.0431 14.6201
Hungary 0.0796 2.062641 72.1796 33.6867 22.3112
Ireland 0.1083 6.430092 48.7012 26.8627 18.9128
Italy 0.2795 10.92041 48.7678 26.3480 17.9711
Lithuania 0.1714 7.143020 76.0781 36.7169 23.5873
Luxembourg 0.0540 1.890863 46.5044 24.769 15.9973
Latvia -0.1244 14.67002 65.3116 31.6509 20.1739
Malta 0.1228 4.605291 64.0031 29.6390 19.2660
Netherlands 0.1049 2.800345 48.6511 25.6354 17.4253
Poland 0.1196 1.117126 80.1080 41.3626 28.829
Portugal 0.1200 7.354238 49.0942 25.1161 17.5189
Spain -0.2368 30.73627** 50.2643 27.6916 19.2412
Slovakia -0.5469 10.61160 84.9531 46.0851 30.9879
Slovenia -0.1804 27.24954 109.768 47.6334 29.6841
Sweden 0.1536 2.100697 61.2883 32.0168 22.1453
UK -0.1172 1.747915 49.2910 25.5140 17.4726
Notes: a) ***, ** and * denotes significance at the 1%, 5% and 10% levels, respectively. b) H0: CA does not cause BUD.
Table 4c – Granger causality tests from current account balances to budget balances for the Cgroup21 panel (1970-2007), trivariate (CA, BUD, REX) models
Country Estimated Test Statistic Bootstrap critical values
coefficient 1% 5% 10%
Australia -0.2085 8.1858 33.6979 16.6226 10.5763
Austria 0.3374 45.209*** 30.0088 17.1039 12.9309
Belgium 0.3755 17.004** 26.8670 14.7324 9.5865
Canada 0.1627 6.5972 42.2218 21.7255 15.0578
Denmark 0.2481 7.0469 35.2888 16.9941 10.532
Finland -0.0810 1.8025 36.4320 21.1240 15.4358
France 0.0212 0.1746 30.4258 18.2855 12.3405
Germany 0.0324 0.2568 26.4979 17.2037 11.9593
Greece 0.1410 7.8410 30.2080 16.4601 11.2862
Iceland 0.2060 4.3591 24.8221 14.9135 10.6421
Ireland 0.1521 15.520* 36.7788 20.5024 13.7037
Italy -0.1605 29.502*** 29.1906 13.2997 9.52901
Japan 0.1759 1.3964 28.5556 17.5338 11.8866
Luxembourg 0.0399 0.8494 33.1472 16.4251 12.0154
Netherlands 0.0868 1.5917 26.0322 14.9633 11.0924
Norway 0.1954 36.086*** 35.9175 21.9975 13.9159
Portugal 0.0562 1.3120 35.1937 20.8754 12.5872
Spain -0.2598 27.506** 33.6013 20.1821 14.6272
Sweden 0.0616 0.3297 35.1872 21.9195 16.0852
UK -0.1128 1.2055 27.8089 15.8205 12.1298
USA -0.0139 0.0740 27.6474 17.1973 12.1993
Table 5 – Summary of results
a) Bivariate models (CA, BUD)
Panel
Budget balance
⇒
Current account balanceCurrent account balance
⇒
Budget balanceEU15, 1970-2007 Finland Austria, Belgium, Spain
EU25, 1970-2007; NMS, 1996-2007
Bulgaria, Czech Republic, Finland, Lithuania, Slovakia
Austria, Belgium, Czech Republic, Spain
CGroup 21, 1970-2007 Finland Australia, Austria, Canada, Ireland, Italy, Norway, Spain
CGroup 26, 1970-2007; 1987-2007 for KOR, MEX, NZ, SZ, TUR
Austria, Canada, Ireland, Iceland, Mexico, Norway, Spain
b) Trivariate models (CA, BUD, REX)
Panel
Budget balance
⇒
Current account balanceCurrent account balance
⇒
Budget balance EU15, 1970-2007 Finland Austria, Belgium, Ireland, SpainEU25, 1970-2007; NMS, 1996-2007
Bulgaria, Czech Republic, Estonia, Finland, Hungary, Lithuania, Poland, Slovakia
Austria, Belgium, Czech Republic, Estonia, Spain
CGroup 21, 1970-2007 Finland, France Austria, Belgium, Ireland, Italy, Norway, Spain
CGroup 26, 1970-2007; 1987-2007 for KOR, MEX, NZ, SZ, TUR
Italy Austria, Belgium, Iceland, Mexico,
Appendix
Table A1 – Granger causality tests from budget balances to current account balances for the Cgroup26 panel (1970-2007, 1987-2007 for KOR, MEX, NZ, SWZ, TUR), bivariate models
(CA, BUD)
Country Estimated Test Statistic Bootstrap critical values
coefficient 1% 5% 10%
Australia 0.0396 0.5593 55.1075 24.0324 17.2201
Austria -0.1140 2.3616 60.1008 34.2755 20.7356
Belgium -0.0809 12.297 82.2568 53.3986 37.0357
Canada 0.0710 5.7590 83.3562 43.4864 27.5492
Denmark 0.0214 0.3859 67.2480 41.4165 29.5077
Finland -0.1403 14.848 72.9308 43.6375 28.6703
France -0.1224 8.5999 62.6613 37.1268 26.6512
Germany 0.0002 0.0010 67.9075 39.5944 25.9632
Greece 0.0069 0.0307 71.6463 37.1319 24.8612
Iceland 0.1544 1.0854 73.5574 42.9189 31.0736
Ireland 0.0050 0.0109 106.071 55.2984 40.8419
Italy -0.1225 10.774 42.8348 28.4209 20.8929
Japan -0.0715 11.271 92.8476 46.2855 33.4315
Korea 0.7546 22.235 84.8402 46.7340 30.7200
Luxembourg -0.1490 1.9725 107.543 50.5564 37.1407
Mexico -0.0023 0.0028 84.5325 43.2410 25.2736
Netherlands 0.0787 1.2828 69.1598 34.9397 23.0821
New Zealand -0.0400 0.2651 53.5919 34.5824 25.0705
Norway 0.1024 1.8895 75.7452 44.1814 29.8283
Portugal -0.2393 6.0951 89.1114 29.9609 22.9827
Spain -0.0997 3.4363 74.7362 41.9158 32.7571
Sweden -0.0607 3.3654 56.6143 32.9059 24.2414
Switzerland 0.0222 0.0313 76.5486 41.2231 26.9195
Turkey 0.0264 0.2196 77.3461 36.9589 25.6126
UK 0.0162 0.1479 70.4420 33.9604 24.3903
USA -0.1024 10.816 56.0607 28.6441 24.0032
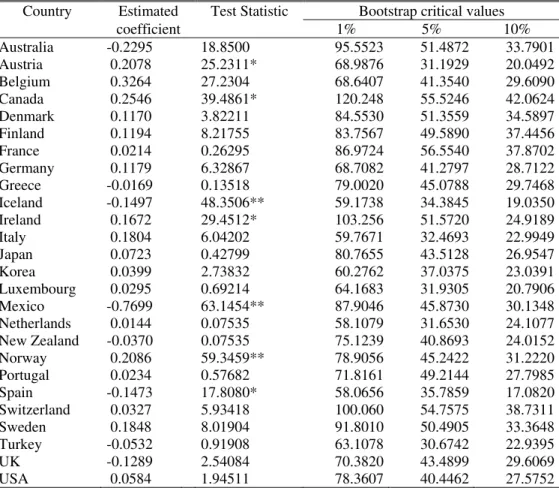
Table A2 – Granger causality tests from current account balances to budget balances for the Cgroup26 panel (1970-2007, 1987-2007 for KOR, MEX, NZ, SWZ, TUR), bivariate models
(CA, BUD)
Country Estimated Test Statistic Bootstrap critical values
coefficient 1% 5% 10%
Australia -0.2295 18.8500 95.5523 51.4872 33.7901
Austria 0.2078 25.2311* 68.9876 31.1929 20.0492
Belgium 0.3264 27.2304 68.6407 41.3540 29.6090
Canada 0.2546 39.4861* 120.248 55.5246 42.0624
Denmark 0.1170 3.82211 84.5530 51.3559 34.5897
Finland 0.1194 8.21755 83.7567 49.5890 37.4456
France 0.0214 0.26295 86.9724 56.5540 37.8702
Germany 0.1179 6.32867 68.7082 41.2797 28.7122
Greece -0.0169 0.13518 79.0020 45.0788 29.7468
Iceland -0.1497 48.3506** 59.1738 34.3845 19.0350
Ireland 0.1672 29.4512* 103.256 51.5720 24.9189
Italy 0.1804 6.04202 59.7671 32.4693 22.9949
Japan 0.0723 0.42799 80.7655 43.5128 26.9547
Korea 0.0399 2.73832 60.2762 37.0375 23.0391
Luxembourg 0.0295 0.69214 64.1683 31.9305 20.7906
Mexico -0.7699 63.1454** 87.9046 45.8730 30.1348
Netherlands 0.0144 0.07535 58.1079 31.6530 24.1077
New Zealand -0.0370 0.07535 75.1239 40.8693 24.0152
Norway 0.2086 59.3459** 78.9056 45.2422 31.2220
Portugal 0.0234 0.57682 71.8161 49.2144 27.7985
Spain -0.1473 17.8080* 58.0656 35.7859 17.0820
Switzerland 0.0327 5.93418 100.060 54.7575 38.7311
Sweden 0.1848 8.01904 91.8010 50.4905 33.3648
Turkey -0.0532 0.91908 63.1078 30.6742 22.9395
UK -0.1289 2.54084 70.3820 43.4899 29.6069
USA 0.0584 1.94511 78.3607 40.4462 27.5752
Table A3 – Granger causality tests from budget balances to current account balances for the Cgroup26 panel (1970-2007, 1987-2007 for KOR, MEX, NZ, SWZ, TUR), trivariate models
(CA, BUD, REX)
Country Estimated Test Statistic Bootstrap critical values
coefficient 1% 5% 10%
Australia 0.0556 1.1275 39.9353 22.4305 15.9843
Austria -0.0735 0.3612 43.2500 30.7355 19.8910
Belgium -0.0659 6.2091 59.5578 32.6318 21.5883
Canada 0.0966 8.7609 46.6443 31.1869 21.7066
Denmark 0.0050 0.0230 45.9528 26.1360 17.6729
Finland -0.1393 10.608 59.4901 33.9534 23.4073
France -0.1717 15.860 50.5747 30.6981 19.8585
Germany -0.0593 0.7399 47.7725 25.3301 18.4327
Greece 0.0691 1.7506 42.0274 25.6047 18.2143
Iceland 0.2433 2.1268 54.3961 29.8410 21.7062
Ireland -0.0054 0.0121 54.9843 35.4853 25.2352
Italy -0.1496 13.736* 48.0327 18.9687 13.4259
Japan -0.0588 6.3269 59.8752 38.7450 27.3470
Korea 0.6313 11.814 56.7566 37.1544 22.7816
Luxembourg -0.0884 0.4841 64.5009 35.8000 24.8792
Mexico -0.0809 2.8496 35.9138 23.3197 16.4050
Netherlands 0.1226 2.9266 54.0106 24.9500 16.3664
New Zealand -0.0474 0.3156 48.2675 24.3151 16.1930
Norway 0.0996 1.8809 52.3565 32.7913 22.1626
Portugal -0.2316 5.0119 57.250 27.0146 19.3697
Spain 0.0403 0.3199 24.9863 17.4461 11.2073
Sweden -0.0468 1.8116 55.1535 29.6352 18.7367
Switzerland 0.0222 0.0862 67.8427 34.4097 23.3951
Turkey 0.0148 0.0455 48.7912 32.4513 23.1931
UK 0.0302 0.4363 43.7328 25.7231 16.3385
USA -0.1095 10.538 41.9155 21.0433 14.6832
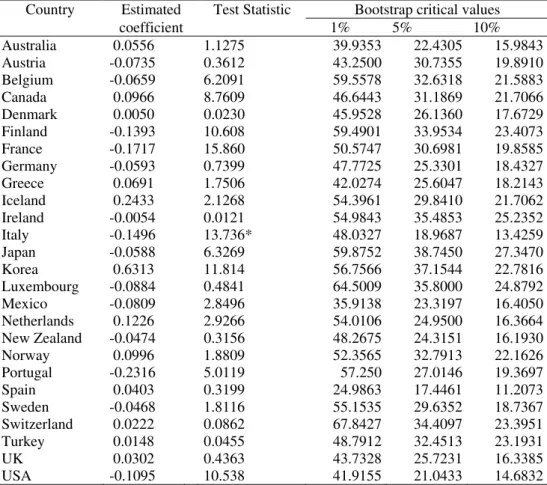
Table A4 – Granger causality tests from current account balances to budget balances for the Cgroup26 panel (1970-2007, 1987-2007 for KOR, MEX, NZ, SWZ, TUR), trivariate models
(CA, BUD, REX)
Country Estimated Test Statistic Bootstrap critical values
coefficient 1% 5% 10%
Australia -0.1655 8.7104 54.1639 33.0308 21.8734
Austria 0.3048 55.245*** 55.1421 32.6740 21.5371
Belgium 0.3710 22.438* 48.8503 28.0876 20.4877
Canada 0.1211 6.0820 61.8913 43.0496 31.1421
Denmark 0.2154 10.419 57.0436 37.0555 22.8651
Finland -0.0982 3.9222 59.0244 39.7540 27.8795
France 0.0382 0.7961 73.0054 38.2013 27.4366
Germany 0.0026 0.0022 56.5285 27.5070 18.5895
Greece 0.0945 4.7533 60.4405 28.3771 17.4979
Iceland -0.1654 45.543*** 36.6003 19.4342 14.9104
Ireland 0.1381 16.060 61.6908 36.4965 24.3072
Italy 0.1870 4.8632 42.7536 27.0309 20.5896
Japan 0.0624 0.2977 54.0851 30.8936 19.7079
Korea 0.0229 0.8137 39.1036 23.4657 16.4832
Luxembourg 0.0441 1.5859 47.2989 29.7339 18.2610
Mexico -0.7731 47.226** 76.2906 35.8339 23.9523
Netherlands 0.0246 0.1776 53.9507 28.1421 18.8478
New Zealand -0.0393 0.7025 57.8516 33.4878 22.5199
Norway 0.1742 42.861** 75.1211 34.7805 25.6494
Portugal 0.0288 0.4896 40.5507 26.7923 18.4358
Spain -0.2841 41.782** 61.6380 30.4673 22.0187
Sweden 0.0431 0.1888 60.4607 40.2029 30.8044
Switzerland 0.0472 10.632 73.4669 38.3930 26.6594
Turkey 0.0134 0.0408 40.6889 25.3480 17.3184
UK -0.0918 1.7038 59.8360 27.7520 20.7588
USA -0.0013 0.8460 45.7550 29.4962 22.0389