New method for the measurement of fibres orientation on the paper faces
applied to the analysis of hygro-instability in paper sheets
A.P.Costa‡, M.J.Pereira†, A.C. Trindade†, P.T.Fiadeiro†, J.Silvy‡, J.M.Serra Tosio*
† University of Beira Interior, Optical Centre, 6200-Covilhã, Portugal,
‡ University of Beira Interior, Department of Science and Technology of Paper, 6200-Covilhã, Portugal
*École Francaise de Papeterie et des Industries Graphiques, BP.65 –38402 Saint Martin d’Heres ,Françe
1. Introduction
For a given change in the humidity of a paper the hygro-instability of the sheet depends of two main factors: − the sheet structural parameters which reflects its structure this are: the sheet porosity, the fibres
orientation distribution mainly in the sheet plane and the variations of these parameters across the paper sheet thickness.
− the water reactivity of the components of the paper sheet which depends mainly of the sheet composition: the cellulosic and the fillers content, the nature of the fibres, softwood or hardwood, their degree of delignification, the beating degree of the pulp, the fines content, the conditions of the sheet drying with a more or less conditions of restraint.
In this research initiated at the University of Beira Interior with the collaboration of the Ecole Française de Papeterie – France, we have tried to identify these main parameters of the paper hygro-instability.
For this purpose we characterise the sheet structural parameters by optical methods developed at the Optical Centre of University of Beira Interior. The first method: light diffraction analysis, is able to characterise the fibre orientation of a paper sheet on both sides, that is the wire and the felt sides. The second method is based on a measurement across the sheet thickness by light transmission analysis. Both methods were applied for the characterisation of the fibre orientation of different paper sheets made with a Dynamic Sheet Former and an M.K. automatic sheet former for different pulp compositions: Pine, Eucalypt, beaten at two level degrees: 19 and 54º SR. The in plane hygro-instability of the sheets were controlled between 20 and 98% Relative Humidity at the laboratory of Paper Physics – EFPG, using the Varidim equipment.
The sheet curl was observed using paper strips cut in the cross direction with a size of 15x100 mm, and fixed in their middle, then exposed to ambient air conditions of either 20 or 98% Relative Humidity, as shown in the figures 1 and 2.
Figure 1. Observations of the curl at 20% of relative humidity.
4th International Symposium on Moisture and Creep Effects on Paper, Board and Containers Page 174
Figure 2. Observations of the curl at 98% of relative humidity.
This report presents:
− The optical methods used for the characterisation of the sheet structure, that is: the fibres orientation, − The results of the measurements of the in plane hygro-instability of the paper sheets and of the curl
observations correlated with the sheet fibres orientation, the fibre composition and the beating degree of the pulps.
2. Methods of characterisation
2.1. Replicas production
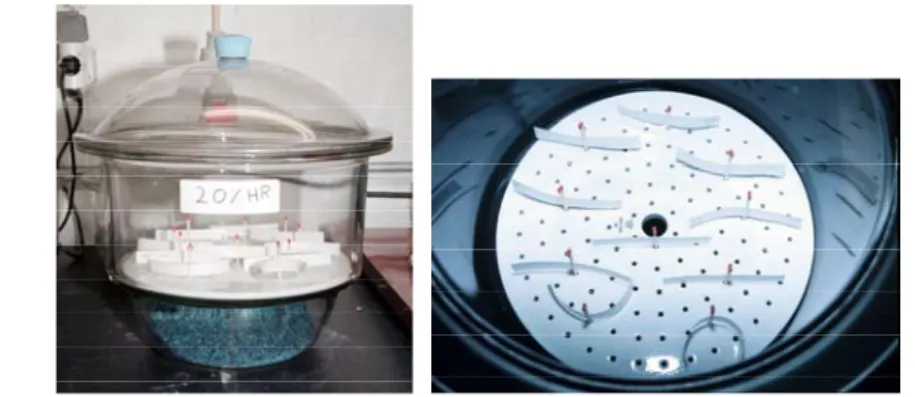
To obtain surface replicas of the paper samples with the highest possible fidelity we used a thermoplastic film which is placed onto the sample. Then the replica of the surface is obtained by pressing the polymeric film at temperature of about 115ºC and a pressure of about 350-400 kPa. The equipment used to achieve this is a press which is shown in figure 3.
Figure 3. Press for replicas production.
It is constituted by two plates, the bottom one is heated whereas the upper is connected to compressed air. At the end of the process the bottom plate is cooled thanks to a system of water circulation. We can produce at the same time and with the same conditions the replica of both surfaces of the paper. We can produce simultaneously, therefore with the same conditions, the replicas of both surfaces of the sample. The quality of the paper replica was first evaluated by microscopic observations and showed pictures, from which it is difficult to distinguish the paper surface from the paper replica, even for a skilful expert. Figure 4 (a)
presents a paper sample made of pine, whereas 4 (b) show the replica of the same paper but in an other location. As shown in these figures the quality of the latter is as good as that of the original paper sample.
Figure 4. The paper sample (a) and his replica (b).
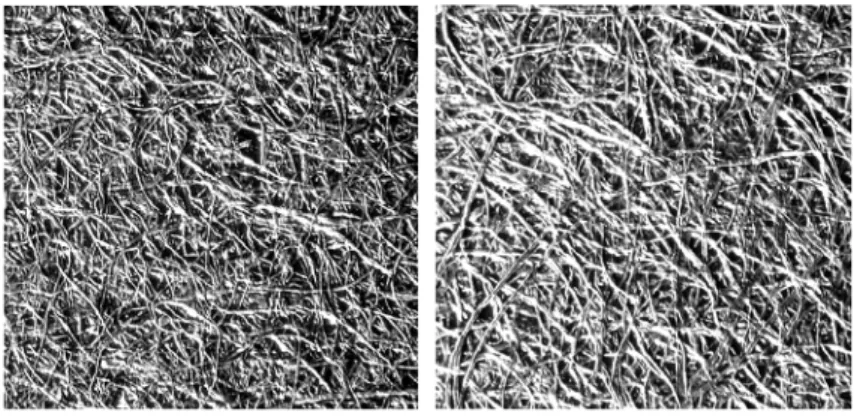
The figure 5 show the aspect of the paper faces replicas in the case of a double layers isotropic M.K. sheet, beaten at 19º SR . The wire side corresponds to Eucalypt fibres, whereas the felt one is made from Pine fibres.
Eucalypt (wire side) Pinus (felt side)
Figure 5. Replicas of isotropic double-layers paper sheet at 19 ºSR..
In the case of the dynamic former sheets, the differences of the sheet structure depend of the pulps furniture and appear clearly: see figure 6 in the case of 100 % Pine and 100 % Eucalypt sheets of pulps beatened at 19ºSR.
100% Pinus 886 100% Eucalyptus 850
4th International Symposium on Moisture and Creep Effects on Paper, Board and Containers Page 176
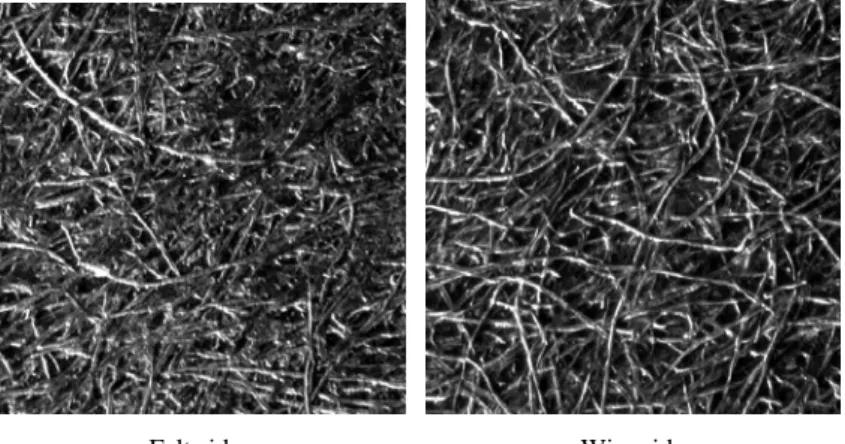
Differences can be observed between the two faces: the felt and the wire sides (see figure 7).
Felt side Wire side
Figure 7. Replicas of anisotropic paper sheet at 19 ºSR.
The effect of the beating is clearly visible on the figure 8, for an isotropic MK pine sheet, with pulp beaten to 19 and to 54 ºSR. In fact, we can observe that the porosity of the surface is lesser in the case of the beaten pulp to 54 ºSR.
19 ºSR 54 ºSR
Figure 8. Replicas of an isotropic paper sheet-pine.
These replicas are quite fitted for the control of the paper faces in term of the distribution of the fibres orientation. Moreover we can use it for the characterisation of the surface porosity by an image analysis process.
2.2. Optical Analysis
2.2.1 Light Diffraction
In the case of optical diffraction we use a optical bench constituted by a He-Ne laser beam, a spatial filter (SP) and a collimating lens (L1) to produce a collimated plane parallel beam of light (see figure 8).
CCD1 CCD2 FD' L3 FD' Q He- Ne SP Laser FD BS L2 L1 OD
Figure 9. Experimental apparatus for the light diffraction analysis.
All the light passing through and deviated by the paper replica (Q) is collected by the large aperture Fourier lens (L2) which creates a diffraction pattern in the focal point, where a solid state sensor (CCD1) is located.
The beam was splitted in two parts using a beam splitter (BS) in order to create in another solid state sensor (CCD2) the image of the paper replica.
Both solid state sensors are connected to a frame grabber which is installed in a computer to record these intensity distributions. An application program was written to control the acquisition and recording processes and it also performs all the necessary processing on the recorded data. In figure 10 we can see a general view of the experimental apparatus.
Figure 10. Photograph of the optical bench.
As an example, the following two diffraction patterns (figure 11) were obtained with the described apparatus, for a unbleached Kraft liner paper on both faces: the top side and the bottom side which was manufactured by a paper machine with two headboxes.
MD CD CD
MD
Top side Bottom
(a) (b)
Figure 11. Diffraction patterns of a Kraf liner paper: (a) Top side and (b) bottom side.
4th International Symposium on Moisture and Creep Effects on Paper, Board and Containers Page 178
It has been shown [3] that the density of straight fibres segments orientation in a fibrous network can be expressed by the radius of curvature of an equivalent contour, evolved by fibres in the texture plane, therefore the name of “Equivalent Pore” for this modellisation. The choice of an elliptical contour, figure centro-symmetric because the π rad periodicity of the fibres orientation functions, correspond to the features structure which is due to the manufacturing processes.
From the “Equivalent Pore” concept, only two parameters are sufficient to represent the fibre distribution: the ellipticity of the elliptical contour and the direction of its principal axis.
To validate our results obtained with the optical diffraction analysis, two fibres distributions were generated to produce their corresponding diffraction patterns (see figure 12).
Effective paper fibres distribution
Fibres reorganized by the equivalent pore modellisation Diffraction pattern Diffraction pattern
Figure 12. Generated fibre distributions.
On the left, in the upper part, we can see an effective fibres distribution in orientation and on the bottom, the same distribution in orientation but, with the fibres reorganised according to the Equivalent Pore modellisation. On the right side of the figure is show the corresponding diffraction patterns for these distributions.
As we can see both the patterns reveals an elliptical shape with the same ellipticity: a/b, rotated by 90º with respect to the main axis of the fibres orientation distribution.
These results are in agreement with the optical diffraction theory. It confirms our interpretation of the diffraction pattern of paper replicas to characterise the fibres orientation at the paper surface. The ellipticity a/b of the optical diffraction pattern characterises the fibre orientation anisotropy of the paper surfaces.
The method comprises the following steps: − Create replicas from the paper surfaces,
− Generate the corresponding laser diffraction patterns,
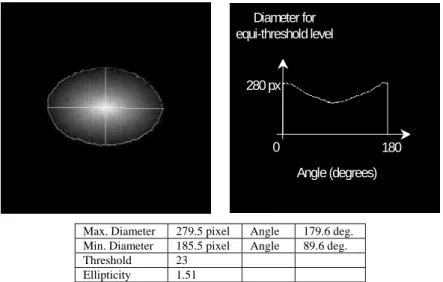
− Compute the average diameters of the different contours, obtained for a set of intensity threshold levels, starting from zero up to one hundred and eighty degrees;
− Find the best contour with a minimal square root error, with respect to the computed average contour, for computing the ellipticity and the orientation angles of the diffraction pattern;
In figure 13 we can see the results obtained with this method, for an unbleached Kraft liner paper replica. The graph shows the changes in diameter through the contour between 0º and 180º. The ellipticity computed has a value of 1.51. Angle (degrees) 180 0 280 px Diameter for equi-threshold level
Max. Diameter 279.5 pixel Angle 179.6 deg. Min. Diameter 185.5 pixel Angle 89.6 deg.
Threshold 23
Ellipticity 1.51
Figure 13. Results of diffraction analysis for a Kraft liner paper top side.
A similar analysis (figure 14) can be done for the other side of the same paper sample, which looks less anisotropic with a value of 1.30.
200 px 180 0 Angle (degrees) Diameter for equi-threshold level
Max. Diameter 202.9 pixel Angle 5.8 deg. Min. Diameter 156.3 pixel Angle 95.4 deg. Threshold 58 Ellipticity 1.30
Figure 14. Results of diffraction analysis for a Kraft liner paper bottom side.
2.2.2 Light Transmission
In this optical process the fibres act as light guides spreading the incident light on the paper sheet surface from fibre to fibre. Then the light is transmitted through the fibre structure by scattering and absorption. We observe the light pattern on the opposite surface of the sheet.
4th International Symposium on Moisture and Creep Effects on Paper, Board and Containers Page 180
The experimental optical bench uses a He-Ne laser and a microscope objective (L1) to focus the laser beam
on the paper surface (see figure 15).
CCD Q He-Ne Laser L2 L1 OD
Figure 15. Experimental apparatus for light transmission analysis.
A second lens (L2) and a solid state detector (CCD) captures the image on the other side of the sample and it
is acquired and stored on a computer in order to perform the analysis with the same treatment as for the diffraction process.
The decreasing of the light intensity in any direction for a path according to the axis of the fibre, is proportional to the mean number of fibres crossing by unit length in these direction.
The “Equivalent Pore” theory states that the inverse of the indicatriz of the intercepts by length unity in a fibrous network is the figure of the “Equivalent Pore” contour. For a determined intensity threshold the location of the light detected give us directly the shape of the “Equivalent Pore” which enable us to characterise the fibres distribution. The figure 16 show an example of the transmission analysis for a paper made in a dynamic sheet former.
MD CD
Felt side MD Wire side
CD
a/b = 1.49
a/b = 1.53
Figure 16. Light transmission patterns of a paper sheet.
In transmission analysis the main axis of the ellipse as the same direction as the one of the paper maximum fibres orientation. Therefore it do not appear rotated by 90º as for diffraction analysis.
To summarise: the light diffraction analysis give us access to the fibres orientation distribution and its anisotropy on the material surfaces and the light transmission analysis reveals the mean fibres orientation of the whole structure.
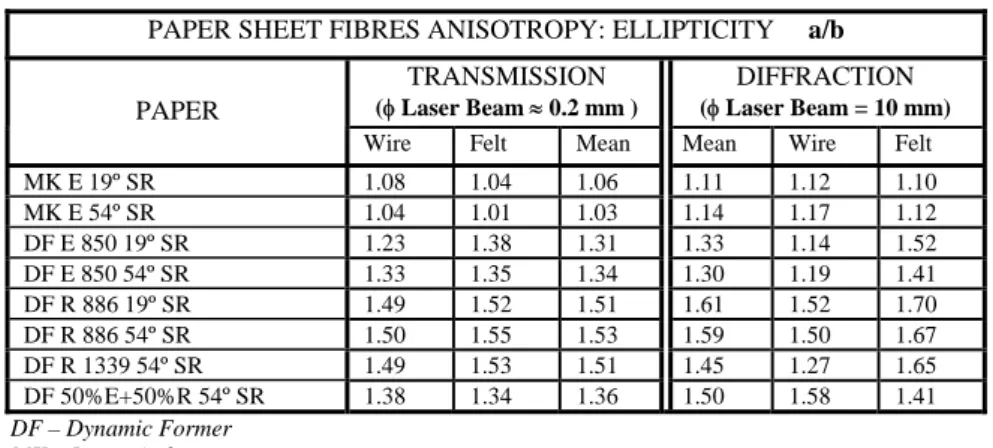
In table 1 we have the results of the fibres orientation analysis in the case of different paper sheets using these two process of analysis.
PAPER SHEET FIBRES ANISOTROPY: ELLIPTICITY a/b PAPER TRANSMISSION (φ Laser Beam ≈ 0.2 mm ) DIFFRACTION (φ Laser Beam = 10 mm)
Wire Felt Mean Mean Wire Felt
MK E 19º SR 1.08 1.04 1.06 1.11 1.12 1.10 MK E 54º SR 1.04 1.01 1.03 1.14 1.17 1.12 DF E 850 19º SR 1.23 1.38 1.31 1.33 1.14 1.52 DF E 850 54º SR 1.33 1.35 1.34 1.30 1.19 1.41 DF R 886 19º SR 1.49 1.52 1.51 1.61 1.52 1.70 DF R 886 54º SR 1.50 1.55 1.53 1.59 1.50 1.67 DF R 1339 54º SR 1.49 1.53 1.51 1.45 1.27 1.65 DF 50%E+50%R 54º SR 1.38 1.34 1.36 1.50 1.58 1.41 DF – Dynamic Former MK – Isotropic former
Table 1. Paper sheet fibres anisotropy:Ellipticity (a/b)
We can observe that the dynamic sheet former gives a fibres orientation, which appear genarally different for both sides of the sheet. The anisotropy expressed in terms of the ellipticity (a/b) of the equivalent pore which characterise the orientation distribution is higher on the felt side than on the wire side.
These observations are easily revealed by the optical diffraction analysis of the replicas of the paper faces and confirmed, even though with a lesser extent by the optical transmission analysis.
The graphs 1 and 2 shows the correlation between the results obtained by optical diffraction and optical transmission analysis for the felt the and wire sides.
The correlation between the two methods for the felt side is quite good (R2=0.973), while the correlation for
the wire side is less clear (R2=0.542). The dispersion is high probably because the effects of sheet formation close to the wire.
ELLIPTICITY y = 1.1101x - 0.0446 R2 = 0.9732 1 1.2 1.4 1.6 1.8 1 1.2 1.4 1.6 (a/b)transmission (a/ b )di ffracti o n Felt side
Graph 1. Correlation between optical diffraction and optical transmission analysis: felt side. . ELLIPTICITY y = 0.766x + 0.2969 R2 = 0.5419 1 1.2 1.4 1.6 1.8 1 1.2 1.4 1.6 (a/b)transmission (a/ b )di ffracti o n Wire side
Graph 2. Correlation between optical diffraction and optical transmission analysis: wire side.
4th International Symposium on Moisture and Creep Effects on Paper, Board and Containers Page 182
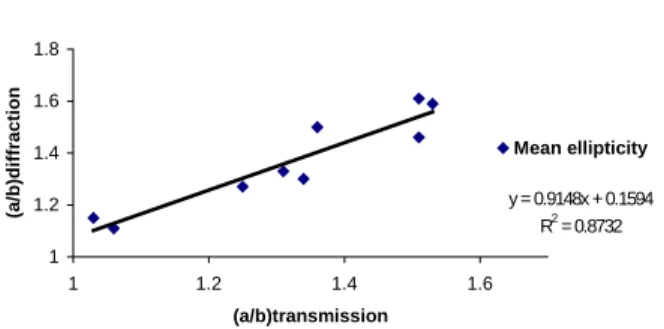
If we consider the mean values of the ellipticities the correlation (graph 3) appears good enough (R2=0.873) even if the laser beam impacts for the two presented methods are quite differents: 0.2 mm for the laser transmission analysis and 10 mm for the laser diffraction analysis.
ELLIPTICITY y = 0.9148x + 0.1594 R2 = 0.8732 1 1.2 1.4 1.6 1.8 1 1.2 1.4 1.6 (a/b)transmission (a/b )d iffr actio n Mean ellipticity
Graph 3. Correlation between the mean values of the ellipticity obtained by optical diffraction and optical transmission analysis.
The mean ellipticity looks a little bit lesser by the transmission analysis: this come from the effect of homogenisation of the fibres substrate which scatters the light after the first impact of the light on the surface. In the case of the diffraction analysis we measure only two fibre distributions in extreme positions at the paper surfaces without further attenuation by the scattering.
3. Applications for the control of paper hygro-instability
Before starting the measurement of hygro-instability, the paper sheets prepared were carefully characterised in term of their parameters: basis weight, thickness, tensile strength and fibre orientation. The following tables summarise the main characteristics of the sheets.
3.1. Isotropic and anisotropic one layer sheets
The speed of the wire on the dynamic sheet former was keep constant =
The figures between brackets indicates de speed of the pulp in the case of the dynamic sheet former.
Basis Weight Thickness Bulk Tensile Ratio Ellipticity a/b ( g/m2 ) µm ( cm3/g ) ( MD/CD ) diffraction analysis MK sheet former 60.7 124 2.04 1.07 1.11 DF Anisotropic 850 53.8 142 2.64 2.09 1.33 DF Anisotropic 887 60.9 157 2.58 2.49 1.44 DF Anisotropic 850W+887F 74.5 177 2.38 2.08 1.33 Eucalypt 19ºSR
Basis Weight Thickness Bulk Tensile Ratio Ellipticity a/b ( g/m2 ) µm ( cm3/g ) ( MD/CD ) diffraction analysis MK sheet former 88.2 130 1.47 1.14 1.15 DF Anisotropic 850 52.0 102 1.96 2.22 1.30 DF Anisotropic 887 49.9 93 1.87 2.29 1.32
Eucalypt 54ºSR
Table 3. Isotropic and anisotropic paper sheets of bleached Eucalipt Kraft pulp-54 ºSR.
Basis Weight Thickness Bulk Tensile Ratio Ellipticity a/b ( g/m2 ) µm ( cm3/g ) ( MD/CD ) Diffraction analysis
MK sheet former 62.7 108 1.72 1.10 1.09
DF Anisotropic 671 55.5 117 2.11 2.59 1.50
DF Anisotropic 886 48.8 103 2.11 3.57 1.61
Pine 19ºSR
Table 4. Isoptropic and anisotropic paper sheets of bleached Pine Kraft pulp-19 ºSR.
Basis Weight Thickness Bulk Tensile Ratio Ellipticity a/b ( g/m2 ) µm ( cm3/g ) ( MD/CD ) Diffraction analysis MK sheet former 70.0 107 1.53 1.01 1.13 DF Anisotropic 671 71.7 121 1.69 2.10 1.37 DF Anisotropic 886 54.5 92 1.69 3.25 1.59 DF Anisotropic 1339 55.0 92 1.67 2.80 1.46 Pine 54ºSR
Table 5. Isoptropic and anisotropic paper sheets of bleached Pine Kraft pulp-54 ºSR.
3.2. Isotropic and anisotropic double-layers paper sheets
Basis Weight Thickness Bulk Tensile Ratio Ellipticity a/b ( g/m2 ) µm ( cm3/g ) ( MD/CD ) Diffraction analysis
MK sheet former 60.5 113 1.87 1.14 1.17
50% E + 50% P 19ºSR
Table 6. Isoptropic and anisotropic double-layers paper sheets 19 ºSR.
Basis Weight Thickness Bulk Tensile Ratio Ellipticity a/b ( g/m2 ) µm ( cm3/g ) ( MD/CD ) Diffraction analysis
MK sheet former 75.2 115 1.53 1.21 1.11
DF Anisotropic 886 P + 850 E 63.9 102 1.60 2.63 1.50
50% E + 50% P 54ºSR
Table 7. Isoptropic and anisotropic double-layers paper sheets 54 ºSR.
4th International Symposium on Moisture and Creep Effects on Paper, Board and Containers Page 184
Tensile ratio as well as hygro-instability measured in the cross and in the machine directions was plotted against the values of the mean ellipticity of the fibres orientation distribution. We choose the measurements of the ellipticities obtained by the optical diffraction analysis because we verified that the a/b mean value was the most appropriate parameter for this purpose.
P886 P671 E887 E850 P+E P E P886 P1339 P886+E850 E887 E850 P671 P+E E P y = 4.4801x - 3.8664 R2 = 0.9426 y = 4,6008x - 4,0725 R2 = 0,9684 0.00 0.50 1.00 1.50 2.00 2.50 3.00 3.50 4.00 1.00 1.10 1.20 1.30 1.40 1.50 1.60 1.70 (a/b) mean Tensile Ratio (MD/CD) 19ºSR 54ºSR
Graph 4. Tensile ratio in function of the mean ellipticity of the paper faces.
From the correlation analysis we can conclude that, the tensile anisotropy ratio MD/CD for these laboratory sheets is practically linearly dependent of the ellipticity a/b. Both correlation’s for: 19º and 54º SR give quite the same relation indistinctly for Pine and Eucalypt pulps. The extrapolated values of the tensile ratio MD/CD for isotropic sheet a/b equal to 1 are 0,53 for the pulps beaten at 19ºSR and are 0,61 for the pulps beaten at 54ºSR. These values are lower than unity, which indicates a high fibres restraint for the fibres in the cross direction during the drying of these laboratory sheets. We must take care however, that this parameter of the correlation can be different depending on the drying conditions of paper sheet.
19ºSR E P P+E P886 P671 E887 E850 P886 E850 P671 E887 y = 0,226x - 0,0186 R2 = 0,7993 y = -0,1024x + 0,3181 R2 = 0,9058 0.00 0.05 0.10 0.15 0.20 0.25 0.30 0.35 0.40 1.00 1.10 1.20 1.30 1.40 1.50 1.60 1.70 (a/b) mean ∆ l/l (% ) CD a nd M D CD MD
54ºSR P671 P1339 P886 P886+E850 E887 E850 E P+E P P671 P1339 P886+E850 E887 E850 P886 y = 0,2279x2 - 0,8374x + 0,8961 R2 = 0,9289 y = 0,3745x - 0,0909 R2 = 0,6609 0.00 0.10 0.20 0.30 0.40 0.50 0.60 1.00 1.10 1.20 1.30 1.40 1.50 1.60 1.70 1.80 (a/b) mean ∆ l/l ( % ) ( C D an d MD ) CD MD
Graph 5. Cross and machine directions hygro-instability in function of the mean ellipticity of the paper faces.
The analysis of the in plane hygro-instability measured in the cross and in the machine direction of the sheets shows a clear dependence on the mean fibre distribution anisotropy. The nature of the fibres composition: Pine or Eucalypt does not look very discriminating in comparison with the beaten degree of the pulp. The extrapolated values for the hygro-instability of the isotropic sheet are equal to +0,21 and +0,28, respectively for the pulps beaten to 19º and 54ºSR . These values are coherent for paper sheets dried with a fully restrainted and at different levels of beating. By more, the negative values of the hygro-instability hysteresis in the cross direction to moor or less 0,03 for the 19ºSR and to moor or less 0,16 for 54ºSR degree, confirm the fact of a full restraint of the paper sheets during their drying.
Wire Felt mean ∆l/l CD (%) 20 - 85 RH Hysteresis CD (%) 20 - 85 - 20 ∆l/l MD (%) 20 - 85 RH Hysteresis MD (%) 20 - 85 - 20 ∆l/l (CD/MD) MK sheet former 1.12 1.10 1.11 0.27 -0.05 _____ _____ _____ DF Anisotropic 850 1.14 1.52 1.33 0.27 -0.02 0.18 -0.02 1.50 DF Anisotropic 887 1.34 1.53 1.44 0.28 -0.02 0.17 -0.03 1.65 DF Anisotropic 850W+887F 1.22 1.44 1.33 0.27 -0.04 0.27 -0.04 1.00
Ellipticity a/b (diffraction) Hygro-instability ( Varidim )
Eucalypt 19ºSR
Table 8.Ellipticity versus higro-instability in isotropic and anisotropic paper sheets-Eucalipty 19ºSR.
Wire Felt mean
∆l/l CD (%) 20 - 85 RH Hysteresis CD (%) 20 - 85 - 20 ∆l/l MD (%) 20 - 85 RH Hysteresis MD (%) 20 - 85 - 20 ∆l/l (CD/MD) MK sheet former 1.17 1.12 1.15 0.38 -0.08 ____ ____ ____ DF Anisotropic 850 1.19 1.41 1.30 0.33 -0.17 0.19 -0.06 1.74 DF Anisotropic 887 1.14 1.50 1.32 0.35 -0.15 0.19 -0.06 1.84
Ellipticity a/b (diffraction) Hygro-instability ( Varidim )
Eucalypt 54ºSR
Table 9.Ellipticity versus higro-instability in isotropic and anisotropic paper sheets-Eucalipty 54ºSR.
Wire Felt mean
∆l/l CD (%) 20 - 85 RH Hysteresis CD (%) 20 - 85 - 20 ∆l/l MD (%) 20 - 85 RH Hysteresis MD (%) 20 - 85 - 20 ∆l/l (CD / MD) MK sheet former 1.09 1.08 1.09 0.22 -0.06 ____ ____ ____ DF Anisotropic 671 1.45 1.55 1.5 0.32 -0.10 0.17 -0.04 1.88 DF Anisotropic 886 1.52 1.7 1.61 0.37 -0.12 0.15 -0.04 2.47 Hygro-instability ( Varidim ) Ellipticity a/b (diffraction)
Pine 19ºSR
Table 10.Ellipticity versus higro-instability in isotropic and anisotropic paper sheets-Pine 19ºSR.
Wire Felt mean
Dl/l CD (%) 20 - 85 RH Hysteresis CD (%) 20 - 85 - 20 ∆l/l MD (%) 20 - 85 RH Hysteresis MD (%) 20 - 85 - 20 ∆l/l (CD/MD) MK sheet former 1.10 1.16 1.13 0.34 -0.07 ____ ____ ____ DF Anisotropic 671 1.12 1.62 1.37 0.45 0.01 0.18 -0.05 2.50 DF Anisotropic 886 1.50 1.67 1.59 0.53 -0.14 0.14 -0.03 3.79 DF Anisotropic 1339 1.27 1.65 1.46 0.52 -0.14 0.15 -0.03 3.47 Pine 54ºSR Hygro-instability ( Varidim ) Ellipticity a/b (diffraction)
Table 11.Ellipticity versus higro-instability in isotropic and anisotropic paper sheets-Pine 54ºSR.
and the next two tables show the same trend for the other paper’ sheets.
Wire Felt mean
∆l/l CD (%) 20 - 85 RH Hysteresis CD (%) 20 - 85 - 20 ∆l/l MD (%) 20 - 85 RH Hysteresis MD (%) 20 - 85 - 20 ∆l/l (CD/MD) MK sheet former 1.17 1.16 1.17 0.23 -0.05 ____ ___ ____ 50% E + 50% P 19ºSR
Ellipticity a/b (diffraction) Hygro-instability ( Varidim )
Table 12.Ellipticity versus higro-instability in isotropic double-layers paper sheets.
Wire Felt mean
∆l/l CD (%) 20-85 RH Hysteresis CD (%) 20-85-20 ∆l/l MD (%) 20-85 RH Hysteresis MD (%) 20-85-20 ∆l/l (CD/MD) MK sheet former 1.14 1.08 1.11 0.33 -0.09 ____ ____ ____ DF Anisotropic 886 P+850 E 1.58 1.41 1.50 0.42 -0.17 0.16 -0.05 2.63 50% E + 50% P 54ºSR
Ellipticity a/b (diffraction) Hygro-instability ( Varidim )
4th International Symposium on Moisture and Creep Effects on Paper, Board and Containers Page 186
The plots graph 6 show the importance of the hydration of the fibres wall thickness during the beating in respect of the hygro-instability of the paper sheet. A careful analysis of the fenomena must be performed for the hygro-instability variations in the machine direction at the high level of sheet fibres orientation due to the overlapping of the curves.
P671 P886 E887 E850 P886 P1339 P886+E850 P671 E887 E850 y = 0.2279x2 - 0.8374x + 0.8961 R2 = 0.9289 y = -0.1024x + 0.3181 R2 = 0.9058 0.12 0.14 0.16 0.18 0.20 0.22 0.24 0.26 0.28 1.00 1.10 1.20 1.30 1.40 1.50 1.60 1.70 (a/b) mean ∆ l/l MD (%) 19ºSR 54ºSR
E P P+E E850 E887 P671 P886 P+E P886+E850 E887 E850 P671 P886 P P1339 E y = 0,3745x - 0,0909 R2 = 0,6609 y = 0.226x - 0.0186 R2 = 0.7993 0.00 0.10 0.20 0.30 0.40 0.50 0.60 1.00 1.10 1.20 1.30 1.40 1.50 1.60 1.70 (a/b) mean ∆ l/l CD (%) 19ºSR 54ºSR
Graph 5. Cross and machine directions hygro-instability in function of the mean ellipticity of the paper faces.
T
he uptake of water by the paper sheet from the ambient air corresponds to a volumic variation of the fibreswall which is amplified by the level of delamination of the fibres resulting from the beating process.
The tables 14 and 15 shown the intensity of the curl refereeing to the concave face of the paper observed as it has been described in figure 1 and 2.
a/b W 1,0 F 1,0 W 1,17 F 1,12 W 1,10 F 1,16 Weuc. 1,17 Fpine 1,16 Weuc. 1,14 Fpine 1,08 98 % RH 0 + 0 + 0 + + 0 0 0 20 % RH + 0 + 0 + 0 0 + ++ 0
One Layer Sheets Two Layer Sheets
MK 50%Pine+50%Eucalipt19ºSR
Standard Pine 19ºSR MK Euclypt 54ºSR MK Pine 54ºSR MK 50%Pine+50%Eucalipt19ºSR
W= Wire side, F=Felt side, MK=Automatic sheet former, DF=Dynamic sheet former + shows the intensity of the curl refeering to the concave face of the paper
Table 14. Observations of the curl for paper strips in differents relative humidities of air.
a/b 1,19W 1,41F 1,12W 1,62F 1,50W 1,67F W1,27Eucalipt F1,65Pine W1,58Eucalipt F1,41Pine
98 % RH 0 0 0 0 0 0 0 0 0 +++
20 % RH 0 + 0 +++ 0 + 0 ++++ +++ 0
One Layer Sheets Two Layer Sheets
50%Pine(886)+50%Eucalipt (850) 54ºSR DF Pine 1339 54ºSR
DF Eucalipt 850 54ºSR DF Pine 671 54ºSR DF Pine 886 54ºSR
+ shows the intensity of the curl refeering to the concave face of the paper
Table 15. Observations of the curl for paper strips in differents relative humidities of air.
The behaviour of the curl of the paper sheet reveals that, the sheet has its concavity in dry air conditions toward the face, which is the more anisotropic in terms of fibres orientation. The more is the difference of fibres orientation between the sheet faces, the more is the development of the curl. When the humidity of the air increases the tendency is reversed and curl can appears on the opposite side of the paper.
4th International Symposium on Moisture and Creep Effects on Paper, Board and Containers Page 188
Conclusions
Replicas of the paper faces analysed by light diffraction give a quite easy process to characterise the fibres orientation distribution on the sheet surfaces and therefore to characterise the paper hygro-instability trend.
The in plane hygro-instabilities of paper in the machine and the cross directions are well correlated with the fibres orientation distribution of the sheet as it is measured by the mean ellipticity, a/b, of the equivalent pore of the paper sheets faces.
Similar observations were done by Makio Hasuike [5] who had controlled the fibres orientation through the thickness of the sheets on high speed gap former with the changing of the jet/wire ratio.
If the ellipticities are different between the paper faces the curl in dry conditions occurs with the sheet concavity directed toward the paper face with the highest value of the ellipticity characterising the fibres orientation
.
The degree of beating of the pulp seems to have a very significant influence on the hygro-instability of paper higher than has the nature of the pulps fibres.
In the conditions of our experiments we have found that:
The tensile ratio MD/CD of the paper presents a one to one correlation with the ellipticity of the sheet fibres orientation independently of the kind of pulp and the level of beating. This shows the importance of this structural parameter, i.e., the ellipticity of the fibres orientation on the direction paper sheet properties.
References
[1] C. Schaffnit, J. Silvy, C.J. Dodson, “Orientation density of fibres in paper”, Nordic Paper & Paper Research Journal, 7,nº3, 1992, pp.121.
[2] M. J. Pereira, A. P.Costa, N. Belgacem, P. T. Fiadeiro, J. Silvy, “Surface characterization of paper by optical diffraction and interferometry” Paper Physics Seminar, TAPPI, CPPA Vancouver – Canada, 1998. [3] J. Silvy, “Etude Structurale des Milieux Fibreux”, These de Doctorat d’ Etat Institut National Polytechnique et Université Scientifique et Medicale, Grenoble, 1980.
[4] P.T. Fiadeiro, “Wave-front reconstruction of optical disturbances using digital image processing” Ph.D Thesis Loughborough University of Technology, Department of Physics, 1995.
[5] Makio Hasuike, “Sheet structure and properties of paper”, Japan Tappi 46.1 – 1992, pp. 47-55.
Acknowledgements
Authors acknowledges support by the Fundação para a Ciência e Tecnologia, Programa PRAXIS XXI nº 3/3.2/2316/95 for this research.