INTRODUCTION
Coastal lagoons are highly productive environments
and, due to the high availability of natural resources,
preferential areas for human exploitation (Castel et al.
1996). Anthropogenic pressure in the vicinity of coastal
lagoons has been pointed out as a strong contributor to
the decrease of water quality and the consequent
degrada-tion of these habitats (Newton et al. 2003). Worldwide,
discharges of Wastewater Treatment Plants (WWTPs)
into these systems constitute one of the main pollution
sources (Gray 2004), whose effects can be particularly
severe in Regions of Restricted Water Exchange (RRE),
where discharges can drastically change the water
qual-ity (Tett 2003). As a consequence, receiving communities
are threatened by the typical organic enrichment (Pearson
& Rosenberg 1978, Austen et al. 1989) and variations
of water salinity (Tett 2003, Gray 2004). In fact, several
authors have found changes in diversity and trophic
struc-ture when studying the effect of organic matter content
(Weston 1990, Austen & Widdicombe, 2006, Klaoudatos
2006) and salinity (Teske & Wooldridge 2001, Gamito
2006, Zettler et al. 2007) variations on soft-bottom
com-munities’ structure and functioning.
Macrobenthic communities have an important role on
the structure and functioning of ecosystems (Gray 1974,
Pearson & Rosenberg 1978). They are, however, in direct
contact with the sediment, where multiple contaminants
tend to accumulate (Gray 1974). In fact, due to their
lim-ited mobility, benthic organisms are sensitive to local
dis-turbance and because of their permanence over seasons,
they integrate the recent history of disturbances that might
not be detected in the water column (Warwick 1993). As
well as salinity and organic matter content, environmental
variables affecting macro-benthic communities in
transi-tional waters include inorganic contaminants
concentra-tion, water residence time, temperature and freshwater
discharges (Gray 1974, Snelgrove & Butman 1994). The
response of each community to these stressors depends on
its resilience and specific environmental conditions of the
ecosystem (Jorgensen & Richardson 1996). The presence/
absence of these organisms can provide information about
temporal and spatial disturbances, since they integrate
the conditions of the water-sediment interface (Reiss &
Kröncke 2005). Hence benthic assemblages are broadly
recognised as proper tools to describe the ecological
con-ditions of marine and brackish systems.
Macrobenthic invertebrate fauna integrates
biologi-cal quality elements for the definitions of ecologibiologi-cal
sta-tus proposed by the Water Framework Directive (WFD
2000/60/CE) (Teixeira et al. 2007). This directive
estab-lished that all surface waters should have a “Good”
eco-logical quality status (EcoQS) until 2015 by
implement-ing the necessary integrated programs of measures
(Mos-tert 2003). Nevertheless, despite the evaluation of
pol-lution sources and their effects on benthic communities
MACROBENTHIC RESPONSE TO SEWAGE DISCHARGES IN
CONFINED AREAS FROM COASTAL LAGOONS: IMPLICATION ON
THE ECOLOGICAL QUALITY STATUS
d. PilÓ
¹*, f. leitÃo
¹, r. Ben-Hamadou
¹, P. ranGe
¹,
m. CHÍCHaro
¹, l. CHÍCHaro
¹
¹ Centre of marine Sciences (CCmar), universidade do algarve, Campus de Gambelas, 8000-810 faro, Portugal * Corresponding author: [email protected] ABSTRACT. – We studied the effect of wastewater on macrobenthic assemblages and local Ecological Quality Status (EcoQS) along a pollution gradient. The study consisted of six sam-pling sites surrounding the discharge channel of a Wastewater Treatment Plant located within Ria Formosa coastal lagoon. The total number of individuals was significantly higher at the dis-charge point comparatively to the control site, while total number of species, species richness and diversity values revealed the opposite pattern. Deposit-feeding were the most abundant trophic group, particularly at the inner sites, while the highest contributions of suspension-feed-ing and carnivory groups were observed at external ones. The organic matter content was posi-tively correlated with the deposit-feeding group conferring a structural character of this variable near the plant discharge. M-AMBI index was consistent with the ANOSIM and SIMPER analy-sis, successfully separating the sampling stations according to the distance from the discharge and distinguishing the lower EcoQS of the inner sites not complying with the requirements of the Water Framework Directive of a “Good” quality status. In addition, changes in ecological and biotic indices were negatively correlated with variations of organic matter and positively correlated with salinity, corroborating the effect of these variables on the composition and struc-ture of macrobenthic communities.
MACROBENTHIC COMMUNITY ORGANIC ENRICHMENT WASTEWATER ECOLOGICAL QUALITY STATUS TROPHIC GROUPS M-AMBI
being well known, it has been difficult to reach a
general-ized and uniform qualification of the EcoQS (Teixeira et
al. 2007, Prato 2009). As a result, different biotic indices
were designed to establish the ecological quality of
coast-al and transitioncoast-al waters, ancoast-alysing the response of
soft-bottom communities to natural and man-induced changes
in water and sediment quality (Borja et al. 2000).
The estimation of biotic indices allows the assessment
of the Ecosystem Quality status (EcoQS) in coastal
sys-tems. In this respect, the Shannon-Wiener index
(Shan-non & Weaver 1949), and the AMBI (Azti Marine Biotic
Index, Borja et al. 2000) are amongst the indices generally
used for EcoQS classification. The AMBI index provides
information about the relative abundances of the sensitive
species faced with increasing organic matter in the
sedi-ment and those of the species that are resistant or
indif-ferent or even favored by such conditions (Dauvin 2007).
This index is particularly useful in detecting time and
spatial impact gradients but can sometimes be misleading
because of the abundance of stress tolerant species that
can be tolerant against natural stressors and lead to a
natu-ral increase in opportunistic species and, subsequently, to
an increase in the AMBI values (Dauvin 2007). In order to
minimize these problems some authors have tried to use a
multi-index approach in order to avoid misclassifications
of the EcoQS.
M-AMBI (Muxika et al. 2007) is a derived
statisti-cal tool which combines AMBI, diversity and richness
for the EcoQS assessment of previous classification of
water bodies and typologies, together with the definition
of reference conditions allowing the distinction between
impacted and undisturbed/reference sites. M-AMBI
pro-vides a classification of the system that matches
adequate-ly the one established by the WFD (Salas et al. 2004) and
it has been applied at different geographic areas such as
Europe (Ruellet & Dauvin 2007, Prato et al. 2008), Africa
(Bigot et al. 2008, Bakalem et al. 2009) and North
Ameri-ca (Borja et al. 2007, Borja & Tunberg 2010).
The Ria Formosa lagoon is a highly productive
eco-system and represents a relevant site for several economic
activities such as fisheries, aquaculture and sand
extrac-tion (Mudge & Bebianno 1997, Newton et al. 2003).
These activities, together with the tourist impact,
inten-sive agriculture and sewage discharges at lagoon
vicini-ties have increased pressures on the ecosystem,
contribut-ing to the degradation of water quality (Bebianno 1995,
Mudge & Bebianno 1997, Newton & Mudge 2005). The
confined characteristic of many channels in this lagoon
makes these areas particularly sensitive to organic
enrich-ment since water circulation is limited and the residence
time of the pollutants is high (Mudge & Duce 2005); it
is then urgent to evaluate the local water quality and the
effects of the discharges on benthic communities.
The aim of this study was to assess the effect of a
WWTP discharge into a confined channel of the Ria
For-mosa coastal lagoon evaluating the macrobenthic
com-munity structure an local EcoQS.
METHODS
Study area: Ria Formosa is a mesotidal lagoon and one of the most important wetland at both European and International levels namely by its acceptance as a Natura 2000 and a Ram-sar site (Newton et al. 2003). This lagoon is an extremely rich zone in ecological terms and a dynamic and complex system,
Fig. 1. – Geographic location of the Ria Formosa coastal lagoon showing the location of WWTP and sampling sites.
with high primary production and important live resources (Mudge & Bebianno 1997, Newton et al. 2003, Loureiro et al. 2005). The lagoon is located on the southern coast of Portugal (Algarve), extending for about 55 km and occupying a surface area of approximately 16 300 ha (Fig. 1).
There is no significant natural freshwater input in to the system and the salinity remains around 36 throughout the year, except during sporadic short run-off periods (Falcão & Vale 1990, Newton & Mudge 2003). The tidal amplitude varies from a maximum of 3.5 m at spring tide to 0.5 m at neap tide, which causes important semidiurnal and fortnightly fluctuations of the water volume inside the system (Falcão & Vale 1990). The lagoon presents a high water renewal rate with an average daily renewal of 2/3 of its volume (Águas 1986). However, in con-fined zones with reduced water circulation and renewal, sedi-mentation processes occur, due to a high residence time of the compounds in the system (Mudge & Duce 2005).
There are several WWTPs within the Ria Formosa lagoon national park, five of which serve populations above 10000 people. Faro North-western WWTP is placed in Faro near the international airport (37º01’04,08” N; 7º57’26,89” W), serving an area of 12000 inhabitants with a sewage flow of 0.12 m3s-1
of domestic sewage, treated with primary and secondary treat-ment levels (Source: Águas do Algarve-ALGAR) (Fig. 1). The wastewaters are discharged directly into a confined secondary/ inner open channel, draining directly to the lagoon. The area surrounding the discharge channel is characterised by muddy sediments covered by salt marsh vegetation, namely Zostera noltii Hornem.
Sampling strategy: Six sampling stations were selected in order to develop a pollution gradient, covering an area from the discharge point of the Faro North-western WWTP to the near-est main/primary channel of the lagoon. Sampling sites were named S1 to S6 where S1 was located upstream the discharge point (inner station) and S2 coincided with the discharge point. S3 was located 200 m downstream, but still at the inner channel and S4 was an intermediate point located at the intersection of the sewage channel with a secondary channel perpendicular to it. S5 was also located on this latter channel, at a more external zone and S6 was located on the main channel of the lagoon. Due to its location on the main open channel and its proximity to the Faro inlet, where the water renewal rate is higher, S6 is the point least affected by organic enrichment. Therefore, for the purposes of the present study, it can be regarded as a control site (Fig. 1)
Sampling was carried out every trimester during 2006 always at low tide, when the WWTP influence was more evident. In each site, three replicates of sediment samples were collected using a hand-corer (15 x15 cm; 0.0177 m²). Each replicate was compound by 3 corers being subsequently placed into a meshed bag (500 µm) and sieved in situ. The retained material was pre-served in ethanol previously coloured with Rose Bengal. Addi-tionally, at each site, three smaller sediment corers (5 x 10 cm; 0.0019 m²) were collected for quantification of organic matter in the sediment. Additionally, at each sampling site the
tem-perature and water salinity values were measured using an YSI Multi-parameter probe.
In the laboratory, macrobenthic organisms were counted and identified under a binocular stereomicroscope (x6 magnifica-tion). Polychaetes and crustaceans were identified to the family level while gastropods and bivalves were identified to the spe-cies level. The sediment organic matter content was determined by the ash-free dry weight of the sediment samples after 6 h at 450º C.
data analysis: the total number of species (S), total abun-dance (N), density (ind/m²) as well as the Margalef’s species richness (d) (Margalef 1968); Shannon-Weaver diversity (H’) (Shannon & Weaver 1949) and Pielou equitability (J) (Pielou 1968) indices were computed at each sampling site in every sampling periods. Differences in ecological explanatory vari-ables among stations were analyzed by a parametric one-way ANOVA (Zar 1996). The Student-Newman-Keuls (S-N-K) pair wise tests were used to identify the differences among the sampling sites and periods. A significance level of α = 0.05 was used in all tests.
Multivariate data analysis was performed using the statisti-cal package PRIMER v5.2.4 (Clarke & Warwick 1994). A data matrix with the abundance values of the different taxa found in this study was performed. A two-way crossed ANOSIM was carried out to determine if there were significant differences between sample similarities from different sampling sites and periods. Community similarity among sampling sites and peri-ods was analysed by multidimensional ordination techniques (non-metric MDS). Matrix data was based on the Bray-Curtis dissimilarity coefficient after square-root transformation. Spe-cies contributions to dissimilarities among sites and sampling periods were investigated using the similarity percentages rou-tine (SIMPER).
For macrobenthic trophic structure analysis, the functional trophic group was determined according to other local studies (Fauvel 1977, Fachauld & Jummars 1984, Sprung 1994, Fish & Fish 1996, Chícharo et al. 2002) and performed by assign-ing each taxon to at least one of the followassign-ing trophic groups: suspension-feeding, deposit-feeding, carnivory and herbivory. The assignment of taxa to a group was performed, according to Boaventura et al. (1999), by distributing the number of indi-viduals of that taxa in the number of functional groups in which it could be included. Total number of individuals in each trophic category was converted in to percentage values. A Cluster anal-ysis was used to demonstrate the spatial differences according to the trophic group indicator. Pearson correlation test (α = 0.05) was used to achieve the relation among the different trophic groups and the sediment organic matter content.
An approach to the EcoQS assessment of the different sam-pling sites and periods in the Ria Formosa lagoon was per-formed by applying the AMBI (Borja et al. 2000) index and its multivariate extension M-AMBI (Borja et al. 2007, Muxika et al. 2007). AMBI is exclusively based on species sensitivities where taxa are assigned to five ecological groups based on their sensitivity to organic enrichment (EGI: species very sensitive;
EGII: species indifferent; EGIII: species tolerant; EGIV: sec-ond-order opportunistic species; EGV: first-order opportunistic species) as defined by Grall & Glémarec (1997). The M-AMBI method relies upon a statistical multivariate tool, Factor Analy-sis (FA), which includes richness (S), Shannon’s diversity (H´) and AMBI. The M-AMBI application requires the definition of reference conditions related to the typology under study (Muxika et al. 2007, Borja et al. 2008). For the determination of AMBI and M-AMBI, the AZTI’s software package version 4.1, with the species list version of February 2010 (available at AZTI’s web page http://www.azti.es) was used, following the guidelines from the authors (Borja & Muxika 2005). These indi-ces were calculated by the software according to a data matrix with the different taxa abundances at each study site and sam-pling period. In our analysis, and due to the lack of studies on macrobenthos from the Ria Formosa, no reference conditions were yet defined. Thus, for M-AMBI calculations, the reference conditions defined by the software were used.
The effects of both salinity and organic matter on habitat ecological status were assessed with correlations (Pearson test, α = 0.05) with environmental variables measured and respective values for ecological indices.
RESULTS
Environmental Variables
Water temperature displayed seasonal variation
throughout the sampling periods with highest values in
June and October (Table I). There was no visible
spa-tial pattern of temperature values among sites. Salinity
showed strong variations among sites with lower values
at S1, S2 and S3 and higher values at S4, S5 and S6; this
tendency was uniform during all sampling periods. The
organic matter content in the sediment was higher at S1
and S2 and the lower values were found at S6,
particu-larly t in January and April (Table I).
Macrobenthic community structure
A total of 47 taxa were identified during the study,
distributed in four main taxonomic groups (polychaetes,
bivalves, gastropods and crustaceans). Polychaetes
com-prised the highest number of taxa (15) as well as the
high-est overall abundance (57.9 %) followed by bivalves (11
taxa and 29.7 %), gastropods (13 taxa and 8.7 %) and
crustaceans (8 taxa, 3.6 %) (Table II). The S1 and S2
sites were strongly dominated by polychaetes (78.0 %
and 84.0 % respectively) while the highest abundance of
bivalves was found at S3 (89 %). The highest proportions
of gastropods were found at S4, S5 and S6, (20.8 %, 9.7 %
and 35.4 % respectively). The crustaceans were limited to
three sites, S1, S5 and S6, with a particularly large
abun-dance at S6 (24 %). Only two taxa (Capitellidae and
Scro-bicularia plana) had a generalized distribution in all
sam-pling sites, contributing, along with the Nereididae, for
57.1 % of the overall abundance (Table II).
The total number of taxa (S) per station varied between
1 and 22 with a mean value of 8.3. S1, S2, and S3 showed
a lower mean number of taxa compared to S4, S5 and S6
(Fig. 2). Diversity (H´) varied between 0.0 and 3.9 with
a mean value of 2.0 (Fig. 2). Diversity was significantly
lower at S1 and S2 comparing to S4, S5 and S6 at April,
June and October samplings (Table III).
The highest abundance was found in the January
sam-pling with 35.6 % of the total abundance, and the lower
abundance was found in October. The maximum density
was found at S2 (5348 ind/m²) in June and the minimum
at S6 in October with 169 ind/m² (Fig. 2). The one-way
ANOVA found significant differences between S2 and S6
in June and October with higher values for the first (Table
III).
Evenness (J’) ranged between 0.55 and 1.00 with a
mean value of 0.75 being statistically lower at S2 in April,
June and October comparing to S5 and S6 at the same
months. The Margalef index (d) ranged between 0.24 and
3.38 (Fig. 2). This index was significant lower at S1 and
S2 comparing with S4, S5 and S6 in April, June and
Octo-ber (Table III).
Table I. – Values of water temperature (ºC) and salinity plus sed-iment organic matter content (g) measured at all sampling sites and periods. Site TºC S OM January S1 20.1 4.7 4.7 S2 17.8 3.6 5.8 S3 14.3 4.0 6.0 S4 15.7 26.1 1.8 S5 21.5 36.5 1.8 S6 19.9 36.7 3.5 April S1 22.2 3.2 6.4 S2 23.0 4.4 4.0 S3 23.0 3.3 1.3 S4 16.1 32.6 2.1 S5 21.6 36.9 2.3 S6 20.8 36.8 1.6 June S1 23.7 8.7 2.2 S2 23.0 4.4 2.4 S3 18.7 9.1 2.0 S4 24.1 32.8 2.1 S5 21.9 36.9 2.4 S6 20.9 36.9 1.8 October S1 25.8 7.2 3.1 S2 22.9 6.9 2.9 S3 24.4 10.9 2.4 S4 26.2 23.5 1.6 S5 21.1 36.7 2.4 S6 20.6 36.8 0.9
The 2-way ANOSIM indicated significant
differenc-es among sitdifferenc-es (“Site” factor; R = 0.862 p = 0.001) and
among sampling periods (“Month” factor; R = 0.780;
p = 0.001). The MDS analysis plot has distinguished the
sites placed at the discharge channel (S1, S2 and S3) from
the external stations (S4, S5 and S6) (Fig. 3). The same
analysis did not show any pattern among months. The
Cluster analysis corroborated the MDS results also
show-Table II. – Abundance (%) of the taxa found at the study sites comprising more than 90 % of the total abundance; taxonomic groups: TXG (P, Polychaetes; B, Bivalves; G, Gastropods; C, Crustaceans), trophic groups:TG (DF, Deposit feeding; FF, Filter-feeding; C, Carnivory; H, Herbivory), AMBI functional group: AG (I, II, III, IV, V, NA (not assigned)) and total contribution (%): TC, of each taxon in the study.
Taxa TXG TG EG TC S1 S2 S3 S4 S5 S6 Capitellidae P DF V 15.8 32.6 7.5 1.2 26.7 27.6 3.5 Cirratullidae P DF IV 5.0 11.7 18.7 2.1 Eunicidae P DF II 1.1 4.6 0.8 2.1 Glyceridae P C II 2.4 3.3 4.5 2.0 7.6 Nereididae P C III 23.0 44.3 69.1 2.7 Spionidae P FF III 1.4 4.7 1.0 Terebellidae P DF I 1.5 9.2
Cerastoderma edule (Linnaeus, 1758) B FF III 1.3 5.0 2.3
Parvicardium scabrum (Philippi, 1844) B FF I 2.6 12.3 1 4.1
Scrobicularia plana (da Costa, 1778) B DF III 18.3 16.1 12.6 83.1 6.9 3.6 2.1
Venerupis senegalensis (Gmelin, 1971) B FF I 1.7 9.6 16.0
Bittium reticulatum (da Costa, 1778) G DF I 12.3 8.6 18.8
Nassarius nitidus (Jeffreys, 1867) G C II 0.4 6.9
Nassarius pfeifferi (Philippi, 1844) G C II 3.8 19.5 4.8
Anthuridae C C II 1.5 2.6 9.0
Calliopiidae C C NA 0.5 1.0 4.2
Corophiidae C DF III 0.6 1.0 2.1
Diogenidae C C II 0.4 1.5 6.9
Cumulative abundance 93.0 93.9 90.3 91.2 90.5 90.6
Fig. 2. – Mean and standard devi-ation of density (ind/m²), species richness (d) and evenness (J’) in each site, across the four sam-pling periods.
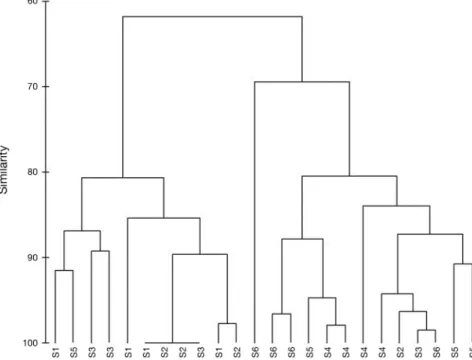
ing a separation between S1 and S2 from S4, S5 and S6
despite some fluctuation of the S6 samples (Fig. 4).
The SIMPER analysis for the “Site” factor showed
higher dissimilarities between the stations nearby the
dis-charge point (S1, S2 and S3) relative to the further ones
(S4, S5 and S6) (Table IV). Those differences where
mainly due to the high abundance of Neredidae,
Scrobi-cularia plana and Capitellidae that comprised more than
Table III. – Statistical analysis results of the one-way ANOVA among sampling sites (S1 to S6) and periods (January, April, June and October) for mean univariated indices (dependent variables): H, Shannon-Wiener diversity; Abundance, J’, Pielou Evenness index; d, Margalef index. P-value: ** < 0.05, * < 0.01. The one way S-N-K ANOVA normality test was used in all analysis. The columns marked with “-“represent no significant difference results.H Ab J’ d
F p-w tests F p-w tests F p-w tests F p-w tests
Jan - - -
-Apr F(5,N = 3) = 23.2 (*) S1,2,3 < S4,5,6 - - F(5,N = 3) = 9.5(*) S2,3 < S4,5,6 F(5,N = 3) = 15.3(*) S1,2,3 < S4,5,6 Jun F(5,N = 3) = 4.5 (**) S1,2 < S4,5 F(5,N = 3) = 2.7(**) S2 > S6 F(5,N = 3) = 3.7(**) S1,2 < S5,6 F(5,N = 3) = 4.4(**) S1,2 < S4,5 Oct F(5,N = 3) = 27.3(*) S1,2 < S3,4 < S5,6 F(5,N = 3) = 9.1(*) S2 > S6 F(5,N = 3) = 7.1(**) S1,2 < S3,4,5,6 F(5,N = 3) = 27.7(*) S1,2 < S3,4 < S5,6
Fig. 3. – No metric multi-dimen-sional scaling (MDS) on square-root-transformed abundance data for the different sites (1, 2, 3, 4, 5 and 6) and sampling periods (January, April, June, October). The replicates were aggregated in the MDS analysis in order to allow a good visualization of the plot.
Fig. 4. – Cluster analysis for the “Site” factor according to the taxa abundances. The replicates were aggregated by averaging.
90 % of the total abundance contribution at S1, S2 and S3
contrary to S4, S5 and S6 where the higher abundance of
these organisms were replaced by a more heterogenous
distribution of total abundance for a higher number of taxa
as nassarius pfeifferi, Bittium reticulatum, Cirratullidae
and Parvicardium scabrum. For the “Month” factor the
same analysis has revealed high dissimilarities between
all months. The similarities within months have however
presented uniform low values (Table IV).
Dissimilarity between months
15.15 October 87.66 83.48 88.08 October
16.19 June 84.63 87.38 June Similarity 21.85 April 85.28 April
within months 22.22 January S1 41.94 Similarity S2 68.72 S2 50.33 within sites S3 81.54 80.76 S3 33.84 S4 92.13 89.91 84.45 S4 31.28 S5 92.59 92.53 91.97 79.03 S5 24.3 S6 96.11 97.78 93.9 92.01 89.84 S6 17.44
Dissimilarity between sites
Table IV. – SIMPER analysis for the “Month” and “Site” factors.
Fig. 5. – Contributions (%) of the different feeding modes (DF, Deposit feeding; FF, Filter feeding; C, Carnivory and H, Herbivory) for every sites and sampling periods.
Trophic groups
Deposit feeding was the dominant feeding group
accounting for more than 75 % of the total abundance
(Fig. 5). This feeding mode was particularly relevant at
the stations located near the discharge point. This
preva-lence was mainly noted at S1
and S2 in the April, June and
October samplings where this
group was almost exclusively
representing more than 90 %
of the total abundance. The
fil-ter-feeding group represented
11.4 % of total organisms
main-ly represented at S3, S4, S5 and
S6, being particularly abundant
in June where it reached 50 %
(S4). The carnivory group had
a low contribution at S1, S2
and S3 and a higher presence at
the external sites, mainly at S6
where it reached more than 80 %
of the abundance in April. The
cluster analysis based on trophic
composition confirmed the
gen-eral separation of stations
locat-ed near (S1, S2 and S3) from
those located far (S4, S5 and S6)
from the source of disturbance
(Fig. 6). The Pearson correlation
between organic matter
con-tent and the abundance of each
trophic group significant
posi-tive between the deposit-feeding
group and the organic matter
(R = 0.45; p < 0.01). A
nega-tive significant correlation was
Fig. 6. – Cluster analysis for the “Site” factor per trophic function according to the taxa abundan-ces. The replicates were aggre-gated by averaging.
Table V. – M-AMBI values and consequent EcoQS for all sites and sampling periods accord-ing to diversity (H’), richness (S) and AMBI values.
Stations Diversity Richness AMBI M-AMBI Status
S1 1.30 3 3.00 0.42 Moderate S2 2.44 7 2.91 0.67 Good January S3 0.00 1 3.00 0.22 Poor S4 1.90 8 3.81 0.58 Good S5 1.90 9 4.72 0.55 Good S6 2.81 12 0.60 0.99 High S1 0.72 2 3.00 0.37 Poor S2 0.47 2 3.00 0.35 Poor April S3 1.19 5 2.82 0.49 Moderate S4 3.10 11 2.34 0.81 High S5 3.36 16 2.07 0.95 High S6 3.46 14 1.66 0.96 High S1 1.42 6 4.13 0.42 Moderate S2 1.19 4 3.56 0.39 Moderate June S3 2.28 6 2.63 0.63 Good S4 2.81 15 1.86 0.92 High S5 3.03 14 2.36 0.89 High S6 1.76 4 1.13 0.63 Good S1 1.01 5 2.90 0.36 Poor S2 0.90 3 2.98 0.32 Poor October S3 2.51 9 3.08 0.53 Good S4 3.17 15 2.97 0.68 Good S5 3.95 22 1.94 0.91 High S6 2.95 8 0.67 0.72 Good
found between this variable and filter-feeding (R = -0.22
p < 0.05), in carnivory (R = -0.8; p < 0.01) and herbivory
(R = -0.26; p < 0.05) groups.
Biotic indices
The multi-index analysis M-AMBI distinguished
dif-ferent EcoQS according to the several sites and periods
of the study (Table V). The higher ecological status was
found systematically at S4, S5 and S6, presenting a
satis-factory status (“Good” or “High”) at every sampling
peri-ods due to a high diversity and richness and to the fact
the majority of that taxa present within this sites belong
to the AMBI groups I and II. To the contrary, the S1 and
S2 presented a low EcoQS with “Poor” (April and
Octo-ber) and “Moderate” (June) classifications, due to the low
diversity and richness as well as the tolerant and
oppor-tunistic character of the few species presented at these
sites. In January S2 presented a “Good” status mainly due
to an exceptional high diversity and richness. S3 shown
the most variable tendency of EcoQS since it presented
“Poor” (January), “Moderate” (April) and “Good” (June
and October) classifications.
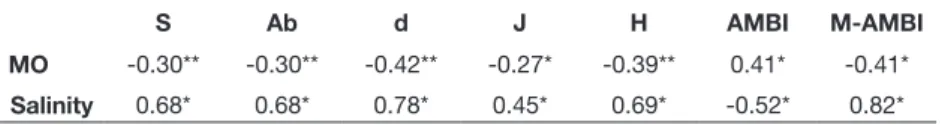
The Pearson correlation between the different biotic
indices used in this study revealed that biotic indices were
negatively correlated with the organic matter content and
positively correlated with the salinity (Table VI).
DISCUSSION
The WWTPs discharges a large amount of nutrients
(Newton et al. 2003, Tett et al. 2003, Loureiro et al. 2005)
and organic matter (Bebiano 1995, Hewitt & Mudge
2004, Loureiro et al. 2005) directly into the Ria Formosa
lagoon also inputting freshwater in the area (Tett et al.
2003). Worldwide, several authors have focused on the
evaluation of soft-bottom communities under the effect
of organic enrichment as Weston (1990) (North America),
Klaoudatos et al. (2006) (Mediteranean), and on
varia-tions of water salinity as Zettler et al. (2007) (Baltic Sea),
Dauer et al. (1987) and Kennish et al. (2004) (North
America) or Teske & Wooldrigde (2001) (South Africa).
Interactions of the structural factors of these communities
may however show a pattern difficult to interpret or may
be masked by other factors such as biological interactions
or pollutants (Kennish et al. 2004). This issue is
particu-larly relevant for WWTP located in sites characterized by
variable physical-chemical conditions, which render
dif-ficult the evaluation of the source
of changes on benthic communities
(Gray 2004). Additionally, some
authors (Weisberg et al.1997) have
related the difficulty to differentiate
habitat-induced variation from
vari-ation caused by natural and
anthro-pogenic stresses which can also constitute a limitation
in evaluating the abundance, diversity, distribution and
trophic structure of benthic assemblages.
The macrobenthic characterization of the present study
showed a pattern similar to several studies that focused
on pollution gradients in other areas (Pearson &
Rosen-berg 1978, Weston 1990), pointing out a significant
high-er abundance of individuals at the pollution source (S2)
when compared to the control site (S6). The diversity
and species richness also followed the normal tendency
of higher values at the sites far from the pollution source
(S4, S5 and S6) and lower values near the WWTP (S1, S2
and S3), as well as the occurrence of shifts in the relative
dominance of trophic guilds along the pollution gradient,
as predicted by Pearson & Rosenberg (1978). Moreover,
trophic structure at the external stations presented a more
heterogenous composition of different trophic groups
when compared to the inner sites, namely the increase of
suspension-feeding and herbivory groups. Carvalho et al.
(2010) has also noted an increase of contribution of other
trophic functional groups in areas of higher water
circu-lation in the Ria Formosa. The water renewal in these
areas seems to reduce the amount of organic compounds
(Tett et al. 2003), decreasing the relative contribution of
opportunistic deposit-feeding found around the WWTP
discharge.
The opportunistic character of dominant taxa in this
study was corroborated by the trophic group analyses,
which clearly showed a positive correlation between
organic matter content and the prevalence of
deposit-feed-ing characteristics. Previous works carried out at the Ria
Formosa (Hewitt & Mudge 2004, Gamito 2006) reported
that sediments in external areas present larger grain-size,
which contributes to a larger interstitial water renewal
and reduces the deposition of detritus on sediments. Such
conditions favor the establishment of filter feeders,
com-petition with other taxa, enhance the presence of
preda-tors and decrease the densities of opportunistic
organ-isms, increasing local diversity and species richness
(Gray 1974, Pearson & Rosenberg 1978). However, the
high amount of suspended solids in the water column in
discharge areas can be detrimental to the feeding
struc-ture of some organisms, namely the suspension
feed-ers (Terlizzi 2005). This factor is particularly important
due to the restricted nature of the discharge zone plus the
small grain-size of the sediments that can lead to a high
sedimentation rate (Terlizzi 2005) and the occurrence of
anoxic processes.
Table VI. – Pearson correlation coefficients for salinity and organic matter crossed with the values of the several biotic indices used for the EcoQS. *: p < 0.001; **: p < 0.05.
S Ab d J H AMBI M-AMBI
MO -0.30** -0.30** -0.42** -0.27* -0.39** 0.41* -0.41*
The natural variations of water salinity values found
from the inner channels of the Ria Formosa to the open
channels (Newton & Mudge 2003) seem to be increased
by the WWTP discharges inducing very low values at the
inner stations. This fact has also contributed to the low
diversity found at these sites since only a few
macroben-thic taxa are able to support such salinity conditions.
The two-way ANOSIM found significant differences
for the “Site” factor, reflected in an evident separation of
two distinct groups of sites: S1, S2, S3 and S4, S5, S6 in
the MDS analysis. As for the “Month” factor, despite the
significant differences revealed by the ANOSIM analysis,
there was no heterogeneity in the representation of the
“Month” samples. This fact, together with the low
simi-larities found within months in the SIMPER analysis for
this factor, suggests that in this study the spatial
variabil-ity overlaps the temporal factor. This tendency should be
however considered with caution since the sampling has
not complied replication within months focusing mainly
on spatial differences along the pollution gradient. The
SIMPER analysis for the “Site” factor suggested that the
dominance of the worms Nereididae and of the bivalve S.
plana at the inner stations has contributed to the
dissimi-larities among sites.
The Scrobicularia plana and Nereididae
popula-tions dynamics found in this study highly contributed to
the macrobenthic community structure, dominating the
sites near the discharge and having a lower contribution
at external sites. These two taxa are recognized as
toler-ant to relatively high organic matter concentrations and
while they may occur under normal conditions, these taxa
populations are stimulated by organic enrichment due to
their ability to feed on organic compounds (AMBI list -
www.azti.es). The high amount of organic matter near
the WWTP constitutes an exceptional food source these
organisms, explaining the high abundance of these taxa
near the WWTP. The strong presence of S. plana in these
areas is possible due to its multitrophic behavior, deposit
and filter feeder (Cheggour et al. 2005), allowing it to
pre-vail in the absence of filtering conditions. The low values
of salinity measured near the discharge point could also
have contributed to the dominance of S. plana over the
scarce abundance of other taxa, due to its strong haline
tolerance (Bryan & Uysal 1978). Several authors pointed
out the deposit-feeder characteristics of the species
with-in the Nereididae family, its typically high abundance with-in
organic enriched systems (Carvalho et al. 2007), and its
haline tolerance (Scaps 2002). In the present study
Nere-ididae were not identified at the species level, not
allow-ing the complete interpretation of the local dynamics of
these organisms.
The M-AMBI index globally made a distinction
among the sites near the discharge channel in relation to
the distant ones, following a gradient of anthropogenic
pressure. Biotic indices analysis has attributed lower
val-ues of EcoQS to S1, S2 and S3 that did not satisfy the
requirements of the WFD. The inclusion of S. plana and
Nereididae in the EGIII associated with lower diversity
values was decisive to such status. In the other hand, at
S4, S5 and S6 the water quality seemed to be unaffected
by the WWTP and showed a satisfactory EcoQS. In fact,
the increase of EcoQS from the inner sites to the
exter-nal ones was in accordance to the differences in
commu-nity structure found with ANOSIM, SIMPER, and the
trophic group analysis. At the S4 station, the intersection
of the discharge with an external water channel seems to
dilute the effects of pollution by the WWTP, normalizing
the organic content of sediments and water salinity
val-ues, and consequently increasing the EcoQS. This fact
was corroborated by the presence of a higher number of
bivalves (e.g. P. scabrum, C. edule, Venerupsis pullastra),
gastropod species (n. pfeifferi and B. reticulatum) and the
appearance of crustaceans that were included in EGI and
II. Borja & Muxica (2005) pointed out some difficulties
in interpreting AMBI results in areas with strong salinity
variations and/or low diversity. In the present study that
problem seems to have been avoided by the use of a
multi-index approach adding the diversity and species richness
to the final analysis in M-AMBI, as recommended by the
same authors (Borja & Muxica 2005).
Overall the results suggest that the WWTP discharge
induces a structural change on the macrobenthic
commu-nities and local EcoQS, especially before the dilution of
the discharge channel into the secondary channel at S4.
In the scope of WFD, new water management measures
should be applied in order to mitigate the “Moderate”
sta-tus waters verified until S3. According to the
ecohydrol-ogy concept, the properties of ecosystems should serve as
management tool to improve water quality (Wolanski et
al. 2004). One possible solution could be to extend the
discharge channel through a pipeline system, to a more
hydrodynamic zone, such as S4, where the greater water
renewal will increase the dispersion of pollutants,
reduc-ing the impact of the discharge. These aspects should be
taken into consideration when evaluating the WFD
cri-teria in areas affected by WWTPs to avoid misleading
results and unnecessary restoration efforts.
This study has tried to evaluate the response of
mac-robenthic communities to an organic and haline stress
using the qualification of the EcoQS approach, still
scarcely applied in local studies. A widespread study
focused on the EcoQS along all the Ria Formosa
eco-system is however needed in order to detect the sensitive
areas affected not only by the local WWTPS but also by
other impact sources allocated there (fish farming,
dredg-ing processes, sand extraction), assessdredg-ing the global range
of this stress factors on the structure and functioning of
the local communities.
Acknowledgements. – This work was supported by Águas
do Algarve company in association with the University of Algarve (Portugal). Special thanks are due to several colleagues who helped in the field and laboratory work, namely Ana
Amar-al, Bárbara Xavier, Miguel Mateus, Miguel Soares and Pedro Almeida.
REFERENCES
Águas M 1986. Simulação da circulação hidrodinâmica na Ria Formosa. in Os Sistemas Lagunares do Algarve. Universida-de do Algarve, Faro-Portugal: 78-90.
Austen M, Warwick R, Rosado C 1989. Meiobenthic and mac-robenthic community structure along a putative pollution gradient in southern Portugal. mar Poll Bull 20: 398-405. Austen M, Widdicombe S 2006. Comparison of the response of
meio and macrobenthos to the disturbance and organic enrichment. J exp mar Biol ecol 330: 96-104.
Bakalem A, Ruellet T, Dauvin JC 2009. Benthic indices and ecological quality of shallow Algeria fine sand community. ecol ind 9: 395-408.
Bebianno MJ 1995. Effects of pollutants in the Ria Formosa Lagoon, Portugal. Sci total environ 171: 107-115.
Bigot L,Grémare A, Amouroux JM, Frouin P, Maire O, Gaer-tner J 2008. Assessment of the ecological quality status of soft-bottoms in Reunion Island (tropical Southwest Indian Ocean) using AZTI marine biotic indices. mar Poll Bull 56: 704-722.
Boaventura D, da Fonseca L, Teles-Ferreira C 1999. Trophic structure of macrobenthic communities in the Portuguese Coast. A review on lagoonal, estuarine and rocky littoral hab-itats. acta oecol 20: 407-415.
Borja A, Franco J, Pérez V 2000. A marine Biotic Index to estab-lish the ecological quality of soft-bottom benthos within European estuarine and coastal environments. mar Poll Bull 40: 1110-1114.
Borja A, Muxika I 2005. Guidelines for the use of AMBI (AZTI’s Marine Biotic Index) in the assessment of the ben-thic ecological quality. mar Poll Bull 50: 787-789.
Borja A, Josefson A, Miles A, Muxika I, Olsgard F, Phillips G, Rodríguez J, Rygg B 2007. An approach to the intercalibra-tion of benthic ecological status assessment in the North Atlantic ecoregion, according to the European Water Frame-work Directive. mar Poll Bull 55: 42-52.
Borja A, Mader J, Muxica I, Rodríguez G, Bald J 2008. Using M-AMBI in assessing benthic quality within the Water Framework Directive: Some remarks and recommendations. mar Poll Bull 56: 1377-1379.
Borja A, Tunberg B 2011. Assessing benthic health in stressed subtropical estuaries, eastern Florida, USA using AMBI and M-AMBI. ecol ind 11(2): 295-303.
Bryan G, Uysal H 1978. Heavy metals in the burrowing bivalve Scrobicularia plana from the Tamar Estuary in relation to environmental levels. J mar Biol ass uK 58: 89-108. Carvalho S, Barata M, Gaspar M, Pousão-Ferreira P, da Fonseca
L 2007. Enrichment of aquaculture earthen ponds with Hediste diversicolor: Consequences for benthic dynamics and natural productivity. aquaculture 262: 227-236.
Carvalho S, Barata M, Pereira F, Ferreira PP, Cancela da Fonse-ca L, Gaspar MB 2010. Can macrobenthic communities be used in the assessment of environmental quality of fish earth-en ponds? J mar Biol ass uK 90: 135-144.
Castel J, Caumette P, Herbert R 1996. Eutrophication gradients in coastal lagoons as exemplified by the Bassin d’Arcachon and the Etang du Prevost, Hydrobiologia 329:1-20.
Cheggour M, Chafik A, Fisher N, Benbrahim S 2005. Metal concentrations in sediments and clams in four Moroccan estuaries. mar environ res 59: 119-137.
Chícharo L, Chícharo A, Gaspar M, Alves F, Regala J 2002. Ecological characterization of dredged and non-dredged bivalve fishing areas off south Portugal. J mar Biol ass uK 82: 41-50.
Clarke K, Warwick R 1994. Change in marine Communities (An Approach to statistical analysis and interpretation). Ply-mouth Marine Laboratory, Natural Environment Research Council, UK, p 173. Coast res 45: 209-226.
Dauer M, Ewing R, Rodi A 1987. Macrobenthic Distribution within the Sediment along an Estuarine Salinity Gradient. int rev Hydrobiol 72: 529-538.
Dauvin J 2007. Paradox of estuarine quality: benthic indicators and indices, consensus or debate for the future. mar Poll Bull 55: 271-281.
Falcão M, Vale C 1990. Study of the Ria Formosa ecosystem: benthic nutrient remineralization and tidal variability of nutrients in the water. Hydrobiologia 207: 137-146.
Fauchald K, Jumars P 1979. The diet of worms: a study of poly-chaetes feeding guilds. oceanogr mar Biol 17: 193-284. Fauvel P 1977. Polychètes sédentaires. Nendeln/Liechtenstein,
Kraus, Kraus Reprint, 494 p.
Fish J, Fish S 1996. A Student’s Guide to the Seashore. 2nd edit.
Cambridge University Press, 563 p.
Gamito S 2006. Benthic ecology of semi-natural coastal lagoons, in the Ria Formosa (Southern Portugal), exposed to different water renewal regimes. Hydrobiologia 555: 75-87.
Grall J, Glémarec M 1997. Using biotic indices to estimate mac-robenthic community perturbations in the Bay of Brest. estu-ar Coast Shelf 44: 43-53.
Gray N 2004. Biology of Wastewater Treatment. 2nd edit.
Impe-rial College Press, 1440 p.
Hewitt E, Mudge S 2004. Detecting anthropogenic stress in an ecosystem: 1. Meiofauna in a sewage gradient. environ forensics 5: 155-170.
Jorgensen B, Richardson K 1996. Eutrophication in Coastal Marine Ecosystems. American Geophysical Union, Wash-ington, DC, 273 p.
Kennish M, Haag S, Sakowicz G, Durand J 2004. Benthic mac-rofaunal conmunity structure along a well-defined salinity gradient in the Mullica River-Great Bay Estuary. Coast res: 209-226.
Klaoudatos S, Klaoudatos D, Smith J, Bogdanos K, Papageor-giou E 2006. Assessment of site specific benthic impact of floating cage farming in the eastern Hios Island, Eastern Aegean Sea, Greece. J exp mar Bio ecol 338: 96-111. Loureiro S, Newton A, Icely J 2005. Effects of nutrient on
pri-mary production in the Ria Formosa coastal lagoon (South-ern Portugal). Hydrobiologia 550: 29-45.
Margalef R 1968. Perspectives in Ecological Theory. University of Chicago Press, Illinois,111 p.
Mostert E 2003. The European Water Framework Directive and water management research. Phys Chem earth 28: 523-527. Mudge S, Bebianno M 1997. Sewage contamination following
an accidental spillage in the Ria Formosa, Portugal. mar Poll Bull 34: 163-17.
Mudge S, Duce E 2005. Identifying the source, transport path and sinks of sewage derived organic matter. environ Poll 136: 209-220.
Muxica I, Borja A, Bald J 2007. Using historical data, expert judgment and multivariate analysis in assessing reference conditions and benthic ecological status, according to the European Water Framework Directive. mar Poll Bull 55: 16-29.
Newton A, Icely J, Falcao M, Nobre A, Nunes J, Ferreiram J, Vale C 2003. Evaluation of eutrophication in the Ria Formo-sa coastal lagoon, Portugal. Cont Shelf res 23: 1945-1961. Newton A, Mudge S.M 2003. Temperature and salinity regimes
in a shallow, mesotidal lagoon, the Ria Formosa, Portugal. estuar Coast Shelf Sci 56: 1-13.
Newton A, Mudge S 2005. Lagoon-sea exchanges, nutrient dynamics and water quality management of the Ria Formosa (Portugal). estuar Coast Shelf Sci 62: 405-414.
Pearson T, Rosenberg R 1978. Macrobenthic succession in rela-tion to organic enrichment and pollurela-tion of the marine envi-ronment. oceanogr mar Biol 16: 229-231.
Prato S, Morgana J, La Valle P, Finoia M, Lattanzi L, Nicolleti L, Ardizzone G , Izzo G 2009. Application of biotic and taxo-nomic distinctness indices in assessing the Ecological Quali-ty Status of two coastal lakes: Caprolace and Fogliano lakes (Central Italy). ecol indic 9: 568-583.
Pielou E.C 1969. An Introduction to Mathematical Ecology. Wiley, New York, 286 p.
Reiss H, Kröncke I 2005. Seasonal variability of benthic indi-ces: an approach to test the applicability of different indices for ecosystem quality assessment. mar Poll Bull 50: 1490-1499.
Ruellet T, Dauvin JC 2007. Benthic indicators: analysis of the threshold values of ecological quality classifications for tran-sitional waters. mar Poll Bull 54: 1707-1714.
Salas F, Neto JM, Borja A, Marques JC 2004. Evaluation of the applicability of a marine biotic index to characterize the sta-tus of estuarine ecosystems: the case of Mondego estuary (Portugal). ecol indic 4: 215-225.
Scaps P 2002. A review of the biology, ecology and potential use of the common ragworm Hediste diversicolor (OF Muller) (Annelida; Polychaeta). Hydrobiologia 470: 203-218. Shannon CE, Weaver W 1949. The Mathematical Theory of
Communication. The University of Illinois Press, Illinois, 117 p.
Snelgrove P, Butman C 1994. Animal-sediment relationships revisited: cause versus effect. oceanogr mar Biol ann rev 32: 111-177.
Sprung M 1994. Macrobenthic secondary production in the intertidal zone of the Ria Formosa-a lagoon in Southern Por-tugal. estuar Coast Shelf Sci 38: 539-558.
Teixeira H, Salas F, Pardal MA, Marques JC 2007. Applicability of ecological evaluation tools in estuarine ecosystems: the case of the lower Mondego estuary (Portugal). Hydrobiolo-gia 587: 101-112.
Terlizzi A, Scuderi D, Fraschetti S, Anderson M 2005. Quantify-ing effects of pollution on biodiversity: a case study of highly diverse molluscan assemblages in the Mediterranean. mar Biol 148: 293-305.
Teske P, Wooldridge T 2001. A comparison of the macrobenthic faunas of permanently open and temporarily open/closed South African estuaries. Hydrobiologia 464: 227-243. Tett P, Gilpin L, Svendsen H, Erlandsson C, Larsson U, Kratzer
S, Fouilland E, Janzen C, Lee JY, Grenz C, Newton A, Fer-reira JC, Fernandes T, Scory S 2003. Eutrophication and some European waters of restricted exchange. Cont Shelf res 23: 1635-1671.
Warwick R 1993. Environmental impact studies on marine com-munities: Pragmatical considerations. aust J ecol 18: 63-80. Weisberg S, Ranasinghe J, Dauer D, Schaffner L, Diaz R,
Frith-sen J 1997. An estuarine benthic index of biotic integrity (B-IBI) for Chesapeake Bay. Coast estuar 20:149-158. Weston D 1990. Quantitative examination of macrobenthic
community changes along an organic enrichment gradient. mar ecol Progr Ser 61: 233-244.
Wolanski E, Boorman L, Chícharo L, Langlois-Saliou E, Lara R, Plater A, Uncles R, Zalewski M 2004. Ecohydrology as a new tool for sustainable management of estuaries and coastal waters. Wetl ecol manag 12(4): 235-276.
Zar J 1996. Biostatistical Analysis. 3rd edit. Prentice Hall, Upper
Saddle River, New Jersey, USA, 662 p.
Zettler M, Schiedek D, Bobertz B 2007. Benthic biodiversity indices versus salinity gradient in the southern Baltic Sea. mar Poll Bull 55: 258-270.
received october 15, 2010 accepted July 25, 2011 associate editor: C fernandez