Guilherme Augusto Teixeira Tassone1, Denis Henrique Silva Nadaleti2, Gladyston Rodrigues Carvalho3, Fernanda Aparecida Castro Pereira4, Vinícius Teixeira Andrade5, César Elias Botelho6
(Received: October 21, 2018; accepted: February 11, 2019)
ABSTRACT: Coffee cultivars that are better adapted and more productive can help reduce production costs and make coffee cultivation more profitable. The Mundo Novo cultivar has stood out as one of the most productive cultivars of Coffea arabica L. Therefore, the aim of this work was to select Mundo Novo progenies with high bean yield capacity and with other agronomic characteristics of interest. We evaluated the bean yield, seed size, plant height, upper and lower canopy diameter, stem diameter, and plant vigor of 24 F4 progenies and one check cultivar. The experimental design consisted of a randomized complete block
design with three replicates and experiments were carried out in two sites: São Sebastião do Paraíso (SSP) and Três Pontas (TP), MG, Brazil. The mixed model approach was used to calculate the genotypic value for each progeny, after which the selective accuracy and genetic gain of the two best progenies in each trait were calculated, the simultaneous selection index of Mulamba and Mock was used to select the two most promising progenies at each site. In general, the genetic gain was higher at SSP than at TP. In SSP, the most promising progenies were 1 [IAC376-2 (M. Novo) x IAC386-17 (M. Novo)] and 20 [IAC382-10 (M. Novo) x IAC388-20 (M. Novo)]. In TP, the most promising progeny was 22 [H1535/181 (M. Novo) x (S795) 1344/10/5], together with the check (Mundo Novo IAC379/19). The highest selection gain was expressed for bean size (the percentage of beans retained in sieve 17).
Index terms: Coffea arabica, ranking, mixed model.
SELEÇÃO SIMULTÂNEA DE PROGÊNIES DE CAFEEIROS MUNDO NOVO POR ÍNDICE DE SELEÇÃO
RESUMO: Cultivares de café mais adaptadas e produtivas podem auxiliar na redução dos custos de produção e tornar a cafeicultura mais rentável. A cultivar Mundo Novo tem se destacado como uma das cultivares mais produtivas de Coffea
arabica L. Diante disso, objetivou-se com este trabalho selecionar progênies de cafeeiro Mundo Novo com elevada capacidade
produtiva e portadoras de outras características agronômicas de interesse. Foram conduzidos experimentos em blocos casualizados em São Sebastião do Paraíso e Três Pontas-MG para a avaliação de 24 progênies F4 e uma testemunha quanto às
características de produtividade, peneira 17 e acima, altura, diâmetro de copa do terço inferior e do terço médio, diâmetro do caule e vigor de plantas. Foi utilizada a abordagem de modelos mistos para o cálculo do valor genotípico para cada progênie, posteriormente foi calculada a acurácia seletiva e o ganho genético da seleção das duas melhores plantas em cada característica. Para resumir, foi considerado um índice de seleção simultâneo de Mulamba e Mock para selecionar as duas progênies mais promissoras em cada local. De um modo geral, o ganho genético foi maior para São Sebastião do Paraíso quando comparado com Três Pontas. Em São Sebastião do Paraíso as progênies mais promissoras foram a 1 [IAC376-2 (M. Novo) x IAC386-17 (M. Novo)] e 20 [IAC382-10 (M. Novo) x IAC388-20 (M.Novo)]. E em Três Pontas, foi a progênie 22 [H1535/181 (M. Novo) x (S795)1344/10/5], juntamente com a testemunha (Mundo Novo IAC379/19). O ganho de seleção foi expressivo, principalmente para a característica peneira 17 e acima.
Termos para indexação: Coffea arabica, ranqueamento, modelos mistos. 1 INTRODUCTION
The Mundo Novo cultivar was discovered by researchers of the Instituto Agronômico de Campinas (IAC) in the city of Mundo Novo (Aparecida Farm), now Urupês, in the region near Araraquara City, state of São Paulo, in mid-1943. The tillage was composed of plants from a Sumatra cultivar that showed phenotypical variations
1,2 Universidade Federal de Lavras/UFLA - Departamento de Agricultura/DAG -Cx. P. 3037 - 37.200-000 - Lavras - MG
[email protected], [email protected]
3,6 Empresa de Pesquisa Agropecuária de Minas Gerais/URESM - Campus UFLA -Cx. P. 176 - 37.200-000 - Lavras - MG
[email protected], [email protected]
4Universidade Federal de Lavras/UFLA - Departamento de Biologia/DBI -Cx. P. 3037 - 37.200-000 - Lavras - MG
5Instituto Agronômico - Centro de Café ‘Alcides Carvalho’ - Cx. P. 28 - 13.012 - 970 - Campinas - SP - [email protected]
but exceptional growth and productivity. The seeds for this crop came from another farm that originally collected the seeds from the city of Jaú. Researchers who visited the farm were provided with the seeds from Jaú that was subsequently cultivated at the Aparecida Farm to form a crop similar to that previously established. The owner reported that the seeds provided for the formation of this crop came from another crop in a property
Thus, the objective in this work was to select “Mundo Novo” coffee progenies with a high productive capacity and other agronomic characteristics of interest.
2 MATERIAL AND METHODS
The hybridizations were carried out between “Mundo Novo” and “Mundo Novo” progenies and between “Mundo Novo” and “Bourbon” progenies. Twenty-four progenies from the F4 generation were obtained at Machado-MG.
Two experiments were carried out in a randomized complete block design, both with three replicates and 24 treatments with one common check (Mundo Novo IAC379/19). Each plot consisted of a line with eight plants spaced 3.2 m × 0.8 m apart. Descriptions of the treatments with their respective crosses are shown in Table 1. The first experiment was established in January 2008 at São Sebastião do Paraíso-MG, on the Experimental Field of São Sebastião do Paraíso (EFSSP: 21°20′45.7′′ S and 45°28′45.7′′ W; 939 m altitude), in Distroferic Red Latosol soil with clay texture and undulating relief. The average annual rainfall is 1470.4 mm and the average temperature is 20.8°C. The second experiment was established in March 2008 at Três Pontas-MG, on the Experimental Field of Três Pontas (EFTP 20°54′72.8′′S and 47°07′33.2′′W, 890 m altitude) in a Distroferic Red Latosol soil with medium texture and undulating relief. The average annual rainfall is 1670 mm and the average temperature is 20.1°C.
Plant sowing and care were performed in accordance with the technical recommendations for the crop.
Evaluated traits
Yield: The harvests were performed manually in both sites during four crop years. The beans of each plot were weighed, and the yield in processed coffee as bags/hectare (sc ha-1) was determined (BARTHOLO et al., 1989). In 2015, the plants that were eight years old was evaluated by the following traits: Seed size (%S17), measured on 300 g samples of processed beans that were classified on a set of sieves specific for the classification of coffee based on size of the raw beans, which were classified into only two groups, i.e., those that passed through sieve 17 and those above, representing the coarse flat type beans; Plant height, measured using a graduated at Mineiro do Tietê, whose plants would have
been produced from seeds of a plant that had been grown on the edge of a dirt road at Santa Terra farm. From this plant, seeds were collected to form other crops in the region (CARVALHO et al., 1952).
After research efforts by the IAC, there are currently several cultivars of the “Mundo Novo” group available in the market. In the breeding programs, the “Mundo Novo” cultivar has been used mainly as a parent, with the purpose of exploring its high bean yield, vegetative vigor, and rusticity (PEREIRA et al., 2010). In addition to these characteristics, this cultivar has been considered important because of market demand and other traits such as quality, size, stability, adaptability, and others.
The breeding programs have developed varieties of coffee to increase productivity and other important agronomic traits and adapted to local climate and soil conditions (PETEK et al., 2006). However, the cultivar responses differ in different environments because of genotype-environment interactions (PINTO et al., 2012).
The use of more refined genetic-statistical procedures, such as the mixed model approach, is a trend in plant breeding. These procedures provide additional parameters relevant to the identification of superior genotypes and to obtain more precise estimates (RAMALHO; ARAÚJO, 2011).
Selecting plants to improve several characteristics simultaneously, to obtain more advantageous cultivars than the preceding cultivar is a great challenge (RAMALHO et al., 2012), mainly for perennial crops (OLIVEIRA et al., 2011, CORRÊA et al., 2017). An alternative is the use of selection indexes that have frequently been used for selection in various plant species (VIEIRA et al., 2017; SILVA et al., 2017; GHOSH et al., 2018). One of the simplest methods is that of Mulamba and Mock (1978), which consists of an ordering of the genotypes for each one of the traits in the order most favorable to improvement, and subsequently, the orders of each genotype referring to each trait are summed, resulting in an additional measurement taken as a selection index (CRUZ et al., 2014).
An important point to increasing the selection efficiency is the use of statistical methods that have the advantage of obtaining the most information about genotypes, resulting in accurate estimations or predictions of breeding values (PEREIRA et al., 2013; BERNARDO, 2010).
rule, from the base to the apical meristem; Upper and lower canopy diameter, measured using a graduated rule considering the reach of the largest branch (cm) in a transverse direction to the planting line; Stem diameter, measured with a caliper 10 cm from the soil surface; Plant vigor, scored from 1 to 10 based on attributes of plants in the field, in which 10 corresponds to plants with the best development and greatest plant vigor. The scores were based on the general aspect of plant as suggested by Carvalho et al. (1979).
The analyses of all traits were conducted based on a mixed model with random effect for the progeny factor and fixed effect for the blocks, expressed in the following equation:
where y is the data vector; m is the vector representing the constant and blocks fixed effect;
p is the vector representing the progenies effects,
where; e is the error vector, and; X and Z are the incidence matrices of the fixed and random effects, respectively. We used SAS (SAS Institute, 2009) with PROC MIXED procedure.
The E-BLUP (empirical best linear unbiased prediction) for the genotypic values of the progenies was carried out subsequently.
We estimated heritability associated with the individual means by the following expression:
where is the variance of progenies;and is the variance of error. The heritability associated with the plot mean was estimated by the following expression:
where is the variance of progenies; is the variance of error; and j is the number of replicates. The square root of heritability provides the selective accuracy (SA) estimate.
For selection, the progenies were ranked in the order of favorability for each trait. Thus, the methodology of Mulamba and Mock (1978) detailed by Cruz et al. (2012) was used. In this methodology, after the ranking of each trait, the
sum of the positions in the ranking is then carried out. The two progenies selected in each site were those that showed the lowest value in terms of the sum of the positions.
The genetic gain was quantified by comparing the general average of the population with the check in each trait. The method used was presented by Vencovsky (1992) by the following formula:
where ds is the selection differential (sd), which is the difference between the mean of the selected genotypes (Xs) and the general population mean (X0) or check (Xt); and is the herdability associated with the plot mean.
In practical terms, the percentage of selection gain was obtained as follows:
3 RESULTS AND DISCUSSION
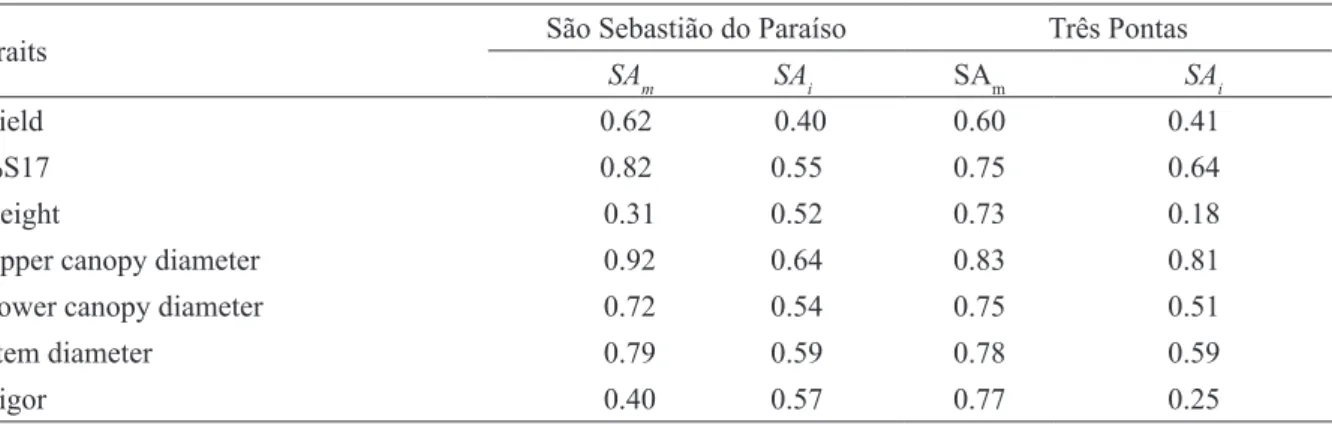
Resende and Duarte (2007) has proposed a scale of accuracy, ordered in levels of experimental precision that are considered high at values higher than 70%, average at values between 40% and 70%, and low at values between 10% and 40%. These parameters indicate whether the experiment has been carried out appropriately and the predicted genetic values are fairly accurate.
In EFSSP, the mean SA level of the progeny ranged from 31% to 92%. The values were considered low for plant height and average for plant vigor and yield, and for other traits, the SA values were classified as high. The SA values associated with the individual means ranged from 40% to 64% and were considered low for plant vigor and height, high for lower canopy diameter, and low for other traits (Table 2).
In EFTP, the experiment generally provided good precision, with mean SA levels in the progeny ranging from 60% to 83%, close to the values found by Silva et al (2017) (74.89% to 91.28%) in conilon clones, suggesting reliable genetic progress in response to selection (Resende, 2007). The average accuracy values for productivity and for the other characteristics are high (Table 2).
In both sites, the SA values at the individual progeny level were lower than those at the mean progeny level for all traits, which shows that the selection will be much more efficient when considering all the progeny plants.
TABLE 1 - Genealogy of F4 progenies of Coffea arabica evaluated in the Experimental Field of São Sebastião do Paraiso (EFSSP) and Experimental Field of Três Pontas (EFTP), MG.
ID Progeny Genealogy
1 H 6664 IAC 376-2 (M. Novo) x IAC386-17 (M. Novo)
2 H 6667 IAC 376-10 (M. Novo) x IAC 379-13 (M. Novo) 3 H 6669 IAC 376-10 (M. Novo) x IAC 382-10 (M. Novo) 4 H 6669 IAC 376-10 (M. Novo) x IAC 382-10 (M. Novo) 5 H 6683 IAC 382-14 (M. Novo) x IAC 382-12 (M. Novo) 6 H 6683 IAC 382-14 (M. Novo) x IAC 382-12 (M. Novo) 7 H 6683 IAC 382-14 (M. Novo) x IAC 382-12 (M. Novo) 8 H 6684 IAC 382-14 (M. Novo) x IAC 386-06 (M. Novo) 9 H 6672 IAC 379-13 (M. Novo) x IAC 379-19 (M. Novo) 10 H 6674 IAC 379-13 (M. Novo) x IAC 382-12 (M. Novo) 11 H 6684 IAC 382-14 (M. Novo) x IAC 386-06 (M. Novo) 12 H 6677 IAC 379-19 (M. Novo) x IAC 382-10 (M. Novo) 13 H 6682 IAC 382-12 (M. Novo) x IAC 386-6 (M. Novo) 14 H 6679 IAC 379-19 (M. Novo) x IAC 386-6 (M. Novo) 15 H 6680 IAC 382-10 (M. Novo) x IAC 382-12 (M. Novo) 16 H 6705 IAC 386-6 (M. Novo) x IAC 387-17 (M. Novo) 17 H 6698 IAC 386-5 (M. Novo) x IAC 387-15 (M. Novo) 18 H 6672 IAC 379-13 (M. Novo) x IAC 379-19 (M. Novo)
19 H 3223 IAC 379-19 (M. Novo) x [393-20-4(Bourbon) x 370(Bourbon)]5 (F1)] 20 H 2917 IAC 382-10 (M. Novo) x IAC 388-20 (M.Novo)
21 H 2931 IAC 388-20 (M. Novo) x IAC 382-14 (M.Novo) 22 H 1596 H 1535/181 (M. Novo) x (S795) 1344/10/5 23 H 6669 IAC 376-10 (M. Novo) x IAC 382-10 (M. Novo) 24 H 2917 IAC 382-10 (M. Novo) x IAC 388-20 (M. Novo)
25 Check Mundo Novo IAC 379/19
ID: Identification of progeny
TABLE 2 - Selective accuracy at individual and progeny levels for São Sebastião do Paraíso and Três Pontas, MG.
Traits São Sebastião do Paraíso Três Pontas
SAm SAi SAm SAi
Yield 0.62 0.40 0.60 0.41
%S17 0.82 0.55 0.75 0.64
Height 0.31 0.52 0.73 0.18
Upper canopy diameter 0.92 0.64 0.83 0.81
Lower canopy diameter 0.72 0.54 0.75 0.51
Stem diameter 0.79 0.59 0.78 0.59
Experimental Field of São Sebastião do Paraíso
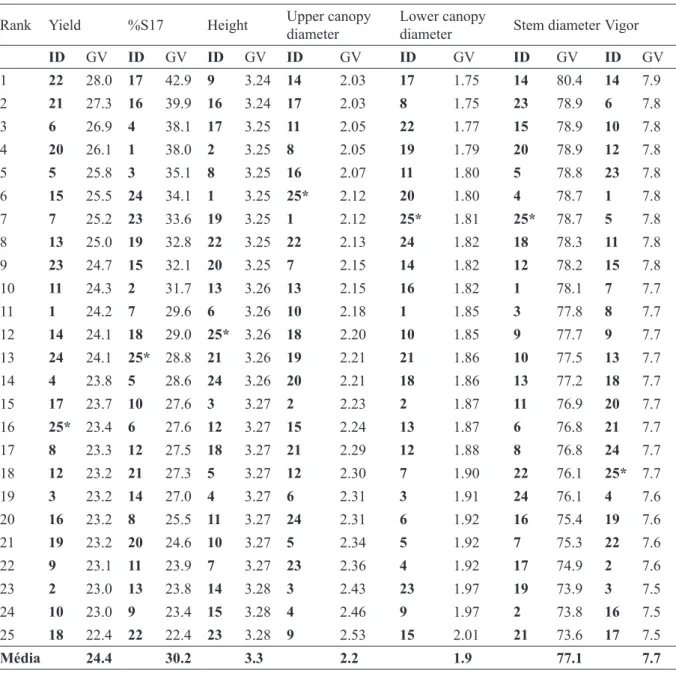
The rankings and genotypic values of each variable are presented in Table 3.
The mean yield ranged from 22.4 sc ha-1 (progeny 18) to 28 sc ha-1 (progeny 22). Because of drought and high temperatures (CONAB, 2014, 2015), the mean yields of the experiments were low in 2014 and 2015.
The classification by sieve size has been an important criterion in selections for superior plants; it is a characteristic related to bean quality, in which the larger seeds present superior physiological qualities (GIOMO et al., 2008). Batches with larger quantities of large flat beans are more valued (BARTHOLO; GUIMARÃES, 1997). In this case, the trait %S17 ranged from 22.4% (progeny 22) to 42.9% (progeny 17). TABLE 3 - Ranking of 25 progenies and their genotypic values (GV) for yield (sc ha-1), %S17 (%), height (m),
upper canopy diameter (m), lower canopy diameter (meters), stem diameter (mm), and vigor (score) in São Sebastião do Paraíso.
Rank Yield %S17 Height Upper canopy diameter Lower canopy diameter Stem diameter Vigor
ID GV ID GV ID GV ID GV ID GV ID GV ID GV 1 22 28.0 17 42.9 9 3.24 14 2.03 17 1.75 14 80.4 14 7.9 2 21 27.3 16 39.9 16 3.24 17 2.03 8 1.75 23 78.9 6 7.8 3 6 26.9 4 38.1 17 3.25 11 2.05 22 1.77 15 78.9 10 7.8 4 20 26.1 1 38.0 2 3.25 8 2.05 19 1.79 20 78.9 12 7.8 5 5 25.8 3 35.1 8 3.25 16 2.07 11 1.80 5 78.8 23 7.8 6 15 25.5 24 34.1 1 3.25 25* 2.12 20 1.80 4 78.7 1 7.8 7 7 25.2 23 33.6 19 3.25 1 2.12 25* 1.81 25* 78.7 5 7.8 8 13 25.0 19 32.8 22 3.25 22 2.13 24 1.82 18 78.3 11 7.8 9 23 24.7 15 32.1 20 3.25 7 2.15 14 1.82 12 78.2 15 7.8 10 11 24.3 2 31.7 13 3.26 13 2.15 16 1.82 1 78.1 7 7.7 11 1 24.2 7 29.6 6 3.26 10 2.18 1 1.85 3 77.8 8 7.7 12 14 24.1 18 29.0 25* 3.26 18 2.20 10 1.85 9 77.7 9 7.7 13 24 24.1 25* 28.8 21 3.26 19 2.21 21 1.86 10 77.5 13 7.7 14 4 23.8 5 28.6 24 3.26 20 2.21 18 1.86 13 77.2 18 7.7 15 17 23.7 10 27.6 3 3.27 2 2.23 2 1.87 11 76.9 20 7.7 16 25* 23.4 6 27.6 12 3.27 15 2.24 13 1.87 6 76.8 21 7.7 17 8 23.3 12 27.5 18 3.27 21 2.29 12 1.88 8 76.8 24 7.7 18 12 23.2 21 27.3 5 3.27 12 2.30 7 1.90 22 76.1 25* 7.7 19 3 23.2 14 27.0 4 3.27 6 2.31 3 1.91 24 76.1 4 7.6 20 16 23.2 8 25.5 11 3.27 24 2.31 6 1.92 16 75.4 19 7.6 21 19 23.2 20 24.6 10 3.27 5 2.34 5 1.92 7 75.3 22 7.6 22 9 23.1 11 23.9 7 3.27 23 2.36 4 1.92 17 74.9 2 7.6 23 2 23.0 13 23.8 14 3.28 3 2.43 23 1.97 19 73.9 3 7.5 24 10 23.0 9 23.4 15 3.28 4 2.46 9 1.97 2 73.8 16 7.5 25 18 22.4 22 22.4 23 3.28 9 2.53 15 2.01 21 73.6 17 7.5 Média 24.4 30.2 3.3 2.2 1.9 77.1 7.7
The selection of shorter plants has been a priority for coffee breeding programs, especially for mechanized regions; non-significant correlations between height and yield have been found (CARVALHO et al., 2010; SEVERINO et al., 2002). Among the evaluated progenies, mean plant height values ranged from 3.24 m (progeny 9) to 3.28 m (progeny 23). This is the characteristic that showed the lowest variation among the progenies, confirming the low selective accuracy (31%) in the mean progeny level at this site.
The capacity of high-density planting progenies is useful information to the breeder, since the larger the number of plants in the stand, the greater the average productivity of the field over the years. Moreover, taking the average over a number of years (PEREIRA et al., 2007) tends to attenuate adverse environmental effects. Estimating the plant density involves measuring the canopy structure and dimension of the plants. The lower canopy diameter ranged from 2.03 m (progeny 14) to 2.53 m (progeny 9). The upper canopy diameter of the progenies ranged from 1.75 m (progeny 17) to 2.01 m (progeny 15).
Among the evaluated progenies, the stem diameters ranged from 73.6 mm (progeny 21) to 80.3 mm (progeny 14). According to Ferreira et al. (2014) the stem of the coffee plant contains reserve tissues that represent an important source of carbohydrates to supply the vegetative and reproductive demands of plants. A larger stem diameter also contributes to reduce the tendency of the plants to tip, thus improving the management of coffee trees.
Plant vigor scores sum up, in the view of a breeder, the overall performance of the plant. There was low variation in plant vigor, which ranged from 7.5 (progeny 17) to 7.9 (progeny 14); the mean value is much higher than that found by Fazuoli et al. (2005) in “Mundo Novo” progenies in Campinas, SP. According to Severino et al. (2002), high plant vigor correlates positively with the adaptation of the cultivar to the environment. Therefore, a selection process that considers plant vigor may favor the selection of plants with a lower possibility of depletion and greater longevity.
In general, the average stem diameter of 56% of progenies was higher than the general average; for other traits (yield, %S17, and vigor), only 36% of progenies had averages that were above the general average. For plant height, upper canopy diameter and lower canopy diameter, the aim of the selection was to decrease the average, and in this case, 56%, 48%, and 36% of the progenies, respectively, had averages below the general average.
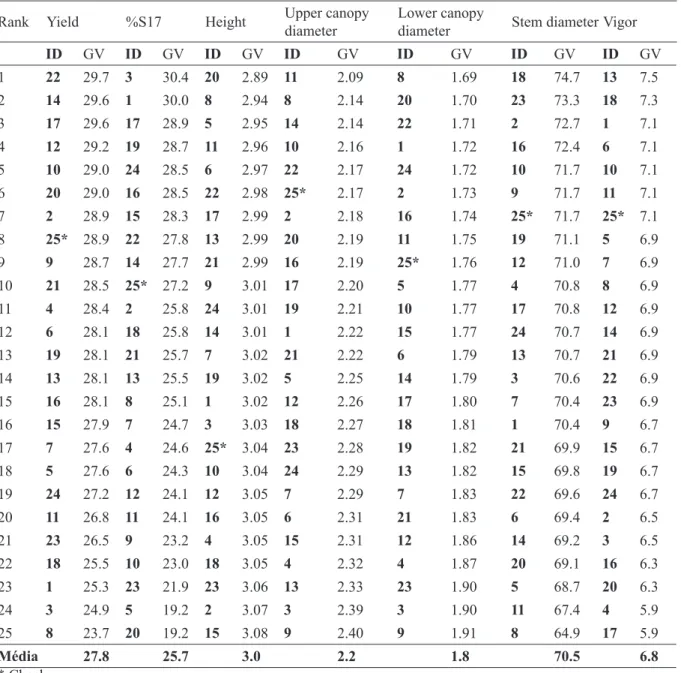
Experimental Field of Três Pontas
Mean yields ranged from 23.7 sc ha-1 (progeny 8) to 29.7 sc ha-1 (progeny 22). Progeny 22 was the most productive at both sites. Similar results were found by Raso et al. (2015), who observed average yields of 29.7 sc ha-1 in cultivars of “Mundo Novo” in Três Pontas-MG (Table 4). There is no strong correlation between rankings considering the both sites, this shows the presence of genotypes by environments interaction (GEI) also observed by Carvalho et al. (2010), and Beksisa et al. (2018) that effectively determined the existence of GEI among Coffea arabica genotypes.
The %S17 values ranged from 19.2% (progeny 20) to 30.4% (progeny 3). In comparison to the other site, the average %S17 was lower by 4.5%.
Plant heights ranged from 2.89 m (progeny 20) to 3.08 m (progeny 15). The level of variation observed among the progenies is slightly higher than in São Sebastião do Paraíso. This level of variation favored a higher level of selective accuracy at the progeny level (73%).
The lower canopy diameters ranged from 2.09 m (progeny 11) to 2.40 m (progeny 9) while the upper canopy diameter ranged from 1.69 m (progeny 8) to 1.91 m (progeny 9). In the São Sebastião do Paraíso, progeny 9 also had a larger lower canopy diameter.
The stem diameters varied from 64.8 mm (progeny 8) to 74.7 mm (progeny 18). The general mean was 6.6 mm lower than in São Sebastião do Paraíso, which can be explained by the different management and cultivation practices in each site.
Plant vigor scores varied between 5.9 (progeny 17) and 7.5 (progeny 13), which was a higher level of variation compared to the previous site and reflects a higher mean score at the progeny level. A similar trend was observed for plant height, which shows how much these two characteristics are heavily influenced by the environment.
The percentage of progenies that had averages above the general average for yield, %S17, stem diameter and vigor were 64%, 48%, 56% and 60%, respectively. These percentages, except for stem diameter, were higher at this location. There were no differences between sites in the percentages of progenies that had averages above the general average for case upper and lower canopy diameter and plant height.
Selection
We simulated the selection of two progenies for each trait and the selection gain was quantified considering the general mean of the progenies and the check (Table 5).
For both sites, the highest gains were observed for the %S17, thus, the population subjected to the selection process has a high level of genetic variability for grain size and the possibility exists to obtain greater success in the selection for
TABLE 4 - Ranking of 25 progenies and their genotypic values for yield (sc ha-1), %S17 (%), height (m), upper
canopy diameter (m), lower canopy diameter (m), stem diameter (mm), and vigor (score) in Três Pontas, MG. Rank Yield %S17 Height Upper canopy diameter Lower canopy diameter Stem diameter Vigor
ID GV ID GV ID GV ID GV ID GV ID GV ID GV 1 22 29.7 3 30.4 20 2.89 11 2.09 8 1.69 18 74.7 13 7.5 2 14 29.6 1 30.0 8 2.94 8 2.14 20 1.70 23 73.3 18 7.3 3 17 29.6 17 28.9 5 2.95 14 2.14 22 1.71 2 72.7 1 7.1 4 12 29.2 19 28.7 11 2.96 10 2.16 1 1.72 16 72.4 6 7.1 5 10 29.0 24 28.5 6 2.97 22 2.17 24 1.72 10 71.7 10 7.1 6 20 29.0 16 28.5 22 2.98 25* 2.17 2 1.73 9 71.7 11 7.1 7 2 28.9 15 28.3 17 2.99 2 2.18 16 1.74 25* 71.7 25* 7.1 8 25* 28.9 22 27.8 13 2.99 20 2.19 11 1.75 19 71.1 5 6.9 9 9 28.7 14 27.7 21 2.99 16 2.19 25* 1.76 12 71.0 7 6.9 10 21 28.5 25* 27.2 9 3.01 17 2.20 5 1.77 4 70.8 8 6.9 11 4 28.4 2 25.8 24 3.01 19 2.21 10 1.77 17 70.8 12 6.9 12 6 28.1 18 25.8 14 3.01 1 2.22 15 1.77 24 70.7 14 6.9 13 19 28.1 21 25.7 7 3.02 21 2.22 6 1.79 13 70.7 21 6.9 14 13 28.1 13 25.5 19 3.02 5 2.25 14 1.79 3 70.6 22 6.9 15 16 28.1 8 25.1 1 3.02 12 2.26 17 1.80 7 70.4 23 6.9 16 15 27.9 7 24.7 3 3.03 18 2.27 18 1.81 1 70.4 9 6.7 17 7 27.6 4 24.6 25* 3.04 23 2.28 19 1.82 21 69.9 15 6.7 18 5 27.6 6 24.3 10 3.04 24 2.29 13 1.82 15 69.8 19 6.7 19 24 27.2 12 24.1 12 3.05 7 2.29 7 1.83 22 69.6 24 6.7 20 11 26.8 11 24.1 16 3.05 6 2.31 21 1.83 6 69.4 2 6.5 21 23 26.5 9 23.2 4 3.05 15 2.31 12 1.86 14 69.2 3 6.5 22 18 25.5 10 23.0 18 3.05 4 2.32 4 1.87 20 69.1 16 6.3 23 1 25.3 23 21.9 23 3.06 13 2.33 23 1.90 5 68.7 20 6.3 24 3 24.9 5 19.2 2 3.07 3 2.39 3 1.90 11 67.4 4 5.9 25 8 23.7 20 19.2 15 3.08 9 2.40 9 1.91 8 64.9 17 5.9 Média 27.8 25.7 3.0 2.2 1.8 70.5 6.8 * Check
ID: identification of progeny
this trait. Negative gains refer to the traits that are selected based on their reduction compared to the average; among them, plant height presented the lowest gain of selection in São Sebastião do Paraíso. In contrast to plant height, in Três Pontas, the selection gain for productivity was not as significant as that in São Sebastião do Paraíso. These results show how much the environment can interfere with genotypic characteristics and selection as found by Ferreira et al. (2005).
TABLE 5 - Selection gain (%) for all traits evaluated in São Sebastião do Paraíso and Três Pontas in relation to the general population mean and the check (Mundo Novo IAC 379/19).
Traits SG São Sebastião do Paraísomean SG check SG meanTrês PontasSG check
Yield 5.12 6.98 2.40 0.93
%S17 24.93 29.41 9.85 6.20
Height -0.06 -0.06 -1.68 -2.19
Upper canopy diameter -7.24 -3.59 -3.84 -1.75
Lower canopy diameter -3.06 -1.71 -2.99 -2.08
Stem diameter 2.08 0.77 3.05 2.03
Vigor 0.31 0.31 5.23 2.51
Falconer (1996) reported that it is possible to achieve faster progress through a correlated response rather than through the direct selection
of the desired trait. In order to summarize the characteristics and to carry out the simultaneous selection, the sum of ranking at each site is presented in Table 6.
TABLE 6 - Ranking by the sum of individual ranks of 24 progenies and the cultivar Mundo Novo IAC 379/19, according to the Mulamba and Mock (1978) index, in São Sebastião do Paraíso and Três Pontas, MG.
São Sebastião do Paraíso Três Pontas
ID Sum of ranks ID Sum of ranks
1 47 22 50 20 60 25* 58 14 65 14 65 17 66 10 66 25* 69 17 72 8 71 1 73 11 72 16 77 16 77 2 78 22 77 8 78 5 82 11 80 15 84 19 81 24 84 20 84 6 85 24 84 19 88 13 87 23 88 21 88 10 90 18 89 7 91 6 91 18 95 12 95 21 95 5 99 12 96 7 106 13 99 9 112 4 101 15 112 2 109 23 117 3 114 3 122 9 117 4 127 * Check
After ranking in the ascending order, we observed that in São Sebastião do Paraíso, the best progenies were 1 [IAC376-2 (M. Novo) x IAC386-17 (M. Novo)] and 20 [IAC382-10 (M. Novo) x IAC388-20 (M. Novo)]. In addition, progeny 14 [IAC379/19 (M. Novo) x IAC386-6 (M. Novo)] and 17 [IAC386-5 (M. Novo) x IAC387-15 (M. Novo)] ranked higher than the control, which ranked fifth overall.
In Três Pontas, progeny 22 [H1535/181 (M. Novo) x (S795) 1344/10/5] and the check (Mundo Novo IAC379/19) ranked highest. The differentiation of progeny 22 at this site reflects its genealogy, which includes a genetic factor for resistance to rust, the SH3 gene. Van-der-Vossen (2005) observed that coffee plants carrying the
SH3 gene are likely to express durable resistance.
Furthermore, the yield of progeny 22 was higher, which was also observed in São Sebastião do Paraíso.
4 CONCLUSIONS
The genetic breeding program will benefit from the information and selection data from this study, especially since the genetic material used originated from “Mundo Novo,” the most planted coffee cultivar. The selection gain was expressed mainly for the trait bean size (percentage of beans retained in sieve 17). In general, the genetic gain was higher in São Sebastião do Paraíso than in Três Pontas.
5 ACKNOWLEDGEMENTS
The authors thank Universidade Federal de Lavras, Empresa de Pesquisa Agropecuária de Minas Gerais, FAPEMIG, Consórcio Pesquisa Café, INCT Café, IAC, CNPq and Capes.
6 REFERENCES
BARTHOLO, G. F. et al. Cuidados na colheita, no preparo e no armazenamento do café. Informe Agropecuário, Campinas, v. 14, p. 33-44, 1989. BEKSISA, L. et al. Genotype × environment interaction and yield stability of Arabica coffee (Coffea arabica L.) genotypes. African Journal of Agricultural Research, v. 13, n.4, p. 210-219, 2018.
BERNARDO, R. Breeding for quantitative traits in plants. Stemma Press, Woodbury, 2010.
CARVALHO, A.; ANTUNES FILHO, H. Melhoramento do cafeeiro: X - Seleção visando eliminar o defeito “Lojas vazias do fruto” no cafeeiro Mundo Novo. Bragantia, Campinas, v. 14, p. 51-62, 1955.
CARVALHO, A.; MÔNACO, L. C.; FAZUOLI, L. C. Melhoramento do café. XL - Estudos de progênies e híbridos de café Catuaí. Bragantia, Campinas, v. 38, p. 202-2016, 1979.
CARVALHO, A. M. de et al. Correlação entre crescimento e produtividade de cultivares de café em diferentes regiões de Minas Gerais, Brasil. Pesquisa Agropecuária Brasileira, Brasília, v. 45, p. 269-275, 2010.
CARVALHO, A. et al. Melhoramento do cafeeiro. IV- Café Mundo Novo. Bragantia, Campinas, v. 12, p. 97-129, 1952.
CONAB - COMPANHIA NACIONAL DE ABASTECIMENTO. Acompanhamento da safra brasileira: café, safra 2014, quarto levantamento. Brasília, 2014, 51 p.
CONAB - COMPANHIA NACIONAL DE ABASTECIMENTO. Acompanhamento da safra brasileira: café, safra 2015, quarto levantamento. Brasília, 2015, 60 p.
CORRÊA, T. R. et al. Phenotypic markers in early selection for tolerance to dieback in Eucalyptus. Industrial Crops and Products, v. 107, p. 130–138, 2017.
CRUZ, C. D.; REGAZZI, A. J.; CARNEIRO, P. C. S. Modelos biométricos aplicados ao melhoramento genético. Viçosa: Editora da UFV. v. 2. 2014, 514p. FALCONER, D. S.; MACKAY, T. F. C. Introduction to Quantitative Genetics. Longman Pearson. 4 edition. 1996, 480p.
FAZUOLI, L. C. et al. Avaliação das cultivares Mundo Novo, Bourbon Amarelo e Bourbon Vermelho de Coffea arabica L. em Campinas. Bragantia, Campinas, v. 64, p. 533-546, 2005.
FERREIRA, A. et al. Seleção simultânea de Coffea canephora por meio da combinação de análise de fatores e índices de seleção. Pesquisa Agropecuária Brasileira, Brasília, v. 40, n.12, p. 1189-1195, 2005. FERREIRA, I. N. M.; SANTOS, C. S.; CHAVES FILHO, J. T. Caracterização anatômica dos órgãos vegetativos do cafeeiro arábica (Coffea arabica L.). Fragmentos de Cultura, Goiânia, v. 24, p. 153-161, 2014.
GIOMO, G. S.; NAKAGAWA, J.; GALLO, P. B. Beneficiamento de sementes de café e efeitos na qualidade física. Bragantia, Campinas, v. 67, p. 997-1010, 2008.
GHOSH, T. K. et al. Genetic variability and selection index evaluation of some selected tomato lines for their yield and yield components. Bangladesh journal of environmental science, Dhaka, v. 34, p. 73-78, 2018. LITTELL, R. C. et al. SAS for mixed models. SAS Institute, Cary, 2006.
MULAMBA, N. N.; MOCK, J. J. Improvement of yield potential of the Eto Blanco maize (Zea mays L.) population by breeding for plant traits. Egyptian Journal of Genetics and Cytology, Cairo, v. 7, p. 40-51, 1978.
OLIVEIRA, A. C. B. et al. Prediction of genetic gains from selection in Arabica coffee progênies. Crop Breeding and Applied Biotechnology, Viçosa, v. 2, p. 106-113, 2011.
PEREIRA, T. B. et al. Eficiência da seleção de progênies de café F4 pela metodologia de modelos mistos (REML/ BLUP). Bragantia, Campinas, v. 72, p. 230-236, 2013. PETEK, M.R. et al. Seleção de progênies de Coffea arabica com resistência simultânea à mancha aureolada e à ferrugem alaranjada. Bragantia, Campinas, v. 65, p. 65-73, 2006.
PIEPHO, H. P.; BUCHSE, A.; RICHTER, C. A mixed modeling approach for randomized experiments with repeated measures. Journal of Agronomy and Crop Science, v. 190, p. 230–247, 2004.
PINTO, M. F. et al. Eficiência na seleção de progênies de cafeeiro avaliadas em Minas Gerais. Bragantia, Campinas, v. 71, p. 1-7, 2012.
PEREIRA, S. P. et al. Crescimento vegetativo e produção de cafeeiros (Coffea arabica L.) recepados em duas épocas, conduzidos em espaçamentos crescentes. Ciência e Agrotecnologia, Lavras, v. 31, p. 643-649, 2007.
PEREIRA, A. A. et al. Cultivares: origem e suas características In: REIS, P. R. AND CUNHA, R. L. (Eds). Café Arábica do plantio a colheita. Lavras: EPAMIG, 2010, p. 163-222.
RAMALHO, M. A. P.; ARAUJO, L. C. A. de. Breeding self-pollinated plants. Crop Breeding and Applied Biotechnology, Viçosa, v. 11, p. 1-7, 2011.
RAMALHO, M. A. P.; SANTOS, J. B. dos; ZIMMERMANN, M. J. de O. Aplicações da genética quantitativa no melhoramento de plantas autógamas. Lavras: UFLA, 2012.
RESENDE, M.D.V. de; DUARTE, J.B. Precisão e controle de qualidade em experimentos de avaliação de cultivares. Pesquisa Agropecuária Tropical, v.37, p.182-194, 2007.
SAS - STATISTICAL ANALYSIS SYSTEM INSTITUTE. SAS/STAT 9.0: user’ guide. Software, 2009.
SEVERINO, L. S. et al. Associações da produtividade com outras características agronômicas de café (Coffea arabica L. “Catimor”). Acta Scientiarum, v. 24, p. 1467-1471, 2002.
SILVA, L. A. et al. Selection strategy for indication of crosses between potential sugarcane genotypes aiming at the production of bioenergy. Industrial Crops and Products, Amsterdam, v. 104, p. 62–67, 2017.
VAN DER VOSSEN, H. A. M. The cup quality of disease-resistant cultivars of Arabica Coffee (Coffea arabica). Experimental Agriculture, v. 45, p. 323-332, 2009.
VENCOVSKY, R.; BARRIGA, P. Genética biométrica no fitomelhoramento. Ribeirão Preto: Sociedade Brasileira de Genética, 1992.
VIEIRA, R. A. et al. Selection index based on the relative importance of traits and possibilities in breeding popcorn. Genetics and Molecular Research, Brasília, v. 15, n. 2, p. 1–10, 2016.