http://www.uem.br/acta ISSN printed: 1806-2636 ISSN on-line: 1807-8672
Acta Scientiarum
Doi: 10.4025/actascianimsci.v36i2.22013
A procedure to evaluate the efficiency of utilization of dietary
amino acid for poultry
Edney Pereira da Silva¹, Nilva Kazue Sakomura¹*, Juliano Cesar de Paula Dorigam¹, Euclides Braga Malheiros¹, João Batista Kochenborger Fernandes² and José Anchieta de Araujo¹
¹Faculdade de Ciências Agrárias e Veterinárias, Universidade Estadual Paulista “Júlio de Mesquita Filho”, Via de Acesso Prof. Paulo Donato Castellane, s/n, 14884-900, Jaboticabal, São Paulo, Brazil. ²Centro de Aquicultura, Universidade Estadual Paulista “Júlio de Mesquita Filho”, Jaboticabal, São Paulo, Brazil. *Author for correspondence. E-mail: sakomura@fcav.unesp.br
ABSTRACT. The aim of this study was to develop a procedure based on Gompertz function to determine the efficiency of utilization of amino acid. The procedure was applied to determine the efficiency of utilization of dietary lysine, methionine+cystine and threonine by growing pullets and based on the efficiencies were estimated the requirements for the growth phase of birds. The Gompertz function was fitted to the data of feed intake, body weight, feather-free body protein weight and feather protein weight of four strains of laying hens in the growth phase. The rates of consumption and daily protein deposition (PD) were calculated. The amino acid deposition was obtained by multiplying the PD by the amino acid concentration in feather protein and feather-free body protein. The results showed that the efficiency of utilization of amino acid decreased with maturity and, conversely, there was a proportional increase of the requirement per kg of weight gain. The procedure based on the Gompertz function to determine the efficiency of utilization of amino acid proved to be suitable to evaluate the efficiency of utilization of amino acid and can be a useful tool to diagnose the effectiveness of the nutritional management, aiding in decision-making on the nutritional management.
Keywords:growth curve, lysine, methionine+cystine, protein weight, pullets, threonine.
Um procedimento para avaliar a eficiência de utilização do aminoácido dietético para aves
RESUMO. O objetivo deste estudo foi desenvolver um procedimento baseado na função Gompertz para determinar a eficiência de utilização do aminoácido. O procedimento foi aplicado para determinar a eficiência de utilização da lisina, metionina+cistina e treonina da dieta de frangas de postura em crescimento, e com base nas eficiências foram estimadas as exigências para fase de crescimento das aves. A função Gompertz foi ajustada aos dados de consumo de ração, peso corporal, peso proteico do corpo depenado e peso de penas de quatro linhagens de aves de postura na fase de crescimento. As taxas de consumo e deposição diária de proteína (DP) foram calculadas. A deposição do aminoácido foi obtida multiplicando a DP pela concentração do aminoácido nas penas e corpo depenado. Os resultados obtidos demonstraram que as eficiências de utilização dos aminoácidos diminuíram com a maturidade e, inversamente, houve um aumento proporcional da exigência por kg de ganho de peso. O procedimento baseado na função Gompertz para determinar a eficiência de utilização do aminoácido mostrou ser adequado para avaliar a eficiência de utilização do aminoácido e pode ser uma ferramenta útil para diagnosticar a eficácia do manejo nutricional auxiliando na tomada de decisões sobre o manejo nutricional.
Palavras-chave:curva de crescimento, lisina, metionina+cistina, peso proteico, frangas, treonina.
Introduction
Among the functions used to describe the growth, the Gompertz function (GOMPERTZ, 1825) is the most used for poultry. This preference is partially due to the biological significance of its parameters as well as the ease of statistical adjustment and robustness in describing the trajectory of growth in birds (RIVERA-TORRES et al., 2011). This equation has also been applied on estimates of the efficiency of amino acid utilization. This application allows daily calculations of
the deposition and nutrient intake during the whole production period, giving dynamism to the inferences. This approach makes it possible to diagnose the daily efficiency of amino acid utilization and, consequently, decision-making on the nutritional management to be adopted.
requirement of the phase, the animal receives restricted nutritional levels at the initial phase and excessive levels at the final phase. Therefore, techniques that assess the efficiency of utilization of nutrients are necessary (SILVA et al., 2013) to make decisions and optimize dietary levels, aiming to minimize the effects from limited and excess supply of nutrients. For birds, the amino acids methionine, lysine and threonine are the major limiting amino acids in corn and soybean meal based diets. Considering this, this study aimed to develop a procedure based on the Gompertz function to determine the efficiency of amino acid utilization. The procedure was applied to determine the efficiency of utilization of dietary lysine (Lys), methionine+cystine (Met+Cys) and threonine (Thr) for growing pullets and based on the efficiencies were estimated the requirements for the growth phase of the birds.
Material and methods
The study was conducted in the Laboratory of Poultry Science, Faculty of Agricultural and Veterinary Sciences, UNESP - FCAV (Lavinesp), Jaboticabal-SP, Brazil. The genetic parameters were determined from four laying hen strains, Hy-Line Brown (HLB), Hisex Brown (HSB), Hy-Line W-36 White (HLW) and Hisex White (HSW). Birds were distributed into four groups with four replicates of 75 birds, amounting to 16 experimental units. The experimental period was 126
days. Pullets of each strain were housed in breeding (1st
to 6th week) and rearing (7th to 18th week) cages.
Birds fed diets based on corn, soybean meal and wheat bran, to meet their nutritional requirements, in accordance with the recommendation of Rostagno et al. (2000) for each phase of raising. For white strains, the content of metabolizable energy (AMEn) and
crude protein (CP) were: 2,950 kcal AMEn kg-1 and
21% CP, 1st to 6th week; 2,850 kcal AMEn kg-1 and
18% CP from the 7th to 12th week; 2,800 kcal
AMEn kg-1 and 16% CP from the 13rd to 18th
weeks. For brown strains were used: 2,950 kcal
AMEn kg-1 and 21% CP from the 1st to 6th week;
2,850 kcal AMEn kg-1 and 17% CP from the 7th to
12sd week; 2,750 kcal AMEn kg-1 and 16% CP
from the 13rd to 18th week.
The birds and feed leftovers were weighed weekly. Based on the average body weight of the birds, we selected a sample of each experimental unit for slaughtering. After fasting for 24 hours, birds were
individually weighed and killed using CO2. A sample
of feathers was collected for later analysis. The weight
of feathers was obtained by difference between the weight of the fasting bird and the weight of the feather-free carcass. Samples of feather-free carcass and feathers were analyzed for dry matter (in oven at 105ºC for 16 hours), and for total nitrogen content by the Kjeldahl method (2001.11) according to AOAC (2002). The factor 6.25 was used to convert the nitrogen content into crude protein. The variables analyzed were daily feed intake, feather-free protein weight and feather protein weight. For the relationship of these variables over time we used the Gompertz equation (1):
Wt = Wm×e[-e((ln(-lnWi/Wm))-(B×t))] (1)
where:
t is the age (days), Wt is the weight or feed
intake at each time t, Wi is the weight at birth or
initial feed intake (kg) diet, Wm is the weight or
feed intake at maturity (kg), B is the maturity rate
(day-1), ‘e’ is the numerical base of ‘Euler’ and ‘ln’
is the natural log.
The daily protein deposition (dPD, g day-1)
was calculated by the equation (2) (GOUS et al., 1999), applied to the protein weight of the feather-free body (BP) and feather protein weight (FP):
dPD = B× Wt × ln(Wm/Wt) (2)
The deposition of Lys (dLys), Met+Cys (dMet+Cys) and Thr (dThr) in the body was obtained by summing the deposition of these amino acids in BP and FP as follows:
dLys = dPDc×AAc + dPDf×AAf
dMet+Cys = dPDc×AAc + dPDf×AAf
dThr = dPDc×AAc + dPDf×AAf
where:
dPDc (g day-1) and dPDf (g day-1) are
respectively the protein deposition in BP and FP,
obtained by equation (2). AAc is the amino acid
content in BP, considered in this study as Lys =
75 mg g-1, Met+Cys = 36 mg g-1 and Thr = 42
mg g-1. AAf is the amino acid content in the FP,
considered in this study as Lys = 18 mg g-1,
Met+Cys = 76 mg g-1 and Thr, = 44 mg g-1,
obtained from Emmans (1989).
The ccLys in the diet were: 10.09, 8.11 and
7.24 g kg-1 in the initial, breeding and rearing
phases for white strains and 10.09, 8.16 and
6.67 g kg-1, for brown strains. The ccMet+Cys in
diets were, respectively: 6.37, 5.63, 5.03 g kg-1 for
initial, breeding and rearing phases for white
strains and 6.37, 5.76, 5.04 g kg-1 for brown
strains. The ccThr in diets were, respectively:
7.07, 5.99, 5.24 g kg-1 for initial, breeding and
rearing phases for white strains and 7.07, 5.59,
5.25 g kg-1, for brown strains.
The efficiency of utilization of amino acid was obtained by the ratio between the deposition (dLys, dMet+Cys and dThr) and the respective intake corrected for maintenance of Lys (icLys), Met+Cys (icMet+Cys) and Thr (icThr).
kLys = dLys/icLys×100
kMet+Cys = dMet+Cys/icMet+Cys×100 kThr = dThr/icThr×100
In this calculation, the values of icLys, icMet+Cys and icThr were obtained by subtracting the daily intake of the amino acid by the amino acid requirement for maintenance, expressed as protein metabolic weight of the bird. The intakes corrected for maintenance were calculated as follows:
icLys = iLys - mLys×BPm0.73×u
icMet+Cys = iMet+Cys - mMet+Cys ×BPm0.73×u
icThr = iThr - mThr ×BPm0.73×u
where:
BPm is the protein weight at maturity; BPm0.73
is the protein metabolic weight; uis the degree of
maturity of the protein weight, derived from the
relationship BP BPm-1. For the calculations were
considered, respectively, the values of 152 (SIQUEIRA et al., 2011), 87.3 and 75.6 mg
BPm0.73×u (BONATO et al., 2011) as the
requirements for maintenance of Lys (mLys), Met+Cys (mMet+Cys) and Thr (mThr).
The requirements of Lys (rLys), Met+Cys (rMet+Cys) and Thr (rThr) per kg of weight gain
(WG, kg day-1) were daily estimated from the
equations:
rLys = [dLys/kLys]/WG
rMet+Cys = [dMet+Cys/kMet+Cys]/WG rThr = [dThr/kThr]/WG
where rLys, rMet+Cys and rThr correspond to the amounts (g) of these amino acids required for a gain of 1 kg body weight.
Results and discussion
The feed intake at maturity (Wm) of the brown
strains was 30% higher compared to white strains,
however, the rate (B) was 35% higher for white strains.
These parameters, together, indicate the increased physical intake capacity of the bird. In general, the parameters of the Gompertz function fitted to the growth of body weight (BW), showed similarity between the strains of the same category, brown or white. The differences between the strains were observed when comparing the parameters fitted for BP
and FP. The Wi, Wm and B parameters (Table 1)
indicated that the growth profiles of the four strains are specific, especially for the Hy-line White that showed only 70% body weight of the brown strains, and similar values of feather protein weight at maturity.
Table 1. Estimates of parameters that describe the growth of body weight (BW), the protein weight of feather-free body protein (BP), feather protein weight (FP) and feed intake (FI) for four genotypes of pullets.
Parameters Hisex Brown Hy-Line
Brown Hisex White
Hy-Line White Body weight (BW)
Wi 0.0274 0.0267 0.0296 0.0269
Wm 1.765 1.770 1.346 1.261
B 0.0238 0.0238 0.0241 0.0263
Feather-free body protein (BP)
Wi 0.0041 0.0040 0.0051 0.0040
Wm 0.329 0.365 0.253 0.284
B 0.0255 0.0261 0.0254 0.0276
Feather protein weight (FP)
Wi 0.0011 0.0016 0.0014 0.0014
Wm 0.144 0.155 0.119 0.144
B 0.0290 0.0271 0.0290 0.0277
Feed intake (FI)
Wi 0.003 0.003 0.002 0.003
Wm 0.078 0.080 0.059 0.055
B 0.0399 0.0378 0.0504 0.0545
Wi is the weight at birth or initial feed intake (kg); Wm is the weight or feed intake at maturity (kg), B is the maturity rate (day-1).
The difference in the physical composition is reflected in the chemical composition. The total amount deposited in body protein (BP+FP), in relation to the body weight, showed that at maturity
(Wm) the strains Hisex Brown, Hy-Line Brown, Hisex
White and Hy-Line White had average values of 270,
290, 280 and 340 g of protein kg-1 of body weight,
being that 70, 70, 68 and 66% corresponded to feather-free body protein and the other 30, 30, 32 and 34% to the protein of the feathers, respectively.
The Wm and B parameters fitted for BP and
FP determine the daily amount of protein deposited by the strains. Due to the differences
between the values of B for BP and FP, the
protein deposition in each component has to be calculated separately, since the maximum protein deposition in the feather-free body and in feathers occur in different ages.
Considering the average value of the four strains
and FP (Wi = 0.001 kg, Wm = 0.141 and B = 0.028) the maximum protein deposition in feathers calculated
(ln[-ln(Wi/Wm)]/B) occurs approximately one week
earlier from the maximum deposition of the feather-free body and at this moment the bird should receive specific quantities of the amino acids to synthesize the protein profile demanded. The results obtained for feed intake indicated that the maximum body growth rate occurs 29 days after the maximum rate of feed intake, which is around 26 days old.
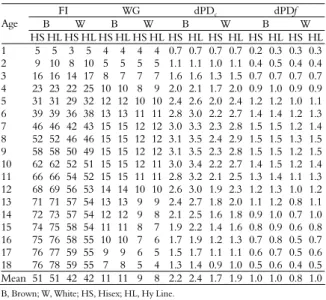
In order to use the procedure, it is necessary information about the protein deposition and feed intake, which can be obtained based on the parameters of the Gompertz function. These information were generated daily and the weekly average feed intake, weight gain, protein deposition in the feather-free body and in feathers from 1 to 18 weeks of age are presented in Table 2.
Based on this procedure is possible to verify that the parameters of the Gompertz function for BP, FP and FI can be interpreted with practical nutritional implications. The protein deposition and feed intake listed in Table 2 were used to calculate amino acid intake and amino acid deposition, and estimate thus the efficiency of utilization and the requirement per kg of weight gain of birds.
Table 2.Estimation of feed intake (FI, g day-1
), weight gain (WG, g day-1), protein deposition in the feather-free body (dPDc, g day-1) and
protein deposition in feathers (dPDf, g day-1) based on the equations
shown in Table 1 for the four genotypes of pullets.
FI WG dPDc dPDf
B W B W B W B W Age
HS HL HS HL HS HL HS HL HS HL HS HL HS HL HS HL
1 5 5 3 5 4 4 4 4 0.7 0.7 0.7 0.7 0.2 0.3 0.3 0.3
2 9 10 8 10 5 5 5 5 1.1 1.1 1.0 1.1 0.4 0.5 0.4 0.4
3 16 16 14 17 8 7 7 7 1.6 1.6 1.3 1.5 0.7 0.7 0.7 0.7
4 23 23 22 25 10 10 8 9 2.0 2.1 1.7 2.0 0.9 1.0 0.9 0.9
5 31 31 29 32 12 12 10 10 2.4 2.6 2.0 2.4 1.2 1.2 1.0 1.1
6 39 39 36 38 13 13 11 11 2.8 3.0 2.2 2.7 1.4 1.4 1.2 1.3
7 46 46 42 43 15 15 12 12 3.0 3.3 2.3 2.8 1.5 1.5 1.2 1.4
8 52 52 46 46 15 15 12 12 3.1 3.5 2.4 2.9 1.5 1.5 1.3 1.5
9 58 58 50 49 15 15 12 12 3.1 3.5 2.3 2.8 1.5 1.5 1.2 1.5
10 62 62 52 51 15 15 12 11 3.0 3.4 2.2 2.7 1.4 1.5 1.2 1.4
11 66 66 54 52 15 15 11 11 2.8 3.2 2.1 2.5 1.3 1.4 1.1 1.3
12 68 69 56 53 14 14 10 10 2.6 3.0 1.9 2.3 1.2 1.3 1.0 1.2
13 71 71 57 54 13 13 9 9 2.4 2.7 1.8 2.0 1.1 1.2 0.8 1.1
14 72 73 57 54 12 12 9 8 2.1 2.5 1.6 1.8 0.9 1.0 0.7 1.0
15 74 75 58 54 11 11 8 7 1.9 2.2 1.4 1.6 0.8 0.9 0.6 0.8
16 75 76 58 55 10 10 7 6 1.7 1.9 1.2 1.3 0.7 0.8 0.5 0.7
17 76 77 59 55 9 9 6 5 1.5 1.7 1.1 1.1 0.6 0.7 0.5 0.6
18 76 78 59 55 7 8 5 4 1.3 1.4 0.9 1.0 0.5 0.6 0.4 0.5
Mean 51 51 42 42 11 11 9 8 2.2 2.4 1.7 1.9 1.0 1.0 0.8 1.0
B, Brown; W, White; HS, Hisex; HL, Hy Line.
The results for Lys, Met+Cys and Thr are shown in Tables 3, 4 and 5. In general, the weekly average results for Lys, Met+Cys and Thr demonstrated that the intake in the first week of life was lower in relation to its body content, providing values of efficiency greater than 1 or 100%.
Table 3. Intake (iLys, mg bird-1), deposition (dLys mg bird-1),
efficiency of utilization (kLys, %) and lysine requirement (rLys, g kg-1 gain) for the four genotypes of pullets.
iLys dLys kLys rLys
Age B W B W B W B W
HS HL HS HL HS HL HS HL HS HL HS HL HS HL HS HL 1 47 53 35 48 60 55 55 54 128 105 166 117 13 15 10 13 2 93 100 80 104 93 91 82 88 101 92 105 86 17 18 16 19 3 157 162 145 176 131 133 112 126 85 83 79 72 21 21 21 24 4 232 235 220 253 170 177 141 164 74 76 65 66 24 24 26 28 5 312 313 296 324 205 218 166 198 66 70 57 62 26 27 30 31 6 391 390 365 384 232 252 185 223 60 66 51 59 29 29 33 33 7 375 373 339 347 250 276 196 238 68 75 59 70 25 25 29 28 8 426 425 376 376 258 288 200 242 62 69 55 66 27 27 31 30 9 470 469 404 397 258 289 197 238 57 64 50 62 30 29 33 32 10 506 507 426 412 250 282 189 227 51 58 46 58 32 32 36 35 11 535 537 441 422 236 268 178 211 46 52 42 53 35 35 38 38 12 558 562 452 430 218 249 163 191 41 47 38 48 38 38 42 42 13 471 476 411 388 199 227 148 171 45 51 39 48 34 34 41 41 14 483 489 416 391 178 204 132 151 40 45 34 42 38 38 45 47 15 492 499 420 393 158 180 117 131 35 40 30 37 42 42 51 53 16 498 507 422 395 139 158 102 113 30 34 27 32 48 48 57 61 17 504 513 424 396 121 138 89 97 26 30 23 28 54 54 64 70 18 508 518 426 397 104 119 77 82 23 26 20 24 61 62 73 81 Mean 392 396 339 335 181 200 141 164 58 60 55 57 33 33 38 39
B, Brown; W, White; HS, Hisex; HL, Hy Line.
Some authors recommend an efficiency of amino acid utilization for birds around 80% (MARTIN et al., 1994). Based on this, the average efficiency of utilization of Lys and Thr of the four genotypes was normalized (80%) in the third week of age. The results for Met+Cys showed that dietary limitation for these amino acids persisted until the sixth week of age, when the average efficiency of utilization of the four genotypes reached 80%. In this approach, the experimental diet was formulated to contain ccLys, ccMet+Cys and ccThr close to a practical diet and this positive because it allows an approximation to the actual conditions of raising (ZELENKA et al., 2011).
Table 4. Intake (iMet+Cys, mg bird-1), deposition (dMet+Cys, mg
bird-1), efficiency of utilization (kMet+Cys, %) and
methionine+cystine requirement (rMet+Cys, g kg-1 of gain) for four
genotypes of pullets.
iMet+Cys dMet+Cys kMet+Cys rMet+Cys
Age B W B W B W B W
HS HL HS HL HS HL HS HL HS HL HS HL HS HL HS HL 1 30 34 22 30 45 46 44 44 152 138 211 149 8 9 6 8 2 59 63 51 66 74 76 69 72 126 121 140 112 11 12 10 12 3 99 102 91 111 108 112 98 106 110 110 108 96 13 14 13 15 4 146 148 139 160 144 149 126 140 99 102 91 89 15 15 16 18 5 197 197 187 205 177 184 150 171 91 94 81 84 17 17 19 19 6 247 246 230 243 203 213 168 195 83 88 74 81 18 18 21 21 7 264 263 236 241 220 232 178 210 85 90 77 89 18 18 20 20 8 301 300 261 261 227 242 181 215 77 82 71 85 19 19 21 21 9 332 331 281 275 226 243 178 213 70 75 65 80 21 21 23 22 10 357 358 295 286 217 236 169 203 63 68 59 74 23 23 25 24 11 378 379 306 293 204 223 157 190 56 61 53 68 25 25 27 27 12 394 397 314 298 187 206 143 173 49 54 48 61 27 27 29 29 13 356 360 286 270 168 187 128 155 50 55 47 62 26 26 29 29 14 365 369 289 272 149 167 113 137 43 48 42 54 29 29 32 33 15 371 377 292 273 131 148 99 119 38 42 36 48 33 33 36 37 16 377 383 293 274 114 129 85 103 32 36 31 41 37 37 40 43 17 381 387 295 275 98 112 73 88 28 31 27 35 42 42 45 50 18 384 391 296 276 84 96 63 75 24 27 23 30 47 48 52 58 Mean 280 283 231 228 154 167 123 145 71 73 71 74 24 24 26 27
Table 5. Intake (iThr, mg bird-1), deposition (dThr, mg bird-1),
efficiency of utilization (kThr, %) and threonine requirement (rThr, g kg-1 of gain) for the four genotypes of pullets.
iThr dThr kThr rThr B W B W B W B W Age
HS HL HS HL HS HL HS HL HS HL HS HL HS HL HS HL
1 33 37 24 34 41 41 40 39 127 110 171 120 9 10 7 9
2 65 70 56 73 67 67 61 64 103 97 111 90 12 13 11 13
3 110 113 102 123 96 99 85 94 88 87 85 76 14 15 15 17 4 162 164 154 177 127 132 108 123 79 80 71 70 17 17 18 20 5 219 219 207 227 154 162 129 149 71 75 63 66 19 19 21 22 6 274 273 255 269 176 187 144 169 65 69 57 63 20 20 23 23 7 257 256 251 256 190 205 152 181 75 81 62 72 17 17 21 21 8 292 291 278 277 197 213 155 185 69 75 57 68 19 19 23 22 9 322 322 299 293 196 214 152 183 62 68 52 64 20 20 25 24 10 347 347 314 304 189 208 145 175 56 62 47 59 22 22 27 26 11 367 368 326 312 178 197 136 162 50 55 43 54 24 24 29 29 12 382 385 334 317 164 183 124 148 44 49 38 49 27 27 32 32 13 371 375 297 281 148 166 111 133 42 46 39 50 28 28 30 31 14 380 385 301 283 132 149 99 117 36 41 35 44 31 31 34 35 15 387 393 304 285 116 132 87 102 32 36 30 38 34 35 38 40 16 392 399 306 286 101 116 76 88 27 31 26 33 39 39 42 45 17 396 404 307 287 88 100 65 75 24 26 23 29 44 44 48 53 18 400 407 308 287 75 86 56 64 20 23 19 24 50 50 55 61 Mean 286 289 246 243 135 148 107 125 59 62 57 59 25 25 28 29
B, Brown; W, White; HS, Hisex; HL, Hy Line.
This methodology is interesting for diagnosing the effectiveness of nutritional management. The simulation performed considering the practical conditions of the study, which used three feeding programs (initial phase 0-6 weeks; breeding 7-12 weeks and rearing 13-18 weeks old) and diets with dietary concentrations of Lys, Met+Cys and Thr established based on the average age of each phase, showed that there was a restricted supply of these amino acids and, inevitably, this period provided a limitation in the maximum potential expression of protein deposition by the bird.
According to the results of the efficiency of amino acids utilization obtained by this procedure, the first three weeks of life must be considered separately from the feeding program to avoid restriction of supply of the major limiting amino acids (Met+Cys, Lys and Thr).
Another finding is the low efficiency of amino
acid utilization the from the 10th week of age,
especially for the last phase, from 13 to 18 weeks, indicating the excessive supply for the three amino acids studied. The low efficiency in the final weeks of the growth phase may be related to a combination of the excess of amino acids in the moment at which the potential for protein deposition of the bird substantially is reduced. Moreover, according to Silva et al. (2013) the maintenance requirement at this phase took the higher proportion in relation to the other phases. By setting the feed intake value of the present study, it is possible to suggest that the concentrations of dietary Lys, Met + Cys and Thr may be reduced.
The results obtained evidenced that the efficiencies varied between the genotypes. Considering the three amino acids, the major differences in the efficiency of utilization were observed between the brown and white strains. Furthermore, the values were higher for the brown strains, indicating that dietary levels (ccLys, ccMet + Cys and ccThr) were more suited to the growth of these birds compared to the white strains that were, on average, 10% less efficient in the use of dietary amino acids.
Information about the individual utilization of amino acids are scarce in the literature. To compare the efficiency of utilization of Lys, Met + Cys and Thr of the present study, the values above 80% obtained in the first weeks of age were overlooked. Thus, the efficiencies were 49, 57 and 51% for Lys, Met+Cys and Thr respectively. Similar results for efficiency were found by Zelenka et al. (2011) for Lys (49%), Met+Cys (52%) and Thr (45%) using a similar procedure to that applied in the present study for slow-growing broilers.
Some authors advocate that the efficiency of utilization should be obtained with increasing levels of the studied amino acid in the diet to obtain a well-defined response curve, and thus regress the responses of deposition to the amino acid intake (BAKER, 1986). Therefore, the present procedure can be applied to determine the efficacy of the nutritional management by relating the growth curve of the bird with its intake curve.
The daily requirement (r, mg bird-1×day) for
growth was obtained considering the division of the deposition by the efficiency of amino acid and, to make it dynamic, its value was related to
the kg weight gain of the bird (a, mg kg-1). In this
way, nutritionists may associate this requirement
to a maintenance coefficient (b, g kg-1) and
calculate the requirement for any bird by the factorial method from the desirable weight gain (WG) and body weight (BW):
r =a×WG+b×BW.
In this approach, the calculated requirement is related to the potential for protein deposition, so, the higher the protein deposition the higher the requirement. The total required by the bird and the increase rate of requirement are correlated with the
growth parameters Wm and B of the Gompertz
However, by changing the basis of
requirement from g bird-1 to g kg-1 promotes a
dilution of the requirement by the total weight gain, especially for birds of the brown strain.
Therefore, the overall mean requirement (g kg-1)
of rLys, rMet+Cys and rThr were higher for the white strain, once their weight gain is lower.
It is observed that within each phase, rLys (Table 3), rMet+Cys (Table 4) and rThr (Table 5) tend to increase. When the diet was changed to adjust the levels of dietary amino acids (ccLys, ccMet + Cys and ccThr) to the next phase, the efficiency of utilization at this time increased and then decreased by repeating the same pattern.
The results obtained showed high values for rLys (Table 3), rMet + Cys (Table 4) and rThr (Table 5) particularly during the phase from the
13rd to 18th weeks of age. The maximum,
minimum and average values were, for rLys: 81, 35 and 8; for rMet+Cys: 58, 25 and 5 and for rThr: 61, 26 and 6 g of the amino acid per kg weight gain, respectively. The presented values for rLys, rMet+Cys and rThr are in agreement with the efficiency of utilization and reflect the nutritional management used, indicating that adjustments can be made to improve the utilization of the amino acids of the diet. The requirements were recalculated considering a constant efficiency for all ages (Table 6). The requirement adjusted of Lys (radjLys), Met+Cys (radjMet+Cys) and Thr (radjThr) for 80% efficiency were 25, 21 and 17 for radjLys; 23, 18 and 14 for radjMet+Cys and 19, 16 and 13 for radjThr, respectively. By adjusting the efficiency of utilization, the values are in agreement with the literature. For Lys, Rostagno et al. (2011) considered that the requirement is 20 g of Lys per kg weight gain for growing pullets. Applying the relationship Met+Cys:Lys and Thr:Lys of Rostagno et al. (2011), for the coefficient of 20 g
of Lys kg-1 weight gain of Rostagno et al. (2011), it
is obtained an average requirement of 15.7 g of Met+Cys and 13.6 g of Thr per kg weight gain, respectively. The values of Met+Cys and Thr obtained by Rostagno et al. (2011) were 12.7 and 15 %, lower than those found in the present study, considering the efficiency of utilization of 80 % for both amino acids.
Besides that, Nascimento et al. (2009a) found values of 21.6 g of Lys per kg body weight for female slow-growing broilers (ISA Label Ja57). These values
were similar to the values found in the simulation presented in Table 6.
Table 6. Adjusted lysine requirement (radjLys, g kg-1 of gain),
methionine + cystine (radjMet+Cys, g kg-1 of gain) and
threonine (radjThr, g kg-1 of gain) to 80% of efficiency of amino
acid utilization and the ideal ratio amino acid:lysine for methionine+cystine (Met+Cys Lys-1) and threonine (Thr Lys-1).
radjLys radjMet+ Cys radjThr Cys LysMet+ -1 Thr Lys-1
B W B W B W B W B W Age
H S
H L
H S
H L
H S
H L
H S
H L
H S
H L
H S
H L
H S
H L
H S
H L
H S
H L
H S
H L 1 21 19 19 19 15 16 16 15 14 14 14 14 75 83 80 81 70 74 72 21 2 21 21 20 20 17 18 17 17 15 15 15 15 79 84 84 82 72 74 74 21 3 22 22 21 22 18 19 18 18 16 16 16 16 82 84 87 84 73 74 76 22 4 22 23 21 23 19 19 19 19 16 17 16 17 85 84 89 85 75 74 77 22 5 22 23 21 24 19 20 19 20 17 17 16 18 86 84 90 86 75 74 77 22 6 22 24 21 24 19 20 19 21 17 18 16 18 87 84 91 87 76 74 78 22 7 22 24 21 25 19 20 19 22 16 18 16 19 88 84 91 88 76 74 78 22 8 21 24 21 25 19 20 19 22 16 18 16 19 88 84 91 89 76 74 77 21 9 21 23 21 25 18 20 19 22 16 17 16 19 88 84 90 89 76 74 77 21 10 20 23 21 25 18 19 18 22 15 17 16 19 87 84 89 90 76 74 77 20 11 20 23 20 25 17 19 18 23 15 17 15 19 86 83 88 90 75 74 76 20 12 20 22 20 25 17 18 17 23 15 16 15 19 86 83 87 90 75 74 76 20 13 19 22 20 25 16 18 17 22 14 16 15 19 85 83 86 91 75 73 75 19 14 19 21 19 25 16 18 17 22 14 16 15 19 84 82 85 91 74 73 75 19 15 18 21 19 24 15 17 16 22 14 15 14 19 83 82 84 91 74 73 74 18 16 18 21 19 24 15 17 16 22 13 15 14 19 82 82 83 91 73 73 74 18 17 18 20 19 24 14 16 15 22 13 15 14 19 81 81 82 91 73 73 73 18 18 17 20 18 24 14 16 15 22 13 14 13 19 80 81 82 91 72 73 73 17 Mean Lin 20 22 20 24 17 18 17 21 15 16 15 18 84 83 87 88 74 74 76 20
Mean AA 21 18 16 86 75
B, Brown; W, White; HS, Hisex; HL, Hy Line; Lin, lineage; AA, amino acid.
The ideal ratio Met+Cys: Lys in this study ranged from 75 to 91 %. These values were close to those found for females by Silva Junior et al. (2006) and Nascimento et al. (2009b) with female slow-growing broilers, which obtained values from 77 to 82 %, respectively. For the ratio Thr: Lys, the results were similar to those registered in recent studies (BERNARDINO et al., 2011; DUARTE et al., 2012). Thus, the methodology employed shown to be applicable to assess the efficiency of amino acid utilization, since it allowed obtaining results that were supported by recent findings in the literature. Moreover, it can be a useful tool to diagnose the effectiveness of nutritional management, aiding in decision-making on the nutritional management.
Conclusion
The procedure based on the Gompertz function to determine the efficiency of amino acid utilization proved to be suitable for evaluating the efficiency of amino acid utilization and can be a useful tool to diagnose the effectiveness of nutritional management, aiding in decision-making on the nutritional management.
Acknowledgements
References
AOAC-Association of Official Analytical Chemists.
Official methods of analysis of AOAC international. 17th ed. Washington, D.C.: AOAC, 2002.
BAKER, D. H. Problems and pitfalls in animal experiments designed to establish dietary requirements for essential nutrients. The Journal of Nutrition, v. 116, n. 12, p. 2339-2349, 1986.
BERNARDINO, V. M. P.; ALBINO, L. F. T.; ROSTAGNO, H. S.; OLIVEIRA, M. G. D. A.; MENDES, F. Q.; PEREIRA, C. M. C.; FERREIRA, I. M.; MAIA, R. C. Efeito de diferentes relações treonina: lisina digestíveis, suplementadas ou não com glicina, sobre a atividade enzimática em pintos de corte. Revista Brasileira de Zootecnia, v. 40, n. 12, p. 2732-2738, 2011.
BONATO, M. A.; SAKOMURA, N. K.; SIQUEIRA, J. C.; FERNANDES, J. B. K.; GOUS, R. M. Maintenance requirements for methionine and cysteine, and threonine for poultry. South African Journal of Animal Science, v. 41, n. 3, p. 209-222, 2011.
DUARTE, K. F.; JUNQUEIRA, O. M.; FILARDI, R. S.; SIQUEIRA, J. C.; GARCIA, E. A.; LAURENTIZ, A. C. Exigências em treonina para frangos de corte de 22 a 42 dias de idade. Revista Brasileira de Zootecnia, v. 41, n. 1, p. 72-79, 2012.
EMMANS, G. C. The growth of turkeys. In: NIXEY, C.; GREY, T. C. (Ed.). Recent advances in turkey science. London: Butterworths, 1989. p. 135-166.
GOMPERTZ, B. On the nature of the function expressive of the law of human mortality, and on a new mode of determining the value of life contingencie.
Philosophical Transactions of the Royal Society of London, v. 115, n. 1, p. 513-583, 1825.
GOUS, R. M.; MORAN JR., E. T.; STILBORN, H. R.; BRADFORD, G. D.; EMMANS, G. C. Evaluation of the parameters needed to describe the overall growth, the chemical growth, and the growth of feathers and breast muscles of broilers. Poultry Science, v. 78, n. 6, p. 812-821, 1999.
MARTIN, P. A.; BRADFORD, G. D.; GOUS, R. M. A formal method of determining the dietary amino acid requirements of laying‐type pullets during their growing period. British Poultry Science, v. 35, n. 5, p. 709-724, 1994.
NASCIMENTO, D. C. N.; SAKOMURA, N. K.; SIQUEIRA, J. C.; DOURADO, L. R. B.; FERNANDES, J. B. K.; MALHEIROS, E. B. Exigências de lisina digestível para aves de corte da linhagem ISA Label criadas em semiconfinamento. Arquivo Brasileiro de Medicina Veterinária e Zootecnia, v. 61, n. 5, p. 1128-1138, 2009a.
NASCIMENTO, D. C. N.; SAKOMURA, N. K.; SIQUEIRA, J. C.; PINHEIRO, S. R. F.; FERNANDES, J. B. K.; FURLAN, R. L. Exigências de metionina + cistina digestível para aves de corte ISA Label criadas em semiconfinamento. Revista Brasileira de Zootecnia, v. 38, n. 5, p. 869-878, 2009b.
RIVERA-TORRES, V.; NOBLET, J.; VAN MILGEN, I. J. Changes in chemical composition in male turkeys during growth. Poultry Science, v. 90, n. 1, p. 68-74, 2011.
ROSTAGNO, H. S.; ALBINO, L. F. T.; DONZELE, J. L.; GOMES, P. C.; FERREIRA, A. S.; OLIVEIRA, R. F.; LOPES, D. C. Tabelas brasileiras para aves e suínos: composição de alimentos e exigências nutricionais. Viçosa: UFV, 2000.
ROSTAGNO, H. S.; ALBINO, L. F. T.; DONZELE, J. L.; GOMES, P. C.; OLIVEIRA, R. F.; LOPES, D. C.; FERREIRA, A. S.; BARRETO, S. L. T.; EUCLIDES, R. F.
Tabelas brasileiras para aves e suínos: composição de alimentos e exigências nutricionais. 3. ed. Viçosa: UFV, 2011. SILVA, E. P.; SAKOMURA, N. K.; ARAUJO, J. A.; HAUSCHILD, L.; MALHEIROS, E. B.; DORIGAM, J. C. P. Descrição do potencial de retenção de nitrogênio em frangas de postura por diferentes metodologias: máxima deposição e estimativas da ingestão de metionina+cistina.
Ciência Rural, v. 35, n. 11. p. 2070-2077, 2013.
SILVA JUNIOR, R. G. C.; LANA, G. R. Q.; RABELLO, C. B. V.; LANA, S. R. V.; BARBOZA, W. A.; Exigências de metionina + cistina para frangos de corte fêmeas de 1 a 21 e de 22 a 42 dias de idade criados em região de clima tropical. Revista Brasileira de Zootecnia, v. 35, n. 2, p. 497-503, 2006.
SIQUEIRA, J. C.; SAKOMURA, N. K.; ROSTAGNO, H. S.; BONATO, M. A.; PINHEIRO, S. R. F.; NASCIMENTO, D. C. N. Exigência de lisina para mantença determinada com galos de diferentes genótipos.
Revista Brasileira de Zootecnia, v. 40, n. 4, p. 812-820, 2011.
ZELENKA, J.; HEGER, J.; KRÁČMAR, S.; MRKVICOVÁ, E. Allometric growth of protein, amino acids, fat and minerals in slow- and fast-growing young chickens. Czech Journal of Animal Science, v. 56, n. 3, p. 127-135, 2011.
Received on September 27, 2013. Accepted on January 27, 2014.