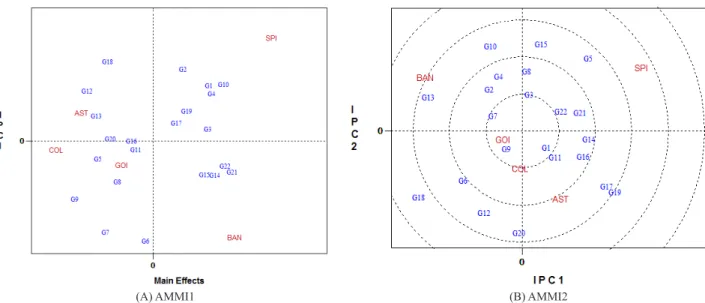
Evaluation of sugarcane genotypes and production environments in Paraná by GGE biplot and AMMI analysis
Texto
Imagem


Documentos relacionados
Ousasse apontar algumas hipóteses para a solução desse problema público a partir do exposto dos autores usados como base para fundamentação teórica, da análise dos dados
The probability of attending school four our group of interest in this region increased by 6.5 percentage points after the expansion of the Bolsa Família program in 2007 and
Power demand of the mixer’s drive reveals the mixer’s operating characteristics and reliable monitoring of the mixing processes involving the evaluation of power consumption
At the first stage of the measurements results analysis, the gear wheel cast surface image was compared with the casting mould 3D-CAD model (fig.. Next, the measurements results
social assistance. The protection of jobs within some enterprises, cooperatives, forms of economical associations, constitute an efficient social policy, totally different from
Abstract: As in ancient architecture of Greece and Rome there was an interconnection between picturesque and monumental forms of arts, in antique period in the architecture
We also determined the critical strain rate (CSR), understood as the tangent of the inclination angle between the tangent to the crack development curve and the crack development
The iterative methods: Jacobi, Gauss-Seidel and SOR methods were incorporated into the acceleration scheme (Chebyshev extrapolation, Residual smoothing, Accelerated