Changes in wine perception induced by food:
influence of physiological and psychological factors
Chrysi Manataki
Dissertation to obtain the degree of
European Master of Science in Viticulture and Enology
Advisor: Manuel
José de Carvalho Pimenta
Malfeito Ferreira
Assistant: Mariana da Silva Gomes Mota
Jury:
President:Jorge Manuel Rodrigues Ricardo da Silva (Phd), Full Professor, at Instituto Superior de Agronomia, Universidade de Lisboa
Members: - Alain Razungles (Phd), Professor at Montpellier SupAgro;
- Manuel José de Carvalho Pimenta Malfeito Ferreira (Phd), Assistant Professor, with aggregation at Instituto Superior de Agronomia, Universidade de Lisboa;
- Sofia Cristina Gomes Catarino (Phd), Invited Assistant Professor at Instituto Superior de Agronomia, Universidade de Lisboa.
1
Napa Valley
CABERNET SAUVIGNON
“
Wine has been with us since the beginning of
civilization. It is the temperate, civilized, sacred,
romantic, mealtime, beverage recommended in
the Bible. Wine has been praised for centuries
by statesmen, philosophers, poets & scholars.
Wine in moderation is an integral part of our
culture, heritage and the gracious way of life.”
Taken from Fuller (1996).
2
ACKNOWLEDGEMENTS
This page is dedicated to all the people that contributed to the completion of my work, among the last academic year.
I would first like to express my deepest gratitude to my thesis advisor, Professor Manuel Malfeito Ferreira, of ISA. The door of his office was always open for any kind of questions about my research, or any help I would need to ask. I have enriched my knowledge in many aspects since I started working with Prof. Malfeito and feel grateful every day for the broadening of my horizons, not only in terms of scientific wine knowledge, but also as an upcoming member of the international wine business and society in general.
Furthermore, I would like to thank Doctor Mariana Mota of ISA, for her precious help among statistics analysis and general guiding, her endless patience and always friendly and kind approaches towards her students. A hardworking individual, whose academic achievements I am certain, will keep increasing.
To Prof. Alain Razungles, from Montpellier SupAgro, who accepted directly to be a co-tutor of my project, and was kindly replying to my questions from time to time.
Additionaly, I feel the great necessity to express my most sincere thanks to Professors: Jorge Ricardo da Silva, Sofia Catarino and Carlos Lopes of ISA, for providing me with the deepest knowledge.
My deepest thanks to the winery Alexakis in Heraklion city of Crete, and especially to the owner and winemaker Apostolos Alexakis for his generous offer and shipping of the fascinating wines used for the tasting sessions.
To all the people that consisted our tasting panel and showed the greatest patience, as they understand the hard task of a student accomplishing a master thesis.
To all my closest friends in Lisbon and Greece, that helped me during all these months, supporting all the steps of my work and being present always when necessary. Last but certainly not the least important, I owe the deepest thanks to my family, my parents Pavlos and Kaiti, my elder brothers Giwrgos and Nikos and all the relatives, for the greatest encouragement throughout this new part of my “international” lifestyle as well as their financial support, for their sacrifices and patience among all this 2-year “journey”.
3
ABSTRACT
The present work assessed the effect of food on wine preference. Four commercial Greek and Portuguese wines, two reds and two whites, with different sensorial features were used. An additional objective was to evaluate the intensity and liking of acidity, astringency and moderate sweetness in white wine, using as tastants tartaric acid, tannic acid and sucrose. The tastings were performed by a trained panel of 28 individuals, segmented by gender, smoking habits, Vinotype, sensitivity to 6-n-propylthiouracil (PROP), saliva flow rate, sweet liking and wine “neophobia” responses. Secondary segments (such as smell sensitivity and tastant liking) were also created during the training process.
The sensitivity and appreciation of the tastants enabled to separate the tasters in two segments, one with high response to the stimulus and another with low. The variation of individual sensitivities followed a normal distribution for tartaric acid and sucrose, contrarily to tannic acid. Concerning the relation between sensitivity to the tastant and the respective hedonic evaluation, there were no correlations (│r│< 0.3), indicating that hedonic appreciation was apparently not influenced by sensitivity to the tested tastants.
Concerning food pairing, there was a tendency to decreasing preference for white wines after food consumption, in comparison to that of reds, which tended to increase after pairing. However, when statistically analyzed, the wine ranking did not evidence significant differences and so, all wines performed equally well on pairing with food. This observation may be explained by the cancellation of the different individual preferences when the overall response of the panel was considered. The outcome from the segments sweet liking, smell sensitivity and “neophobia” showed that wine preference could only be related with “neophobia” and not with any physiological or liking factor.
In summary, hedonic appreciation seems to be more connected to our cultural and psychological background and these features should be taken into account to understand the individual wine choices.
4
RESUMO
O presente trabalho avaliou o efeito da comida sobre a preferência do vinho. Foram utilizados quatro vinhos comerciais, dois tintos e dois brancos, com diferentes características sensoriais. Um objetivo adicional foi avaliar a intensidade e o gosto da acidez, adstringência e doçura moderada no vinho branco, utilizando ácido tartárico, ácido tânico e sacarose. As provas foram realizadas por um painel treinado de 28 indivíduos, segmentado por sexo, hábitos de tabagismo, “Vinotype”, sensibilidade ao 6-n-propiltiouracilo (PROP), fluxo de saliva, gosto doce e respostas de “neofobia”. Segmentos secundários (como sensibilidade ao cheiro e ao gosto) também foram criados durante o processo de treino.
A sensibilidade e a apreciação dos sabores permitiram separar os provadores em dois segmentos, um com alta resposta ao estímulo e outro com baixo. As maiores variações individuais foram encontradas no ácido tânico, enquanto com ácido tartárico e sacarose houve uma evolução de pontuação mais homogénea. Quanto à relação entre a sensibilidade ao sabor e a respectiva avaliação hedónica, todas as correlações foram fracas, indicando que a valorização hedónica não foi determinada pela sensibilidade aos sabores testados e, se houver, as respostas sensoriais apenas contribuíram marginalmente para as respostas aos gostos.
No que diz respeito à relação com a comida, a preferência pelos vinhos brancos diminuiu após o consumo de alimentos, em comparação com os tintos, que aumentaram após o emparelhamento. No entanto, quando analisados estatisticamente, o ranking dos vinhos não apresentou diferenças significativas. Isso ocorreu porque as diferentes direções de preferências individuais cancelavam a resposta geral do painel. Os resultados do gosto pelo doce, sensibilidade ao cheiro e "neophobia" mostrou que a preferência do vinho só poderia estar relacionada com a "neophobia" e com nenhum outro fator fisiológico.
Em resumo, a apreciação hedônica parece estar mais relacionada com o contexto cultural e psicológico e essas características devem ser levadas em consideração para entender as escolhas individuais do vinho.
Palavras-chave: vinhos, vinhos e comida, ligação com a comida, segmentos, neophobia.
5
RESUMO ALARGADO
O objetivo do presente trabalho foi avaliar o efeito da comida na preferência vinho, enfatizando as respostas de indivíduos treinados, antes e após o consumo de alimentos. Foram usados quatro vinhos comerciais, internacionais, tintos e brancos, com diferentes características sensoriais. A selecção de vinhos gregos e portugueses visava observar comportamento dos provadores para vinhos com origem diferente. Um objectivo adicional foi avaliar em termos de intensidade e apreciação hedónica as sensações de acidez, adstringência e doçura moderada em vinho branco da variedade Macabeo, usando soluções de ácido tartárico, ácido tânico e sacarose.
As provas foram realizadas por um painel treinado de 28 indivíduos, segmentados por sexo, hábitos tabágicos, teste Vinotype, sensibilidade para o 6-n-Propiltiouracil (PROP), fluxo de saliva, preferência pelo doce e “neophobia”. Foram criados segmentos adicionais durante o processo de prova. Tais categorias foram: grau de sensibilidade ao cheiro e grau de sensibilidade às sensações de boca.
Em relação às sensações de boca dividimos os provadores em dois segmentos, um com alta resposta ao estímulo e outro com baixa. A maior variação de sensibilidade foi observada em relação ao ácido tânico. A respeito do ácido tartárico e da sacarose, notámos uma distribuição de pontuação mais homogénea. Na medida em que a relação entre a sensibilidade para o estímulo e a respectiva avaliação hedónica, foi fraca, as respostas sensoriais apenas devem contribuir ligeiramente para a apreciação do vinho. Este facto levou a procurar novas segmentações, não com base nas respostas de intensidade, mas com base nas repostas de preferência pelos gostos.
Sobre a segmentação do consumidor com base nos resultados do gosto doce, os provadores foram divididos em dois segmentos, de acordo com um valor de corte arbitrário de 205 g/L. Os resultados obtidos levaram a incluir 20 dos provadores no segmento de “dislikers” e 8 em “likers”.
A capacidade de emparelhamento de comida foi avaliada com 4 vinhos comerciais (originários da Grécia e Portugal) vinhos através da criação de ordens de classificação (“rankings”). A preferência para os vinhos brancos diminuiu após o consumo de alimentos, em comparação com a dos tintos, que aumentou após o emparelhamento. Houve uma tendência para classificar em primeiro lugar os vinhos brancos antes de combiná-los com o prato. Após o consumo de comida, os vinhos tintos passaram para os primeiros lugares da classificação. No entanto, quando analisados estatisticamente, os “rankings” dos vinhos não ofereceram diferenças
6 significativas. Isto foi devido o fato de que as diferentes direcções das preferências individuais foram canceladas quando se considerou a resposta global do painel.
O resultado dos segmentos da sensibilidade de cheiro, gosto doce e "neophobia", mostrou que a preferência vinho só foi relacionada com a "neophobia" e não com qualquer outro fator fisiológico. A maioria dos entrevistados não pareceu disposta a experimentar estilos particulares de vinho, mostrando suas dúvidas e desconfiança entre diferentes formas de produção de vinho, ou até mesmo vinhos de diferentes culturas. Especificamente, 19 de 28 provadores foram classificados como "conservadores", enquanto apenas 9 foram caracterizados como "não-conservadores". Um resultado muito interessante, que poderia possivelmente ser usado para futuros estudos. Os resultados sugerem que os jovens actuais se sentem desconfortáveis em explorar diferentes estilos de vinhos, formas de produção e origens, e preferem os vinhos com que já estão familiarizados.
Em suma, quando se trata de vinho e comida, a apreciação hedónica parece estar mais ligada ao nosso fundo cultural, social e psicológico que molda a nossa maneira de experimentar estilos de vinhos desconhecidos. Estudos futuros de apreciação do vinho devem ser mais dirigidos sobre essas características pessoais, do que às capacidades de perceber e descrever as características sensoriais dos vinhos.
7
TABLE OF CONTENTS
List of figures 9 List of tables 10 List of appendix 11 List of abbreviations 12 1. Introduction 13 1.1. History of wine 13
1.2. Wine and Food Pairing 13
1.2.1. Key elements in Wine and Food Pairing 15
1.3. The impact of “Neophobia” in Wine Tasting 18
1.4. Taster Segmentation 19
1.4.1. Saliva Flow Rate 20
1.4.2. Taster Phenotype - PROP 20
1.4.3. Vinotype 21
1.4.4. Sweet Liking 22
1.5. Background and objectives of the study 23
2. Material and Methods 25
2.1. Participant selection 25
2.2. Training of the panel – Recognition of simple tastes and sensations 25
2.3. Taster Characterization 25
2.3.1. Vinotype 25
2.3.2. Determination of the taste phenotype 26
2.3.3. Saliva flow determination 27
2.3.4. Determination of sweet liking status 27
2.3.5. Smell sensitivity 27
2.3.6. Neophobia evaluation 28
2.3.7. Taste intensity determinations 28
2.4. Taste intensity and liking of water and wine spiked with several tastants 28
2.4.1. Wine analysis 28
2.4.2. Intensity evaluation 29
2.4.3. Hedonic evaluation 30
2.5. Influence of food on wine preference 31
2.5.1. Wine characteristics 31
2.5.2. Food recipe 32
8
2.6. Statistical analysis 35
3. Results and Discussion 37
3.1. Taster characterization 37
3.1.1. Questionnaire responses 37
3.1.2. Sensory responses 40
3.2. Sensory and hedonic evaluation of wine tastants 42
3.2.1. Distribution of intensity and liking scores 42
3.2.2. Relation between intensity and liking scores 43
3.2.3. Consumer segmentation based on liking of white wine spiked with tastants 44
3.2.4. Consumer segmentation based on sweet liking status 46
3.3. Evaluation of wines before and during food consumption 47
3.3.1. Friedman’s test evaluation 47
3.3.2. Pearson’s X2 test evaluation 48
3.3.3. Evaluation through the Spearman correlation coefficient 49
4. Conclusions and perspectives 51
References 53
External links 56
Annexes Annex 3.1.1. – Intensity and appreciation of sucrose results 60
Annex 3.1.2. – Intensity and appreciation of increased concentrations of sucrose results 61
Annex 3.2. – Intensity and appreciation of tartaric acid results 62
Annex 3.3. – Intensity and appreciation of tannic acid results 63
Annex 3.4. – Sweet liking results (Sucrose concentration 205 g/L) 64
Annex 3.5. – Geometric mean of the intensity and liking scores of each taster regarding white wine spiked with increasing concentrations of sugar, tartaric acid and tannic acid. 65
9
LIST OF FIGURES
Figure 1.1. - The Food and Wine Taste Pyramid (Harrington, 2008). 16
Figure 3.1. - Bitterness intensity elicited by increasing concentrations of PROP
(Segments before elimination of Supertasters). 40
Figure 3.2. - Bitterness intensity elicited by increasing concentrations of PROP
(Final panel division). 40
Figure 3.3. - Mean intensity (●) and liking (○) scores for white wine spiked with
increasing concentrations of sugar, tartaric acid and tannic acid. 42
Figure 3.4. - Distribution of the geometric mean of the intensity and liking scores given by tasters to white wine (Macabeu) spiked with increasing concentrations
of sugar, tartaric acid and tannic acid. 43
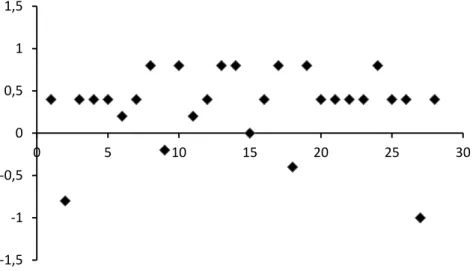
Figure 3.5. - Correlations between intensity and liking geometric mean scores to each tastant in white wine. Straight lines were obtained by linear regression. 44
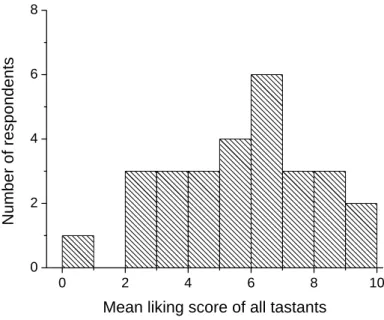
Figure 3.6. - Distribution of the mean liking scores obtained from the geometric mean of the individual liking score for white wine spiked with sugar, tartaric acid and tannic acid. 46
10
LIST OF TABLES
Table 1.1. - Traditional food and wine pairings (adapted from Puckette, 2015). 17
Table 1.2. - Past studies that focused on food and wine pairing aspects. 18
Table 1.3. - Categories of Vinotype personalization test (adapted from Hanni, 2013 & Borchgrevink and Sherwin, 2017). 22
Table 2.1. - Reagents and concentrations of aqueous solutions used in taste intensity determinations. 28
Table 2.2. - Analysis of ISA Macabeu 2016 wine. 29
Table 2.3 - Brand and technical characteristics of the wines used in food pairing. 31
Table 2.4 - Tasting sheet used in food pairing. 34
Table 3.1 - Number of tasters in each category. 37
Table 3.2. - Questions presented in the self-reported questionnaire about “Neophobia” and methodology of the answers. 38
Table 3.3. - Analytic scores to Question 3 and taster classification. 39
Table 3.4. - Taster segmentation according to the liking status of each tastant added to white wine (HL, high likers; LL, low likers). 45
Table 3.5. - Number of respondents in each segment of stimulus liking status (HL, high likers; LL, low likers). 46
Table 3.6. - Rank sums for each wine, obtained by the trained panel, before and after food pairing. 47
Table 3.7. - Probabilities, observed values and expected values for the trained panel. 48
11
LIST OF APPENDIX
Appendix I – Trained panel test complete information 57
Table Ι.1 – Demographic characterisation of the trained panel Table Ι.2 – Physiological, vinotype and neophobia characterisation of the trained panel
Appendix II – Commercial Wines Analysis 59 Appendix III – Tasting Sheets 67 Sheet III.1 – Demographic information – Saliva test
Sheet III.2 – Evaluation of Sensations Sheet IΙΙ.3 – PROP & NaCl evaluation
Sheet IΙΙ.4 – Intensity & Appreciation of tastants Sheet IΙΙ.5 – Sweet Liking
Sheet III.6 – Triangle test (Tastants used: Sucrose, Tartaric acid, Tannic acid) Sheet III.7 – Food pairing test (Ranking of wines) & Neophobia questionnaire
Appendix IV - Commercial wine tasting results obtained by the trained panel 77
12
LIST OF ABBREVIATIONS
Carbs – Carbohydrates FNS – Food Neophobia Scale Ftest – Friedman’s test
gLMS/LMS - Labeled Magnitude Scale gVAS/VAS – Visual Analogue Scale HL – High Likers
HSD – Honest Significant Difference ICC – Intraclass Correlation Coefficient ISA – Instituto Superior Agronomia LL – Low Likers mM – molar concentration PROP – 6-n-propylthiouracil PTC – phenylthiocarbamide RjT – Rejection Threshold r – correlation coefficient SD – Sweet Dislikers SL – Sweet Likers W1 – Hatiri, Alexakis W2 – Explicit, Alentejano W3 – Kariki, Alexakis
13
1. Introduction
1.1 History of Wine
Two thousand years ago, the Roman author, Pliny wrote:
“Even in the most favorable circumstances, the intoxicated never see the sunrise and so shorten their lives. This is the reason for pale faces, hanging jowls, sore eyes and trembling hands that spill the contents of full vessels; this is the reason for the swift retribution consisting of horrendous nightmares and for restless lust and pleasure in excess. The morning after, the breath reeks of the wine-jar and everything is forgotten – the memory is dead. This is why people call ‘enjoying life’; but while other men daily lose their yesterdays, these people also lose their tomorrows (Pliny the Elder, n.d./1991).
The history of wine finds its fundamental roots back to the inception of the world’s civilizations. The first archaeological proofs of wine production and consumption is orientated in countries such as China (Hames, 2010), Georgia (Keys, 2003), Iran (Berkowitz, 1996), Greece and Armenia (Tondo, 2017), between 7000 and 4100 B.C. Wine has been strictly bonded and described as a part of religion, since its archetypal basis and this is easily shown in the honoring celebrations of the Greeks, towards their favored and cherished God, Dionysus or else known as Bacchus, who has inspired philosophers, artists as well as the life of everyday people (All about Greek wine, 2010). Coming after, the Romans adopted wine in their regular daily habits, contributing by this way to the evolution of viticulture and oenology, as winemaking evolved into a great business.
Wine has evolved as part of life, culture and diet since time immemorial. One can easily understand and evaluate the worth of wine, by monitoring its several roles among societies, inherited from one generation to another and with the years passing by, wine was considered a significant part of daily diet and people begun to favor stronger, heavier wines. According to Charters (2006), it is perhaps, more than any other existing drink, a product which has a substantial symbolic significance that not only gives pleasure, but has gained crucial roles such as adaptation in the culinary and medical sector.
1.2 Wine and Food Pairing
14 Wine has always had a great, long history of being served as an embellishment to food. There is no doubt that every country which is known to have a “popular” food specialty, usually produces a specific wine which is aimed to accompany it (Johnson-Bell, 2012). Food and wine are tightly connected to each other in a cultural way. People combine these two elements in a daily basis, even using them as a communication tool.
According to Harrington (2008), historical events and happenings, as well as policies led by governments show a crucial influence on wine and food products. The cultural impact on food and wine trends is shown every day through a repeated and constant interplay and development of traditions, fashion and climate, which represent the overall gastronomic identity of a region. Differing cultures have developed different prospectives on the food-and-wine pairing process and its importance (Harrington, 2008). Perfect examples could be considered for instance, the general American attitude following the stereotype of “if it feels good, drink it”, the traditional French system of pairing commands a series of strict rules to follow etc. (Harrington, 2008). Food and wine matching may be approached from several potentials depending on one’s confidence in selecting wines, one’s state of mind at the moment, or even the objective of the gathering where the food and wine will be served (Harrington, 2008).
Wine itself, forms part of a “civilized life” and this is important for several reasons. According to Charters (2006), the first is that one of the major symbolic uses of wine is to communicate messages about the sophistication and culture of an individual or a community. The second is the idea that wine is the alcoholic drink of self-control, at least when compared with beer or other alcoholic beverages, has a long tradition (Charters, 2006), a fact that can be pointed out by the Greeks, who considered consumption of wine to be one thing that bounded them from the drunken barbarians around them (Crane, 2003). Third comes the fact that wine, probably more than any other drink, comes in diverse styles, can be made in distinctive ways and is the reflection of production of many countries and regions (Charters, 2006). Last but not least, wine’s significance as a part of civilized life can be pointed out by two more facts, one being the fact that it is actually a naturally produced drink – which it is, essentially, environmentally friendly and reflects nature in much higher level than it does with process and the other, that it is a form of art and expression as, many times stated, wine can be characterized as beautiful and gentle, because of the “aesthetic satisfaction” gained from it as an aesthetic object (Charters, 2006).
15 Wine is only appreciated in moderation (Wine in Moderation, 2013) and tasting is the introduction of wine to our senses: sight, smell and taste (Peynaud, 1997). But what exactly do we call “Taste”? For the senses of smell and taste are so closely linked that we always taste what we smell and vice versa, meaning that the two work in conjunction (Johnson-Bell, 2012). Apart from that, our sense of sight also aids our sense of taste and this can be supported by the slightest everyday-life example, when by first observing a piece of food, we are more or less aware of how it tastes (well cooked, burned, salty etc.). According to Johnson-Bell (2012), it is understandable that in the same way that different people have different strengths of eyesight or hearing, so people are also born with contrasting abilities in the areas of taste and smell, which can be quite influenced by our cultural and sensorial past. Many questions can rise from the facts mentioned above: To what extent do we differ in our perception of flavors and aromas, and is this variation in taste along a continuum?
Like the other senses, smell and taste serve as a source of information for our brains. Our sensorial logic then discriminates and identifies those different sensations (Johnson-Bell, 2012). When we taste something, we experience a sensation in specific parts of the mouth, the so-called taste buds, which are dispersed throughout the mouth, and some of them have specific sensors (Johnson-Bell, 2012).
1.2.1 Key elements in Wine and Food Pairing
Taking decisions on how to combine the right wine with the food served is a quite challenging task. The key is to focus on what is most important, weather this is the texture or body of the food and wine, or even the flavors, taking into account also the role of the primary sensory components (sweetness, saltiness, acidity and bitterness). The terminology describing food (e. g. herbal, spicy, fruity, smoky) is much extended as well as the terms we use to describe wine (e.g. dry, oaky, tannic, floral) so with all this possible elements it is difficult to determine the one key driver behind matching choices (Harrington, 2008).
According to Harrington (2008), the elements mentioned above could be separated into three general categories: main taste components, texture elements and flavor elements. This more detailed hierarchy of food and wine sensory elements is shown in the Food and Wine Taste Pyramid in figure 1.1.
16 Figure 1.1. The Food and Wine Taste Pyramid (Harrington, 2008)
The view that wine is primarily a food beverage is traditional in many European countries (Jackson, 2009). According to Harrington (2008) there are two main ways to pair wine and food: contrasting or complementary. Complementary flavors have similar characteristics (e.g. two sweet foods such as vanilla ice cream with strawberry sauce – sweet + sweet) whereas contrasting have different characteristics (e.g. pears and Blue cheese – sweet + salty/savory) (International Dairy Deli Bakery Association, 2013). In terms of food and wine pairing, a contrasting match would be a crisp acidity of a dry Sauvignon Blanc with a grilled fat fish. A complementary example is the echo of a raspberry of a young Pinot Noir paired with raspberry reduction sauce (Harrington, 2008). Nevertheless, in the search for that paradigm of synergies, the basic motivation for wine and food combination is often forgotten and by that one means the reduction of the strong influence of wine’s alcohol content (Jackson, 2009). The consumption of wine with food slows the uptake of alcohol in the intestinal tract (Jackson, 2009).
A proper pairing helps to highlight the strengths of each food without allowing any flavor to become overwhelming. In other words, in order to achieve a successful pairing, it is essential to match the wine texture to the food texture, with the final objective being a complete and pleasant gastronomical experience. The sommelier Madeline Puckette has presented in detail the typical wine pairings, in table 1.1.
Flavor: Fruity, nutty, smoky, herbal, spicy, cheesy, earthy
etc.
Texture:
Body, Power, Weight and Structure
Components:
17 Table 1.1. Traditional food and wine pairings (adapted from Puckette, 2015).
Wine Styles Varieties Food pairing
Light Dry Whites Sauvignon Blanc, Pinot
Grigio, Alvarinho
Green Vegetables (raw and cooked), Fish
Rich Whites Chardonnay, Oaked
Whites, Viognier
Roasted Vegetables, Fish, White Meat
Sweet Whites Riesling, Chenin Blanc,
Moscato
Soft Cheese, Carbs1, Cured & Smoked Meat, Dessert
Sparkling Wines Champagne, Prosecco,
Cava, Franciacorta
Green Vegetables (raw and cooked), Cheese, Carbs1, Fish
Light Reds Pinot Noir, Grenache,
Pinotage, Gamay
Roasted Vegetables, Rich Fish, White Meat
Medium Reds Sangiovese, Merlot, Cab.
Frank, Tempranillo
Hard Cheese, Carbs1, White, Red & Smoked Meat
Strong Reds Cab. Sauvignon, Syrah,
Zinfandel
Hard Cheese, Red & Smoked Meat
Dessert Wines Port & Tawny Port, Sherry,
Late Harvest Tokaji
Soft Cheese, Carbs1, Smoked Meat, Dessert
1Carbohydrates.
After taking a look at the table 1.1, it is worth it pointing out some interesting highlights. For instance, the urban myth that dark chocolate fits perfectly with red wine is being doubted here, and the justification for that is the fact that the bitter flavors in chocolate multiply with bitter tannins in the wine, something that makes the entire pairing taste even more bitter (Puckette, 2015). Furthermore, one can say that sparkling wine pairs with a wide variety of foods as it acts like a palate cleanser (Puckette, 2015). Table 1.2 briefly presents past studies that have been established and could be characterized as comparable to our work. Each of the studies, follow approximately the same principles, aiming to match specific food items with certain wine varietals.
18 Table 1.2. Past studies that focused on food and wine pairing aspects
Study Details Consumer
group
Attributes
Reference
Positive match Negative match
Cooked foods and wines
8 trained members
Riesling/ grilled pork loin
Pinot noir/ grilled pork loin Merlot/grilled pork loin Cabernet Sauvignon/ grilled pork loin Riesling/ braised beef
Pinot noir/chicken & Papillote
Merlot/ chicken & Papillote Carbenet Sauvignon/ chicken & papillote Harrington (2007)
Wine and cheese 13 member
trained panel Pinot noir/ Boursin Riesling/ Grana Padano Pinot noir/ Gruyere Riesling/ Danish Blue Chardonnay/ Boursin Merlot/Grana Padano Carbenet Sauvignon/ gruyere Chardonnay/ Danish Blue Harrignton (2008) Chocolate and beverage pairing 16 participants Chocolate best match/ Port wine
Chocolate/ mineral water Lambri et al. (2012) Sauvignon Blanc, Chardonnay, Cabernet Sauvignon and Port wine, cheeses, salami and chocolate 248 participants ranged in expertise levels and in industry SB/ Chevre CD/ Brie CS/ Salami PT/ chocolate PT/ Chevre PT/ Brie PT/ Salami CS/ chocolate Koone et al. (2014)
Sauvignon Blanc and Ruby Port with goat cheese and chocolate
79 Students and senior level SB/goat cheese and RP/ chocolate significantly SB/ chocolate and RB/ goat cheese Harrington & Seo (2015) Aragonez, Blend of Touriga Nacional, Tinta Roriz and Tinta Barroca, Baga and portuguese farinheira stew (sausage and bacon dish) 20 trained students with agricultural background/ 29 untrained students with agricultural background Blend of TN, TR and TB/ farinheira stew/ Baga/ farinheira Arragonez with farinheira stew Almeida (2017)
1.3 The impact of “Neophobia” in Wine Tasting
After initially attempting to eat almost everything, children usually develop neophobia – a distrust to try new foods (Jackson, 2009). The inactivation of neophobia, not only in terms of trying new kinds of food, but also any kind of beverages, juices etc., can take decades. In a more general approach, there is a coexistence between a
19 demand for modernity and naturalness regarding diet and food, including the need for novelty (neophilia) as well as caution, concerning new, unknown food (neophobia) (Coppola et al., 2014) as well as, in our case, particular styles of wine. It is known that there exists a population of individuals who are hesitant to try new wines and by new it is meant the sum of particular styles such as Orange or Biodynamic wine, wines originating from other countries or even continents, wines with different, innovative and sometimes unfamiliar with the tasters ways of production etc.
It's understandable that cultural variables may play an important role in influencing responses to new styles or foreign wines. The educational background, age, gender and many other social-demographic factors could have an impact on how willing the people are to taste new wines. This wine “neophobia” should be overcome through repeated development of knowledge, informing and promoting a global and friendly tasting environment.
1.4 Taster Segmentation
The term “segmentation” includes all the procedures that aim to divide people into groups by using specific categories, such as gender, age, origin or in our case, tasting experience. Special attention should be given when it comes to create consumer/taster segments, as through this procedure we receive information about taste sensitivity and preferences as well (Almeida, 2017). The most common distinctions are based on different categories linked with demographic, physiological, psychological and taste sensitivities. The segmentation can be achieved usually by simple demographic questionnaires (e.g. with questions aiming to know the gender, age, origin, educational and cultural background etc.) as well as by tests and measurements of the taste functions. When it comes to taste function measurements, parameters such as saliva flow rate, sensitivity to 6-n-propylthiouracil (PROP), sweet liking rates etc. should be evaluated and taken into account. Apart from the tests mentioned above, there is a quick online test, the so called “Vinotype”, which is based on questions concerning feelings and intuition, and has been proved to assume personal wine preferences (Hanni, 2013).
20 1.4.1 Saliva Flow Rate
Saliva is the first physiological discharge induced by ingestion of foods or beverages and its reaction is considered essential in the oral cavity as well as in taste perception (Stokes, 2013). It can affect significantly the perception of taste through titration, dilution and precipitation of stimuli (Ceciliani, 2017). As it is expected, individuals vary a lot in their salivary flow rates, but what is rather interesting is that there are significant differences in the concentrations of the salivary constituents in the same individual, under different circumstances (Matsuo, 2000). The saliva flow rate can be determined with the stimulation of citric acid (Ishikawa and Noble, 1995). The principles of this method implement that the taster ingests 10 mL of citric acid (with a 4 g/L concentration) and after 10 seconds gathers the expectorated saliva into a cup. The procedure is complete when the saliva produced in one minute is being weighted (Smith et al., 1996), dividing the tasters into low or high producers, using as a cut-off the average saliva weight obtained by the sum of the participants.
1.4.2 Taster Phenotype – PROP
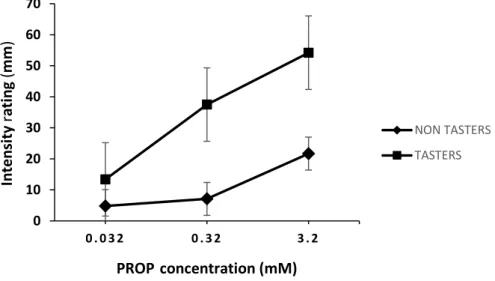
According to Tepper (2001), the ability to taste the bitter thiourea compound phenylthiocarbamide (PTC) as well as 6-n-propylthiouracil (PROP) is an inherited characteristic shared by approximately 70% of the US adult Caucasian population, the so called PROP medium tasters and supertasters. The remaining 30% of the population receive PROP as weak or tasteless and they are called nontasters (Tepper et al., 2001). Thioureas contain the chemical moiety N-C=S, which is responsible for its bitter taste (Bartoshuk et al., 1994). It is shown through past studies that PROP tasters (medium tasters and supertasters) generally perceive greater intensity than the nontasters, from a wide variety of compounds, such as caffeine, quinine, benzyl alcohol and many others (Tepper et al., 2001). Prop tasters are also known to show greater sensitivity to oral irritation from capsaicin, cinnamaldehyde and benzyl alcohol (Prescott et al., 2000). The ability to taste this compound is more common in women than in men (Whissell-Buechy and Wills 1989); therefore, women are supertasters more frequently and have more fungiform papillae and more taste buds (Bartoshuk et al. 1994). Also, according to Whissell-Buechy (1990) this ability is present in young children, declining slowly with age.
The PROP sensitivity evaluation procedure includes a tasting with 3 glasses with 20 ml of water solutions displayed in increasing order of concentration of the compound (6-n-propylthiouracil), 0.032 mM, 0.32 mM and 3.2 mM. The procedure is
21 simple, requesting from the taster to evaluate in terms of intensity perceived, the bitter sensation of each concentration in a 100 mm general Labeled Magnitude Scale (gLMS) and are following classified through the score given to the 0.32 mM solution (Non-taster ≤ 15.5 mm; 15.5 < Taster < 51 mm; Super-taster ≥ 51 mm) (Pickering et al., 2004).
1.4.3 Vinotype
The vinotype test is an online wine personalization test (www.vinotype.com) which is principally based on the preferences of the individuals, launched in 2011 (Hanni, 2013). The developer of the vinotype test was Tim Hanni, an American Master of Wine, whose objective was to help consumers find out more about their own preferences. Hanni (2013) takes a phenotypic approach, which demonstrates that all organisms can be categorized into phenotypes, that in the case of individuals, the phenotype is the composite of the individual’s observed properties, characteristics and traits (Borchgrevink and Sherwin, 2017). In sum, the phenotypic approach suggests that individuals develop (behavioral, food, entertainment) preferences over time based on their experiences and interaction with their broader environment (Borchgrevink and Sherwin, 2017). Adapting the phenotypic approach to the world of wine and wine preference, Hanni (2013) proposes the use of vinotype, defined as “The set of observable characteristics of a wine-imbibing individual resulting from the interaction of its genotypic sensory sensitivities in a wine-related environment”.
The philosophy of the test is that the subjects will answer to several questions, which in the end will determine, according to their personal statements and preferences, their sensory sensitivities and tolerances, thus their characterization. The four primary categories of vinotype are the following: Sweet, Hypersensitive, Sensitive and Tolerant.
22 Table 1.3. Categories of Vinotype personalization test (adapted from Hanni, 2013
and Borchgrevink and Sherwin, 2017).
1.4.4 Sweet Liking
Despite the fact that sweetness is generally a desirable taste, consumers can be divided into two groups, sweet likers and dislikers, according to their hedonic responses and preferences to sucrose solutions (Methven et al., 2016). As humans have an innate tendency for liking sweet flavors, the term “sweet dislikers” is somewhat inaccurate. SD according to Methven et al. (2016), are unlikely to dislike sweetness in totality, but slightly prefer moderate sweetness levels to high sweetness ones.
Vinotype Description
Sweet Greater preference to sweet foods and/or fragrant sweet wines with low
alcohol
Preferred wines: Chardonnay, Moscato, Pinot Noir, Riesling, Sangria, Sparkilings
Higher number of tasting buds
More likely to be women (approximately 21%) and 7% men
Hypersensitive Greater preference to lower alcoholic content wines, delicate dry or off-dry, aromatic and smooth wines
Preferred wines: Blush/Rose, Chardonnay, Gamay, Pinot Grigio, Pinot Noir, Riesling, Sparklings
Intense sensory experiences
About 38% of women and 36% of men
Sensitive Widest range of wine preferences, willing to try new flavors and styles
Preferred wines: All styles
Tendency for delicate or full-bodied wines, dry whites and rich reds About 25% men and women
Tolerant Preference for more tannic, powerful, full-bodied reds, intensity and high
flavor in whites
Preferred wines: Cab. Sauvignon, Malbec, Pinot Noir, Sauvignon Blanc, Syrah
Willing to try wines with higher alcohol
23 One approach to evaluate the differences among the degree of tolerance for sweetness, between SL and SD is to measure the point at which food or beverage (in this case wine) is rejected when a quality (in this case sweetness) is being increased (Methven et al., 2016). Such points are known as “Rejection thresholds” (RjT) and they have been previously determined for tastes and flavors that are claimed to have a strong impact on acceptability (Methven et al., 2016).
The evaluation of sweet liking is commonly demonstrated by simple tests that include liking of sucrose solutions using visual analog scales (VAS), to establish SL and SD classifications. VAS is the most common pain scale, being used worldwide for quantification of several chronical painful diseases (Sinha et al., 2017). VAS can be presented in a number of ways, including: scales with a middle point, graduations or numbers (numerical rating scales), meter-shaped scales (curvilinear analogue scales), "box-scales" consisting of circles equidistant from each other (one of which the subject has to mark), and scales with descriptive terms at intervals along a line (graphic rating scales or Likert scales) (Scott & Huskisson, 1976). In general, VAS scales are considered a reliable instrument for more valid and exact measurements than other types of scales, they are more sensitive to small changes and take less than 1 minute to complete, however, assessment is clearly highly subjective and they cannot be administered verbally or by phone as they are used as a paper and pencil measure.
1.5 Background and objectives of the study
Food and wine habits are strongly affected by a variety of cultural norms and events, including the history of a region, the food systems employed, the traditions, trades, belief and local capabilities (Harrington, 2008). The bond between wine and culinary industry is very tight and is getting developed as the years pass by, adapted into the new technologies and innovative processes of production as well as marketing. Food and wine should be considered as two complementary goods that one works in absolute synergy with the other. The main concept behind pairings is that certain elements (such as texture and flavor) in both food and wine interact with each other, and thus, finding the right combination of these elements will make the entire dining experience more enjoyable and pleasant. While there are many books, magazines and websites with detailed guidelines on how to pair food and wine, as well as studies established in the past, most food and wine experts support the idea that the most essential element of food and wine pairing is understanding the balance between the "weight" of the food and the weight (or body) of the wine.
24 It’s understandable that emphasizing on the wine and food separately is much more practical and flexible, as well as simple and straightforward than putting an effort in studying both together as a combination. Therefore, the aims of our study were to develop an experimental approach of wine tasting, first as an individual separate concept and next, accompanied with food as a pairing match. Our first tests aimed to establish the preference for wines with modified bitterness, sweetness and astringency, following the principle that these sensations are claimed to be the basis of food pairing. After, we proceeded to the evaluation of the panel’s preferences for 4 commercial national and international wines, originating in Greece and Portugal, when paired with a typical cold Greek dish, in a try to additionally observe the respondents’ behaviour towards foreign, unfamiliar wine varietals and food flavors, following past relative studies emphasizing on food and wine “neophobia” (Ristic et al., 2015). As there are few published studies regarding evaluation of tastings with wine and food pairings, different types of tasting were applied to decide which would be the most efficient and accurate ones.
In summary, the objectives of our study were the following:
1. To evaluate the intensity and appreciation of acidity, astringency and sweetness in white wine.
2. To observe and evaluate the behavior of the trained panel towards wine and food matching.
3. To determine which of the 4 commercial wines was more preferred as an accompaniment to a typical Greek (Cretan) cold dish.
4. To observe the tasters’ behavior (conservative or not) towards foreign wines, made of indigenous Greek varieties.
25
2. Material and Methods
2.1 Participant selection
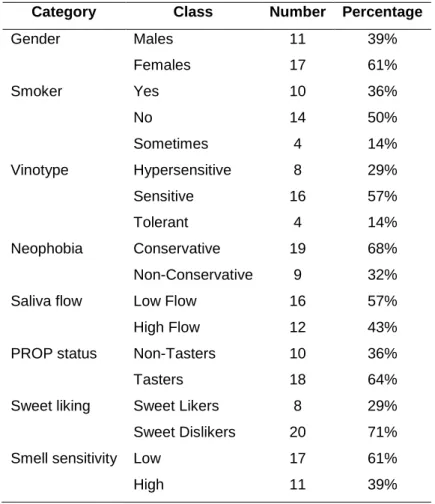
The tasting panel was constituted by 28 students (11 males and 17 females), age 21 to 40 years old (average 24 years, standard deviation 4.6) from the first and second year of the Enology and Viticulture Master (year 2016/2017), as well as by other students from the faculty of Instituto Superior de Agronomia, mainly with agricultural and food engineering backgrounds. All these students were subjected to intensive training in order to get familiarized with the tasting procedure, as well as to get divided into categories determined by physiological or demographic characteristics.
All participants were asked to fill in self-reported questionnaires regarding their education background, demographic information, wine consumption frequency gender, age, smoking habits and vinotype (Appendix I). All sessions took place in the laboratory of Microbiology of ISA and lasted approximately four months, applying from one to three different tests each week, depending on time flexibility and materials.
2.2 Training of the panel
Training began by the evaluation of prototypical tastes (sweet, acid, salt, bitter) and astringency. Several tests were done to select the tasters. The objective of these tests was to determine if the tasters were able to detect the simple tastes. In addition, adaptation to scale utilization (section 2.3.2) was performed by rating several sensations experienced at least once in their life, concerning pain, tastes, and senses (Annex IV).
2.3. Taster characterization
Tasters were characterized in relation to several preferences and physiological functions, using self-reported questionnaires and/or tasting evaluations.
2.3.1 Vinotype
Vinotype is an online test (www.myvinotype.com) based on the individual’s wine preferences (Hanni, 2012). It assesses individual taste sensitivities and tolerances and helps the consumers to learn more about their own preferences. The vinotype is the sum of physiological and psychological factors that determine wine preferences and values. The procedure is quite simple, containing short questions that
26 will give the final characterization of the applicant. The possible four results are: Sweet, Hypersensitive, Sensitive and Tolerant.
2.3.2 Determination of the taste phenotype
The taste phenotype was determined by the taste intensity of 6-Propyl-2-thiouracyl (PROP) (Sigma, St. Louis, USA)using the Labeled Magnitude Scale (LMS). The LMS is a quasi-logarithmic scale with label descriptors that is equivalent to magnitude estimation (Green et al., 1996, Tepper et al., 2001). The LMS has two anchors, one lower with the phrase “barely detectable” and one higher with the phrase “strongest imaginable”. This “strongest imaginable” is related to the taste or oral stimulus ever experienced in everyday life (Tepper et al., 2001). In between there are indications such as “very strong”, “strong”, “moderate” and “weak” that guide the tasters to choose the one that fits more to their preference. According to Green et al. (1996), instructions were given written and orally to the group of the tasters, in order to get familiarized with the LMS
:
‘‘After you taste the first sample rate the intensity of the sensation by drawing a mark on the LMS Scale. You can use any part of the line scale that seems appropriate for judging intensity.” In general, the participants did not seem to have any confusion in terms of scale utilization, as the instructions were clear and simple to understand. We made sure they would understand that the indication “strongest imaginable” refers to the most intense sensation they have ever experienced including putting food or non–food items in their mouth (Tepper et al., 2001). To have an idea on how they appreciate their “strongest imaginable” sensation, we asked them to evaluate five different sensations by drawing a horizontal line across the LMS scale and after to write down the own “strongest” sensation in any modality sensation they could ever imagine experiencing (Αppendix IV – Sheet IV.1). This helped us understand if the tasters understood the nature of the logarithmic scale by were giving reasonable answers.The concentrations of PROP solutions were of 0.032 mM, 0.32 mM and 3.2 mM, displayed in increasing order of concentration. Approximately two hours before serving, the solutions were brought to room temperature (18 ± 2 °C). The solutions were served in transparent ISO tasting glasses from Schott Zwiesel (Zwiesel, Germany). Prior to each sample, the tasters were asked to rinse thoroughly with water. Each concentration contained 20 ml of solution and the participants were instructed to move the sample from side to side in the mouth for 5-10 seconds and then expectorate. After waiting for 10-15 seconds, they marked in the gLMS scale the intensity of the bitterness taste of each sample. We asked the participants to drink spring water between every sample they tasted and to spit out the sample. Tasters were classified
27 as Non-Tasters, Tasters or Super-Tasters, according to the response to the bitter stimulus.
2.3.3 Saliva flow determination
The participants were asked to taste a sample of 0.2 mM citric acid, hold it for 10-15 seconds then spit it out and wait for another 10 seconds for the saliva sample to be gathered in a plastic cup. By weighing the samples given, we were able to determine the saliva flow following the procedure described by Smith et al. (1996). The average saliva weight will be used as a cut-off, to divide the panel according to their saliva production, high producers if total amount of saliva produced was higher than it and low producers if the saliva flow was less than the amount referred above.
2.3.4 Determination of sweet liking status
The establishment of sweet liking status followed the studies of Methven et al. (2016) and Asao et al. (2015). Using the VAS liking scale (described in 1.4.4), we requested from the participants to appreciate a solution of distilled water containing 205 g/L of sucrose (quantity based on the Intraclass Correlation Coefficient or ICC’s, which is an inferential statistic that can be used in the case of quantitative measurements are made on units that are organized in groups). In our case, ICC implements that adults can reliably rate their liking of sucrose at concentrations ≈ 0.6 Μ or above) (Asao et al., 2015). Tasters kept the samples in the mouth, waited for the sensation to peak (1-15 seconds) and after spiting, drew a mark on the VAS liking scale (left end “dislike extremely” to right end “like extremely”) according to their personal preference. Our goal was to obtain distinction between sweet likers and sweet dislikers using the cut-off value of 7.5 cm (as the VAS scale is 15 cm long, and we used the mid-point to divide the answers of the tasters).
2.3.5 Smell Sensitivity
Smell sensitivity was determined by smelling a control wine from ISA (section 2.4.1). The wine was flavored with increasing concentrations of one aroma solution. Aroma compounds and their concentrations were chosen based on previous research of Gewurztraminer wines (Guth, 1997; Ong & Acree, 1999). The aroma solution was composed by ethyl butanoate, 2-methylpropan-1-ol, isoamyl acetate, 3-methyl-butan-1-ol, ethyl hexanoate, 2-phenyl ethanol, cis-rose-oxide, acetaldehyde, linalool, ethyl octanoate and beta damascenone. Model wine was freshly prepared on the day of the testing. Four wine solutions were prepared with increasing order of concentration of the aroma solution, one witness solution with no aroma solution added, and the other
28 three with 0,5 ml/L, 1 ml/L and 2 ml/L respectively. Tasters were asked to measure, with a ruler, the distance (in cm) from the glass top to the nose when the smell was noticed. Two classes were obtained, one of high sensitivity and the other of low sensitivity.
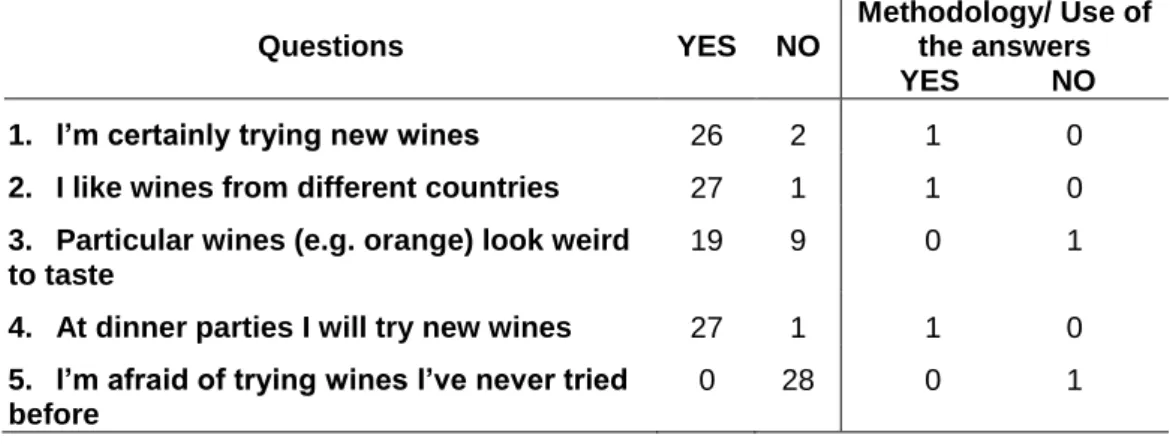
2.3.6 Neophobia evaluation
Taking advantage of the fact that two of the four wines used for the food pairing sessions were of Greek origin, after ranking the wines before and after food pairing, tasters filled a separate questionnaire with five simple questions aiming to know how reluctant they seem to be towards different styles of wines (e.g. orange wines), as well as how willing they are to try wines from different countries. The procedure requested from the subjects to choose between two answers (YES/NO) in each of the five questions, adapting the Food Neophobia Scale (FNS) (Pliner & Hobden, 1992), which was developed to assess the topic of innovation and acceptance of multicultural cuisines. The two additional categories were conservative and non–conservative wine tasters.
2.3.7 Taste intensity determinations
Aqueous solutions of tartaric acid, tannic acid and sucrose, served on increasing concentrations each time (Table 2.1). Similarly to the previous sessions, two hours before serving, the solutions were brought to room temperature (18 ± 2 °C). The participants were asked to evaluate the taste intensity of the solutions by using the LMS scale.
Table 2.1. Reagents and concentrations of aqueous solutions used in taste intensity determinations.
2.4 Taste intensity and liking of aqueous solutions and white wine spiked with several tastants
2.4.1 Wine analysis
Sensations/Tastes Concentration and Reagent Acidity 0.1, 1 and 10 g/L Tartaric Acid Astringency 0.1, 1 and 2.5 g/L Tannic Acid
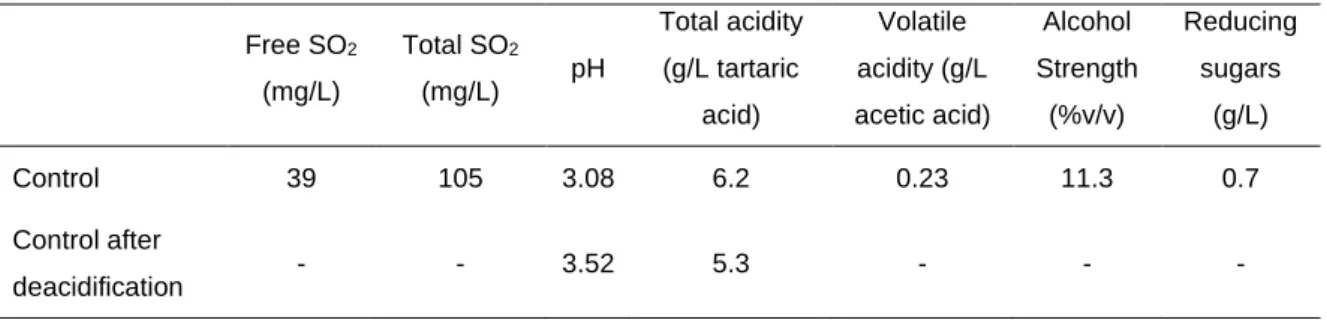
29 The base wine was obtained from the variety Macabeo obtained by classical white wine vinification in ISA winery during the vintage of 2016 (un-oaked). Macabeo is a Spanish variety and has been chosen for its neutral character. Wine was de-acidified using 1 g/L calcium carbonate to reduce fixed acidity (Table 2.2). The wine was spiked with the tastants and the solutions stored at 3-5 °C (in the refrigerator) for three days before tasting.
Table 2.2. Analysis of ISA Macabeo 2016 wine.
Free SO2 (mg/L) Total SO2 (mg/L) pH Total acidity (g/L tartaric acid) Volatile acidity (g/L acetic acid) Alcohol Strength (%v/v) Reducing sugars (g/L) Control 39 105 3.08 6.2 0.23 11.3 0.7 Control after deacidification - - 3.52 5.3 - - - 2.4.2 Intensity evaluation
The tasting took place in three parts: initially, the subjects were served with five glasses with solutions of tartaric acid, then sucrose and finally tannic acid soaked in distilled drinking water, one glass with control wine and one with water. Following, they were asked to evaluate the samples in terms of intensity using the VAS. As mentioned previously, VAS is the most common pain scale, being used worldwide for quantification of several chronical painful diseases (Sinha et al., 2017). It can be used either for intensity ratings or hedonic appreciation. The increasing concentrations used were 0.15, 0.3, 0.6, 1.2 and 2.4 g/L for tartaric acid, 1.5, 3, 6, 12 and 24 g/L for sucrose and 0.09, 0.18, 0.38, 0.75 and 1.5 g/L for tannic acid, respectively. After completing each tasting, we asked the participants to write down which sensation they perceive from the content of the glasses, in order to determine if they are capable of identifying the increase of the concentrations and thus select the optimal candidates to complete the panel.
An additional tasting was organized later, following the principles of the previous mentioned above, this time using white wine as a solution instead of distilled drinking water. Approximately two hours before serving, the solutions were brought to room temperature (18 ± 2 °C). Labeled 20 mL samples of tartaric acid (in concentrations of 0.15, 1.3, 0.6, 1.2, 2.4 g/L), sucrose (in concentrations of 1.5, 3, 6, 12 and 24 g/L) as well as tannic acid (concentrated in solutions of 0.093, 0.1875, 0.375, 0.75 and 1.5 g/L) were served to the participants together with a glass of the control
30 wine and one of water. Initially, the participants were asked to rinse their mouth with filtered water before starting the samples tasting. After, the subjects were asked to put the samples in their mouth and rinse for 10 seconds, being sure that they cover all the mouth surfaces and wait for the sensation intensity to peak (10-15 seconds). Following, they were requested to draw a mark on the intensity scale as well as in the liking scale (see below) according to their personal preference. The estimated break-point between the several samples, was approximately one minute.
All the samples were presented blind, randomized and coded with three random digit numbers. During the tasting, two additional glasses were used, one served with the control wine, and one with spring water. Control wine was not scored in the results. This warm-up sample helped the tasters to have an overall idea of how the wine genuinely tastes, without any additions. All results are presented in Annexes 3.1 to 3.3.
After collecting and observing the data from increasing concentrations of tartaric acid, tannic acid and sucrose soaked in wine, we found that it was necessary to apply a repetition of sucrose tasting, as the majority of the tasters were not able to detect the sweet sensation. Therefore, we established a new tasting, this time using double concentrations of sucrose (reaching 6, 12, 24, 48 and 96 g/L respectively), spiked in wine and following exactly the same principles as in the previous one. Participants were blinded to the concentration of sucrose they were tasting and the solutions were presented in random order. This additional session was established mainly for training reasons, in order for the panel to practice their skills in terms of detecting and recognizing better any increase occurring on the concentrations, as well as to offer them one more chance to train themselves before the final wine tasting and food pairing session. The results kept were the ones obtained by the first formal tasting and not this one. The results from the increased concentrations of sucrose are presented in Annex 3.1.2.
2.4.3 Hedonic evaluation
The participants were familiarized with the hedonic visual analogue scale (VAS) in order to facilitate correct scale use. The hedonic VAS scale (15 cm, scaled 0-100), was marked with a neutral point at half scale length and had end-anchors from “dislike extremely” to “like extremely”, always following the instructions given by Methven et al. (2016). The VAS score was determined by measuring in centimetersfrom the left hand end of the line to the point that the respondent marks using a ruler (Gould et al., 2001).
31 The tastants tartaric acid, tannic acid and sucrose were served on increasing concentrations each time. Similarly to the previous sessions, two hours before serving, the solutions were brought to room temperature (18 ± 2 °C). The tasting took place in three parts: initially, the subjects were served with five glasses with solutions of tartaric acid, then sucrose and finally tannic acid soaked in wine, always accompanied with a glass of water. They were asked to evaluate in terms of intensity and liking the samples given, using the VAS and gVAS scales. The increasing concentrations used were 0.15, 0.3, 0.6, 1.2 and 2.4 g/L for tartaric acid, 1.5, 3, 6, 12 and 24 g/L for sucrose and 0.09, 0.18, 0.38, 0.75 and 1.5 g/L for tannic acid respectively. In the end of each tasting, the participants were requested to write down again which sensation they perceived from the content of the glasses, so as to determine if they are able to recognize the mouthfeel sensation.
2.5 Influence of food on wine preference 2.5.1 Wine characteristics
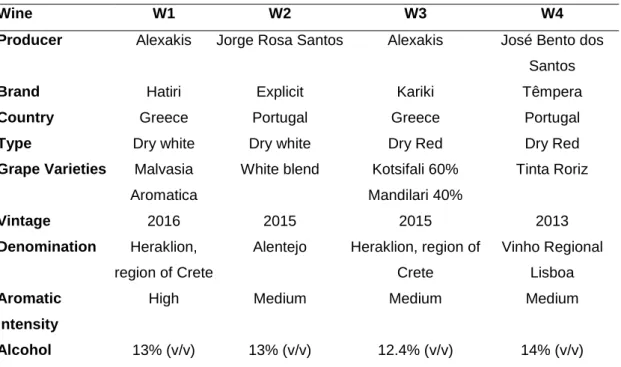
Four different wines were used for the tastings, originating in two countries, Greece and Portugal, aiming to offer a broad range of sensory and cultural features and styles. The technical characteristics of the wines are briefly presented in table 2.3.
Table 2.3. Brand and technical characteristics of the wines used in food pairing.
Wine W1 W2 W3 W4
Producer Alexakis Jorge Rosa Santos Alexakis José Bento dos Santos
Brand Hatiri Explicit Kariki Têmpera
Country Greece Portugal Greece Portugal
Type Dry white Dry white Dry Red Dry Red
Grape Varieties Malvasia Aromatica
White blend Kotsifali 60%
Mandilari 40%
Tinta Roriz
Vintage 2016 2015 2015 2013
Denomination Heraklion, region of Crete
Alentejo Heraklion, region of
Crete
Vinho Regional Lisboa
Aromatic Intensity
High Medium Medium Medium
Alcohol 13% (v/v) 13% (v/v) 12.4% (v/v) 14% (v/v)
Wine number 1 was a quite aromatic dry white wine, mono-varietal of the Malvasia Aromatica grape variety, originating from the island of Crete, region of
32 Heraklion, Greece. Among the four selected wines, “Hatiri” was the most aromatic and intense wine with revealing citrus fruit notes. Smooth and creamy with a balanced taste, and an aromatic aftertaste of jasmine and night flower, a plant of a most distinct aroma, indigenous to Crete (Alexakis SA, 2013). The vines were planted in sandy clay loam soils, rich in calcium, with density of 3.800-4.200 vines per hectare.Cold settling and injection with selected yeast follow, to highlight the aromatic varietal profile. The wine was fermented in stainless steel tanks for 10-12 days at temperatures that did not exceed 16°C. The purpose of its selection was to observe the preference of the tasters when it comes to combining such an aromatic type of wine with food.
Wine number 2, was a medium aromatic dry white wine, made of Portuguese white blend, with denomination of Alentejo, Portugal and more specifically, from an one hectare old (80-100 year old) field blend vineyard in Portalegre located at 540 m above sea level. Explicit is a wine that gives the dominant impression of salty minerals and creamy, nutty lees, carrying a vegetal character as well. It was fermented and aged in oak barrels for 7-8 months. More neutral than the greek white wine used as wine number 1, “Explicit” was chosen to represent the less aromatic intense white wine style. Wine number 3, “Kariki”, was a dry red wine, blend of the indigenous Aegean red varieties Kotsifali (60%) and Mandilari (40%), which were selected through vineyards in collaboration with vine growers from Heraklion region (island of Crete, Greece). Deep red color, with violet tints, especially when young. It brings a rich and balanced taste and it’s characterized by dense aromas of small red fruits (blackberry, cherry) as well as black pepper notes (Alexakis SA, 2013). Aged six months in tanks that reproduce the barrel’s environment, followed by two months maturation in the bottle. The vinification included the application of micro-oxygenation. “Kariki” was chosen as a representative of mild – easy red wines, in a try to offer to the panel the opportunity to taste two completely different styles of red wine, and observe their preference among food pairing.
Finally, wine number 4, “Têmpera”, made out of Tinta Roriz grapes (100%), is a rich, dry red wine, originating in “Lisboa” region of Portugal. Handpicked grapes, strictly selected. As a wine it is quite aromatic, with notes of ripe fruits, strawberry and raspberry, soft on the palette with slight spicy notes. It is characterized by its medium acidity and tannins and it is aged 14 months in oak barrels, of which 35% are new, having an ageing potential up to 12 years. Fermentation was taking place in stainless steel tanks followed by strict temperature control. A complex wine, to complete the four wines offered to the tasters, in order to obtain the evaluation and appreciation on each one separately, after food consumption.
33 2.5.2 Food recipe
The main objective of this work, as previously mentioned, was principally to analyze the preferences of the tasters when it comes to a complete wine tasting accompanied with food pairing, as well as to observe their reactions towards wines with different origin than that they’re used to, by requesting to fill in a self-reported questionnaire referring to “neophobia”. Therefore, the chosen dish was a simple cold greek meal, traditionally served in the island of Crete. The dish is called “dakos” (Ντάκος in greek), and it consists of a slice of soaked dried bread or barley rusk, topped with chopped tomatoes and crumbled feta cheese, flavored with herbs such as dried oregano. Olives, salt and pepper can also be added. A quite simple dish to prepare, broadly served in Greece as a starter or a full salad. Each participant was offered an individual dish to taste.
Recipe:
1. Soak the dry bread or barley rusk with a bit of water, so as it will obtain a softer texture.
2. Chop the tomatoes into tiny pieces or even use a grater for more efficiency and spread them on top of the soaked dried bread.
3. Place the crumbled feta cheese above and pour the (preferably extra virgin) olive oil, minding to cover all the surfaces of the dish.
4. Finally, add the herbs (oregano, salt and even pepper) to enrich the flavor. 5. Olive oil was also added as an extra topping.
2.5.3 Wine ranking
The tasting began with the four wines being served in portions of 25 ml, using the ISO standard transparent glasses and the participants were asked to taste each wine and rinse with water between each sample. Following, we requested from them to evaluate each wine sample according to their preference. The second part of the session was dedicated to the food pairing. Specifically, the tasters were asked to try the wine and the food two times, then after the third tasting of the wines evaluate each wine sample, according to its ability in being paired with food. After, they wrote down which was their favorite wine, starting with the most pleasant (1st place) and finishing
with the least preferred one (4th place), following the method described in ISO (8587).
34 Table 2.4. Tasting sheet used in food pairing.