The distribution of estuarine fish larvae: Nutritional condition and
co-occurrence with predators and prey
Eduardo Esteves*, Teresa Pina§, M. Alexandra Chícharo, J. Pedro Andrade
CCMar – UCTRA Universidade do Algarve, Campus de Gambelas, 8000-810 Faro, Portugal. * Corresponding author (fax: +351 89 818353; e-mail: [email protected]) Received 25 January 2000; revised 1 May 2000; accepted 25 May 2000
Abstract — Fish larvae were collected monthly between March and September 1997 in the Mira and Guadiana estuaries (southern Portugal).
Hydrological parameters were registered and zooplankton samples were obtained simultaneously. Densities of fish larvae (ind·100 m–3) were
calculated from 211 samples and larval nutritional condition measured as RNA/DNA ratios were obtained for 346 individuals, using a fluorimetric method for nucleic acid quantification. Correlating variables were further studied using multiple regression analysis in order to assess the relative importance of abiotic and biotic factors affecting within-year trends in abundance and nutritional condition of estuarine fish larvae. Results indicated that: 1) the abundance of fish larvae seems conditioned by temperature and predation; and 2) their nutritional condition is dependent on temperature and prey availability. Temperature is an important variable structuring estuaries and therefore conditions the behaviour and physiology of fish larvae. Furthermore, the co-occurrence of predators and larvae might be related to similar feeding patterns or comensalism. Whenever feeding conditions are suitable, they usually determine enhanced growth and nutritional condition. However, predation seems to control this latter relationship through its effect on larval mortality. © 2000 Éditions scientifiques et médicales Elsevier SAS
Fish larvae / distribution / RNA/DNA ratios / nutritional condition
1. INTRODUCTION
Recruitment to commercial or adult stocks of fish is believed to depend primarily on survival during the annual re-colonisation of the environment by larval stages [39]. Several hypotheses linking abiotic and biotic factors with larval mortality have been pre-sented [20, 33, 34, 43, 66]. However, it is not generally agreed whether density-independent (temperature, ad-vection) or density-dependent mechanisms (starvation, predation) prevail in determining the survival of lar-vae. Although hydrological factors and predation seem to regulate larval mortality [3], starvation is also responsible, directly or through increasing vulnerabil-ity to predation and liabilvulnerabil-ity to detrimental abiotic factors [37].
Since Bulow [10] first stated the usefulness of nucleic acid-based indices for nutritional condition
analysis of marine fish larvae, several authors have used RNA/DNA ratios for the assessment of condition and growth of larvae (see [6] for a review). The RNA/DNA ratio is an ecophysiological index of con-dition, which reflects the potential for protein synthesis [17]. The use of nucleic acid-based indices, e.g. RNA/DNA ratios, allows the study of larval nutritional condition and its relationship with several abiotic and biotic factors and their relative importance in deter-mining larval mortality and recruitment.
Clupeidae, Gobiidae, Blennidae and Atherinidae larvae are among the most common and representative families of fish in Portuguese estuaries (e.g. [16, 21]). Clupeids are a basic component of an important pelagic fishery off the Atlantic coast of the Iberian Peninsula [55] and the other three families are de-scribed as resident species of a number of estuaries [1, 16, 47, 59, 60].
Quantitative assessment of the relative importance of abiotic and biotic factors is lacking for most Portuguese estuaries. Hence, the aim of this study was to examine how short-term changes in temperature, §Present address: IPIMAR, Av. 5 Outubro, 8700-305 Olhão,
salinity, turbidity, and abundance of potential prey and predators affect within-year trends in the abundance, distribution and nutritional condition of fish larvae in the Mira and Guadiana estuaries (Portugal).
2. MATERIALS AND METHODS 2.1. Study areas
The Mira and Guadiana located in southern Portu-gal (figure 1) are partially mixed estuaries (see [42] for a review). In the Mira, the influence of the tide extends to Odemira (figure 1, station #7), approxi-mately 30 km from the mouth, where mechanical
effects are evident and salinity ranges from <0.5 to
6.0 PSU. In the Guadiana, the salinity effects
(<0.5–2.0 PSU) and mechanical effects of the tide
extend to Mértola (figure 1, station #6), more than 60 km away from the mouth. In addition, average
monthly river discharge does not exceed 4·106m3 in
the Mira (in April) whereas in the Guadiana, it varies
between 39·106m3(in July) and 170·106m3(in May)
[SNIRH, http://set.inag.pt/snirh/].
2.2. Larval sampling and hydrological measurements
Between March and September 1997, fish larvae were sampled monthly in fifteen stations located in the Mira (n = 8) and Guadiana (n = 7) estuaries (figure 1). The stations covered the major regions of the estuaries, from the euhaline zone to the oligohaline/limnetic transition area, sensu Mc Gurk et al. [48]. Tempera-ture, salinity, Secchii disk depth and zooplankton samples were recorded simultaneously. In May, June, July and September, samples were also collected every 2 h during four 24-h sampling at Vila Nova de Mil-fontes (Mira river) and Vila Real Santo de António (Guadiana river) – in both cases near the river mouth (figure 1).
Mesozooplankton was collected with a conical net
(0.37×1.60 m, 0.5-mm mesh size) towed at 1 m
depth, at a constant speed of approximately 1 m·s–1for
10 min. Samples were sorted in a black glass tray, the fish larvae retrieved and immediately frozen in liquid nitrogen (–197 °C). The remaining zooplankters were stored in buffered 4 % formaldehyde solution. A fur-ther 10 L water were sampled at 0.5 m depth and filtered through a 0.06-mm mesh size net to collect microzooplankters. During larval fish and zooplankton sampling, Secchii disk depth was monitored and sur-face temperature (°C) and salinity (PSU) were mea-sured using a thermometer and a refractometer, respec-tively.
2.3. Laboratory procedures and larval condition analyses
Fish larvae and the remaining preserved zooplank-ters were identified using keys provided in Fives [28], Newell and Newell [50], Palmer and Culley [52], Russell [62], Saville [63], Smith [68], and Todd and Laverack [75]. Fish larvae were identified to family level in order to minimise taxonomical errors and include the least represented species [64]. Larvae of Clupeidae, Blennidae, Gobiidae and Atherinidae each accounted for more than 10 % of total ichthyoplankton abundance and were used for further analyses. When-ever zooplankters were extremely abundant, succes-sive sub-samples obtained with a 2-mL Stemple-type pipette (microzooplankters) and a Folsom splitter (me-sozooplankters) were analysed and at least 300 organ-isms counted [51]. Density was expressed as number
of individuals·100 m–3.
For the analyses of nutritional condition, individu-ally frozen larvae (n = 346) were thawed, identified and measured (to the nearest 0.1 mm). Nutritional condition was assessed using the RNA/DNA ratio.
Figure 1. Rivers Mira and Guadiana (south Portugal) showing the
Nucleic acids in individual fish larvae were quantified according to a modified procedure from Caldarone and
Buckley’s [13] fluorimetric method and using
ethidium bromide as the fluorophor (see [26] for protocol details).
2.4. Data analyses
Spearman rank correlation analysis [19] was used to identify relevant variables for subsequent analyses. Non-parametric correlation analyses do not presume that variables are normally distributed or assume any particular type of relationship between variables. The significance of r was corrected using the method of Bonferroni [69].
The relationships between larval density or nutri-tional condition and selected variables were studied using multiple regression analysis (forward stepwise method) [70]. For each estuary, data on the spatial and diel variation of larval nutritional condition was pooled in order to increase sample number. The significance of the calculated empirical models was assessed considering the coefficient of determination, partial coefficients of correlation and ANOVA results [79]. All the analyses were performed using SPSSt software package [70].
3. RESULTS
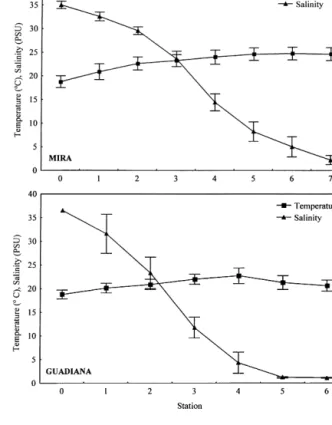
Surface temperature decreased steadily seaward from 27 °C at the upriver stations to about 15.5 °C (river Mira) and 13.9 °C (river Guadiana) near the river mouth. Conversely, salinity (0.6–37.4 PSU) (fig-ure 2) and Secchii depth (0.25–2.70 m) increased regularly towards stations #0.
3.1. Larval and zooplankton abundance
Densities of fish larvae during the day did not
exceed 40 ind·100 m–3, whereas values obtained
dur-ing diel collections were higher, particularly in the
Guadiana. Density maxima of about 45 and
85 ind·100 m–3were estimated for clupeids in the Mira
and Guadiana, respectively. Gobiidae and Blennidae larvae were irregularly more abundant with maximum
densities >300 ind·100 m–3. Estimated densities
var-ied greatly between sampling stations and rivers, sometimes by two orders of magnitude (table I). In both rivers, microzooplankton consisted almost
en-tirely of crustacean nauplii (often representing>80 %
of sample abundance), copepodites (8–27 %), and bivalve (7.5–32 %) and gastropod larvae (3–12 %) (table II). Diel sampling revealed contrasting micro-zooplanktonic composition between the estuaries. Bi-valve larvae, copepod nauplii and copepodites were
the most abundant taxa in the Mira (>83 % of total
abundance), while in the Guadiana copepod nauplii and gastropod larvae accounted for 81 % of total abundance (table II). The composition of mesozoo-planktonsamples was different between estuaries. In the Mira, mysids, decapods (zoea/mysis) and copepods-commonly represented about 5–40 % of sample abun-dance. Decapods and copepods were relatively more abundant during diel sampling. Conversely, hydrome-dusae represented about 40 % of daytime sample abundance and mysids were ten times more abundant in samples obtained during the day (table II). In the
Guadiana, copepods, cladocerans and decapods
(zoea/mysis) were the most abundant taxa. Copepods represented about 60 % of daytime sample abundance (ten times more abundant than in diel collections). Conversely, decapods (zoea/mysis) and cladocerans were more abundant during diel sampling (22 vs. 15 %). Mysids, decapod nauplii and chaetognats rep-resented each less than 10 % of total abundance (table II).
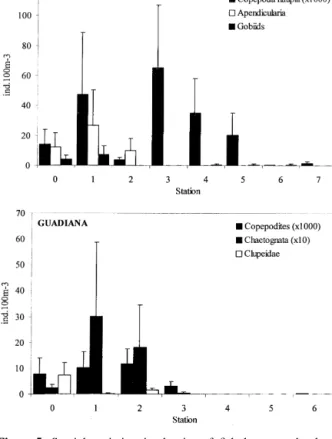
Clupeidae and Gobiidae larvae were more abundant near the mouth. In contrast, blennids occurred in higher densities in the upper reaches of the estuary
Figure 2. Spatial variation of surface temperature (°C) and salinity
(PSU) measured between March and September 1997 (mean±SE,
(<10 larvae·100 m–3) whereas atherinids were
col-lected infrequently (less than ten occurrences through-out the study period) (figure 3). Fish larvae were relatively more abundant during the night, particularly the gobiids and blennids which were collected in higher numbers at dawn and dusk (figure 4). The distributions of fish larvae and their potential prey
were seldom in counter-phase (figure 5), i.e. higher values of fish larvae corresponded to minima of potential prey abundance (figure 6, upper panel). In contrast, predators and larval fish distributions were frequently similar. This was particularly evident for gobiids-apendicularians (figure 5, upper panel) and clupeids-apendicularians/mysids (figure 6).
Table I. Density of fish larvae (individuals·100 m–3) in the Mira and Guadiana estuaries (March–September 1997). n, Number of stations/samples
in which larvae occurred. S and D denote spatial and diel sampling, respectively.
Mira Guadiana
nS Range nD Range nS Range nD Range
Clupeidae 7 2.1–33.3 18 1.4–44.4 20 1.8–85.2 Gobiidae 9 1.2–40.7 23 1.9–96.1 7 2.6–32.7 31 1.6–324.2 Blennida 12 1.1–10.5 12 1.8–310.4 2 1.4–7.1 23 1.6–324.2 Atherinidae 3 2.6–4.8 10 1.5–35.9 1 9 1.8–4.7
Table II. Percentage of total abundance of taxa occurring in the zooplankton samples collected in the Mira and Guadiana rivers (March–
September 1997).
Mira Guadiana
Microzooplankton:
Spatial sampling Copepoda nauplii >86 % Copepoda nauplii >80 % Gastropoda larvae 3 % Copepodites 8 %
Foraminifera 3 % Ciliata 7 %
Dinoflagellata 3 % Rotifera 2 %
Diel sampling Bivalve larvae 32 % Copepoda nauplii 69 % Copepodites 27 % Gastropoda larvae 12 % Copepoda nauplii 24 % Anelida larvae 7.5 % Anelida larvae 10 % Bivalve larvae 7.5 %
Hidrozoa 3 %
Gastropoda larvae 2 % Mesozooplankton:
Spatial sampling Hydromedusae 44 % Copepoda 57 %
Mysidacea 32 % Cladocera 14 %
Decapoda zoea/mysis 8 % Decapoda nauplii 8 % Decapoda nauplii 5 % Insecta 3 % Copepoda 5 % Decapoda zoea/mysis 4 % Chaetognata 3 % Diel sampling Decapoda nauplii 45 % Cladocera 22 %
Copepoda 20 % Decapoda zoea/mysis 15 % Decapoda zoea/mysis 16 % Mysidacea 8 %
Cladocera 6 % Copepoda 4 %
Mysidacea 3 % Hydrozoa 2 %
Thaliacea 2 % Chaetognata 1 %
Apendicularia 1.7 %
Larval densities were significantly correlated
(P<0.001) with temperature and the abundance of
several taxa of potential prey and predators.
Signifi-cant correlation coefficients varied between
–0.57 (gobiids-temperature) and 0.73
(clupeids-cladocerans), with most values within the range 0.40–0.60 (table III). The abundance distribution of clupeids was related to isopods, apendicularians, cla-docerans and chaetognats, and gobiids were correlated with temperature, apendicularians and cumaceans (figure 7). Most of the models included two or more independent variables and accounted for about 53 to 98 % of the variance of larval density, except the one describing clupeid abundance in the Guadiana, which only explained 31.5 % of the variance (table IV).
3.2. Larval condition
Mean RNA/DNA ratios varied between 2.98±0.36
(mean±standard error) for Blennidae in river Mira
and 8.15±0.65 for Clupeidae in river Guadiana.
Generally, values of the ratio averaged 3.5–5.5 (ta-ble V). RNA/DNA ratios correlated significantly
(P<0.001) with the abundance of several taxa of
potential prey (–0.46<r<0.55) and particularly with
the abundance of predators/competitors (0.39<
r<0.70). Significant correlation coefficients varied
between –0.46 (blennids-decapod nauplii) and 0.70 (clupeids-mysids) (table VI). Nevertheless, tempera-ture and the abundance of potential prey, namely dinoflagellates, crustacean nauplii, copepodites and bivalve larvae, constituted the majority of the indepen-dent variables included in the empirical models ob-tained using stepwise forward regression methods. Models explained about 43.1–95.5 % of the variance
of RNA/DNA (figure 8). Values of R2obtained were
higher for models calculated from data collected in the
Mira (R2≥0.732) than for the Guadiana (R2≥0.431)
(table VII).
4. DISCUSSION
4.1. Zooplankton abundance
This study indicated that temperature and salinity were important in determining larval abundance.
Tem-Figure 3. Spatial changes in density of fish larvae in the rivers Mira
and Guadiana (mean±SE, n = 8 and 7, respectively).
Figure 4. Diel variation of fish larvae at Vila Nova de Milfontes
(river Mira) and at Vila Real Santo António (river Guadiana). Pooled data from four 24-h sampling periods (mean±SE, n = 4).
perature and salinity are structuring variables of estu-aries [4, 74], establishing habitats and conditioning the behaviour of organisms, including the meroplanktonic fish larvae. Moreover, temperature has been linked to larval mortality [32], to larvae ecology [76], to the reproductive cycle of adults and spawning [35, 53], and to cycles of primary and secondary production of plankton [12]. Furthermore, the results presented herein are in agreement with those of Crecco and Savoy [23, 24], Robinson and Bain [61], Turner et al. [76] and Thiel et al. [74]. These authors also reported significant correlations between several abiotic param-eters, namely water temperature, salinity and flow, and larval abundance.
In both the Mira and Guadiana estuaries, larval abundance correlated significantly with the abundance of taxa described in the literature as potential prey, namely crustacean nauplii, copepodites and bivalve or gastropod larvae [40]. The positive correlations could result from the active search by fish larvae for patches of prey [39]. In fact, when present in patches of food, larvae tend to reduce swimming activity thus remain-ing within the aggregation, which corresponds to
area-restricted foraging [41, 78]. Also, fish larvae only perceive food items at a relatively short distance, less than one larval length for clupeids [7], and search less
than 10 L·d–1[36]. Hence, the presence of fish larvae
in patches of potential prey, depicted by the positive correlations obtained herein, might increase the en-counter probability and, therefore, enhance feeding success [44]. The spatial and diel distribution of fish larvae observed in this study is probably related to vertical and/or horizontal displacements as a function of potential prey. Fish larvae tend to aggregate at certain depths where food concentration is higher [29]. Sinclair and Iles [67] and Taggart and Leggett [73] reported independent spatial and temporal distribu-tions of Clupea harengus and Mallotus villosus larvae and their planktonic prey. In contrast, DeVries and Stein [25] and Stein et al. [71] observed coincident distributions of larval Dorossoma cepedianum and zooplankton. Recently, Hugie and Dill [38] developed a model of habitat selection and found that fish larvae (acting as predators) tend to be distributed as a function of productivity instead of prey abundance.
Figure 5. Spatial variation in density of fish larvae and relevant
planktonic taxa (potential prey and predators) in the rivers Mira and Guadiana (mean±SE, n = 8 and 7 respectively).
Figure 6. Diel changes in density of clupeids and relevant prey and
predator taxa at Vila Nova de Milfontes (river Mira) and Vila Real de Santo António (river Guadiana). Pooled data from four 24-h sampling periods (mean±SE, n = 4).
This hypothesis could account for the unexplained portion of the variance in the models calculated and should be tested both in experimental conditions and in situ.
The larval abundance distribution in both estuaries considered in this study also correlated significantly with the abundance of several taxa referred in the literature as invertebrate predators of fish eggs and larvae (see [3] for a review). The co-occurrence of predators and larvae might constitute a trophic advan-tage for predators and potentially increase their preda-tory efficiency on fish larvae [31, 58]. On the other hand, significant positive correlations could be due to similar patterns of feeding [2] or to comensalism [8]. In fact, hydromedusae with fish eggs and larvae inside the manubrium occurred in a number of samples. Moller [49] and van der Veer [77] reported similar occurrences. Nonetheless, it is not possible to exclude
the hypothesis that feeding was stimulated by the over-concentration of the sample in the cod-end of the net. However, Moller [49] and Suthers and Frank [72] stressed the predatory potential of those taxa based on negative correlations between the abundance of preda-tors and prey. Frank and Leggett [32] criticised these evidences and claimed that the inverse relationships could reflect the adaptive responses of larvae or the historical impact of predation on the reproductive behaviour of adults. Moreover, despite their impor-tance in several ecosystems [2, 46, 49, 57, 65], the abundance of hydromedusae and chaetognats were poorly correlated with the abundance of fish larvae
(r<0.50). The massive occurrence of hydromedusae
in some stations resulted in the rapid clogging of the net. This could have contributed to the under-estimation of the densities of other zooplankters, thus reducing the number of significant correlations.
Table III. Significant Spearman correlation coefficients (r) obtained for the relationships between ichthyoplankter abundance and several
variables. (All r have P<0.001 exceptawhere P<0.05).
River Spatial sampling Diel sampling
Relationship r Relationship r
Mira Gobiidae-Temperature –0.57 Clupeidae-Temperature –0.55 Gobiidae-Apendicularia 0.53 Clupeidae-Cirripedia
nau-plii 0.47 Blennidae-Chaetognata 0.50 Clupeidae-copepodites 0.55 Clupeidae-Gastropoda lar-vae –0.46 Clupeidae-Pelecypoda lar-vae 0.44 Clupeidae-Cladocera 0.73 Clupeidae-Copepoda 0.53 Clupeidae-Isopoda 0.38a Clupeidae-Decapoda nau-plii 0.59 Clupeidae-Apendicularia 0.59 Gobiidae-Amphipoda 0.49 Guadiana Clupeidae-Annelida larvae 0.39 Clupeidae-Cumacea 0.47 Clupeidae-Copepodites 0.39 Clupeidae-Mysidacea 0.42 Clupeidae-Pelecypoda lar-vae 0.39 Clupeidae-Amphipoda 0.47 Clupeidae-Hydromedusae 0.40 Gobiidae-Salinity 0.51 Clupeidae-Chaetognata 0.49 Atherinidae-Temperature –0.144a
Clupeidae-Mysidacea 0.51 Athernidae-Polychaeta lar-vae 0.58 Clupeidae-Apendicularia 0.54 Gobiidae-Cumacea 0.37 Gobiidae-Mysidacea 0.43 Blennidae-Ostracoda 0.35
Our results (cf. tables III, IV) suggest that predation in association with temperature are the major factors controlling the abundance distribution of fish larvae. Nevertheless, significant correlations might reflect the similar feeding strategies or the collection method used for both larvae and their invertebrate predators. Interestingly, hydromedusae were not significant co-variates in the equations, although they were very representative taxa of the mesozooplankton
commu-nity, especially in the Mira estuary (>40 % of total
abundance, cf. table II). Most of those organisms were less than 80 mm in diameter and therefore their impact on the larvae should be considered [65]. However, the occurrence of hydromedusae and fish larvae could be mutually exclusive, i.e. it could reflect adaptive re-sponses of fish larvae and adults to aggregations of potential predators [32]. Nevertheless, some of the associations of animals in the net could be coinciden-tal, depending on the length of the tow, and the organisms may have not been together in the water column.
4.2. Larval condition
Temperature was negatively correlated with
RNA/DNA ratios when integrated in multiple regres-sions. This could be due to the reduced activity of ribosomes at lower temperatures, and the higher con-tent of RNA required to maintain the same activity level [11] whereas the DNA content stays unchanged. In contrast to our findings, McGurk et al. [48] found no relationship between RNA/DNA ratios and prey concentration or temperature.
The nutritional condition of fish larvae correlated more significantly with indicators of potential prey abundance. Better feeding conditions in terms of prey density and food type usually determine enhanced growth rates and nutritional condition [5, 9, 14, 45]. However, in order to estimate prey densities, it is necessary to make a preliminary study of the type of organisms consumed by larvae. In this study, results published elsewhere [7, 17, 20, 22, 27, 40, 54] were used to establish a compatible method of collection (cf. Materials and Methods). As a result, a reasonable number of organisms, considered as potential prey, were found in most of the samples collected. More-over, the number of significant correlations obtained herein supports the methodology chosen for studying microzooplankton.
Significant correlations obtained between fish larvae condition and the abundance of potential predators (cf. tables VI, VII) could be related to predation on energy-rich larvae or larvae in poorer condition. In the first case, the negative correlations would reflect the re-moval of larvae with higher RNA/DNA ratios. On the other hand, the diminished ability of larvae in poorer condition to escape predators, feed and compete for food items accelerates the starvation process and could be responsible for the positive correlations. Frank and Leggett [32] argued that the spawning strategy of fish avoids areas of higher predator abundance, and criti-cised the methods based on simultaneous collection of larvae and invertebrate predators. Herein, the exclu-sive occurrence of hydromedusae in some stations of the Mira estuary might be an example of the
afore-Figure 7. Surface plots for the relationships between fish larvae
abundance and correlated variables in the Mira and Guadiana estuaries (A, clupeids/diel sampling, river Mira; B, clupeids/spatial sampling, river Guadiana; C, gobiids/spatial sampling, river Mira) (see table IV for equations).
mentioned strategy. However, other taxa of potential predators correlated significantly with larval condition and integrated the empirical models calculated. Few studies have dealt simultaneously with field-caught fish larvae and their potential predators [3]. Therefore, the influence of experimental conditions [56] and the difficulty of studying natural mortality caused by predation, because different taxa can act on larvae and might not be collected by the gear, are among the most common criticisms of predation experiments.
In this study, the variability of larval nutritional condition seems related more closely to prey availabil-ity than with the other variables. Buckley et al. [9] also presented a number of equations relating indices of condition of cultivated Ammodytes americanus larvae with temperature and prey density. Conversely, McGurk et al. [48] and Canino [15] showed that the influence of prey availability on the variability of RNA/DNA ratios was negligible and that predation would be an additional and seasonal factor of impor-tance. Recently, Chícharo [18] presented a polynomial equation including temperature and the density of chaetognats, which accounted for 80 % of the variance of RNA/DNA ratios of Sardina pilchardus larvae.
Frank [30] pointed out that the use of a single net to sample both zooplankton and fish larvae might
ob-scure eventual ecological links. Herein, two nets with different mesh-size were used to overcome sampling bias. Moreover, according to Fortier and Leggett [29], simple correlation analyses are insufficient to study the relationships between fish larvae and zooplankton. However, in this study, the information obtained from correlation analysis is presented as a contribution to assess the relative importance of variables in determin-ing the general distribution and the nutritional condi-tion of fish larvae. These results should be taken into consideration in future work in these estuaries or similar temperate ecosystems.
In summary, the distribution of fish larvae seems conditioned by temperature and predation pressure, whereas their nutritional condition is dependent on
Table IV. Regression models obtained for ichthyoplankton abundance vs. relevant abiotic/biotic variables. S and D denote spatial and diel
sampling, respectively. n, Sampling size. A, apendiculareans; C, copepodites; CL, cladocerans; CLA, cladocerans (>500 mm); CUM, cumaceans; HH, hydromedusae (>500 µm); I, isopods; Q, chaetognats; T, temperature; TA, thaliaceans. All regressions significant: ***, P<0.001.
Model n R2 F
MiraS [Blennids] = –0.108 + 0.479(Q) – 0.012(TA) 40 0.931 249.7***
[Gobiids] = 9.713 – 0.04(T) + 0.189(A) 32 0.739 41.09*** log[Gobiids] = 0.884 – 0.037(T) + 0.377·log(A) 32 0.631 24.77*** MiraD log[Clupeids] = –0.704 + 0.227·log(I) + 0.368·log(CLA) 52 0.559 31.06***
log[Clupeids] = 0.354 – 0.052(T) + 0.222·log(I) + 0.324·log(CL) 52 0.575 21.64*** log[Clupeids] = 0.493 + 0.199·log(A) + 0.305·log(CLA) 52 0.588 35.02*** GuadianaS log[Clupeids] = –0.155 + 0.293(HH) + 7.5·10–5(C) 56 0.787 97.70***
log[Clupeids] = 0.024 + 0.22·log(Q) 74 0.315 33.05***
Table V. Nutritional condition of fish larvae (RNA/DNA ratios)
from the Mira and Guadiana estuaries (March–September 1997). n, Number of individuals analysed. Values are mean±standard error.
Mira Guadiana n Ratio n Ratio Clupeidae 17 5.54±0.77 37 8.15±0.65 Gobiidae 80 5.54±0.38 69 3.79±0.32 Blennidae 22 2.98±0.36 63 3.42±0.31 Atherinidae 14 4.84±0.87 34 4.20±0.42
Table VI. Significant Spearman correlation coefficients (r) obtained
for the relationships between ichthyoplankters nutritional condition (pooled data) and several taxa (***, P<0.001).
River Family Taxa r
Guadiana Clupeidae Copepod nauplii 0.53*** Cumacea 0.63*** Mysidacea 0.70*** Amphipoda 0.52*** Blennidae Dinoflagellata 0.44*** Annelid larvae –0.39*** Copepod nauplii 0.55*** Decapod nauplii –0.46*** Pelecypoda larvae –0.40*** Hydromedusae 0.62*** Cladocera 0.39*** Cumacea 0.56*** Amphipoda 0.63*** Decapoda 0.60*** Gobiidae Gastropoda 0.48***
temperature and prey availability. These latter relation-ships are further controlled by predation, through its effect on larval mortality. The multiple linear
regres-sions obtained herein for density distribution
(R2≥0.315) and larval condition (R2≥0.431) seem to
corroborate these hypotheses. Considering the issues of accuracy and precision aforementioned, our analy-ses are intended to be indicative of general trends and relative importance of environmental and biological factors. In future studies, both sample number and frequency should be increased together with the use of unconventional statistical analysis (e.g. multiple non-linear estimations or generalised additive models). This will provide further insight into the mechanisms that regulate fish early-life history stages and recruit-ment.
Acknowledgments
This work was funded by Programa PRAXIS XXI (ref. 3/3.2/CA/1981/95). E. Esteves benefited from a grant from Pro-grama PRAXIS XXI (ref. BM/8427/96). Partial support for sam-pling in the Guadiana estuary was provided by Programa INTER-REG II (ref. 15/INTER-REG II/2/96). This manuscript benefited from the comments and suggestions of Dr Graham Pierce (University of Aberdeen) and two anonymous referees.
REFERENCES
[1] Antunes M.M., Cunha P.L., Duarte A.P., Mendonça E.P., Ria de Alvor as a spawning place and a nursery ground, J. Fish Biol. 33 (Suppl. A) (1988) 185–190.
[2] Baier C.T., Purcell J.E., Trophic interactions of chaetognats, larval fish, and zooplankton in the South Atlantic Bight, Mar. Ecol. Prog. Ser. 146 (1997) 43–53.
[3] Bailey K.M., Houde E.D., Predation on eggs and larvae of marine fishes and the recruitment problem, Adv. Mar. Sci. 25 (1989) 1–83.
[4] Bain M.B., Finn J.T., Booke H.E., Streamflow regulation and fish community structure, Ecology 69 (1988) 382–392. [5] Battini M.A., Alonso M.F., Cussac V.E., Growth and
nutri-tional condition of the larvae of Odontesthes microlepidotus (Atherinidae): an experimental approach, Env. Biol. Fish. 42 (1995) 391–399.
[6] Bergeron J.P., Nucleic acids in ichthyoplankton ecology: a review, with emphasis on recent advances for new perspec-tives, J. Fish Biol. 51 (Suppl. A) (1997) 284–302.
[7] Blaxter J.H.S., Hunter J.R., The biology of clupeoid fishes, Adv. Mar. Biol. 20 (1982) 1–223.
[8] Brodeur R.D., In situ observations of the association between juvenile fishes and scyphomedusae in the Bering Sea, Mar. Ecol. Prog. Ser. 163 (1998) 11–20.
[9] Buckley L.J., Turner S.I., Halavik T.A., Smigielski A.S., Drew S.M., Laurence G.C., Effects of temperature and food availability on growth, survival, and RNA-DNA ratio of larval sand lance (Ammodytes americanus), Mar. Ecol. Prog. Ser. 15 (1984) 91–97.
[10] Bulow F., RNA-DNA ratios as indicators of recent growth rates of a fish, J. Fish. Res. Board Can. 27 (1970) 2343–2349. [11] Bulow F., RNA-DNA ratios as indicators of growth in fish: A review, in: Summerfelt R.C., Hall G.E. (Eds.), Age and
Figure 8. Scatterplots and surface plots for the relationships between
the nutritional condition of fish larvae and correlated variables (see
table VII for equations) in the Mira and Guadiana estuaries (A,
clupeids, river Mira; B, blennids, river Guadiana; and C, clupeids, river Guadiana).
Growth of Fish, Iowa State University Press, Ames, Iowa, 1987, pp. 45–64.
[12] Buskey E.J., Annual pattern of micro- and mesozooplankton abundance and biomass in a subtropical estuary, J. Plankton Res. 15 (1993) 907–924.
[13] Caldarone E.M., Buckley L.J., Quantitation of DNA and RNA in crude tissues extracts and flow injection analysis, Anal. Biochem. 199 (1991) 137–141.
[14] Canino M.F., Effects of temperature and food availability on growth and RNA/DNA ratios of walleye pollock Theragra
chalcogramma (Pallas) eggs and larvae, J. Exp. Mar. Biol.
Ecol. 175 (1994) 1–16.
[15] Canino M.F., Nucleic acid contents and growth of first-feeding walleye pollock larvae in response to prey densities typical of sub-Artic ecosystems, J. Fish Biol. 51 (1997) 41–52. [16] Chícharo L.M.Z., Contribuição para o estudo do ictioplâncton
no estuário do Guadiana, Graduation thesis, University of Algarve, Faro, 1988, 75 p.
[17] Chícharo M.A., Starvation percentages in field caught Sardina
pilchardus larvae off southern Portugal, Sci. Mar. 61 (1997)
507–516.
[18] Chícharo M.A., Nutritional condition and starvation in
Sar-dina pilchardus (L.) larvae off southern Portugal compared
with some environmental factors, J. Exp. Mar. Biol. Ecol. 225 (1998) 123–137.
[19] Conover W.J., Practical Nonparametric Statistics, 2nd ed., John Wiley & Sons, New York, 1980, 493 p.
[20] Conway D.V.P., Coombs S.H., Férnandez de Puelles M.L.F., Tranter P.R.G., Feeding of larval sardine, Sardina pilchardus (Walbaum), Bol. Inst. Esp. Oceanogr. 10 (1994) 165–175. [21] Costa M.J., Bruxelas A., Rosado D., Ictiofauna do estuário do
Mira, abundância e diversidade, 2º Congresso sobre o Alentejo, Beja, I, 1987, pp. 226–230.
[22] Crecco V.A., Blake M.M., Feeding ecology of coexisting larvae of American shad and blueback herring in the Connecti-cut River, Trans. Am. Fish. Soc. 112 (1983) 498–507. [23] Crecco V.A., Savoy T.F., Effects of fluctuations in
hydro-graphic conditions on year-class strength of American shad
(Alosa sapidissima) in the Connecticut River, Can. J. Fish. Aquat. Sci. 41 (1984) 1216–1223.
[24] Crecco V.A., Savoy T.F., Effects of biotic and abiotic factors on growth and relative survival of young American shad,
Alosa sapidissima, in the Conneticut River, Can. J. Fish.
Aquat. Sci. 42 (1985) 1448–1640.
[25] DeVries D.R., Stein R.A., Complex interactions between fish and zooplankton: quantifying the role of an open-water planktivore, Can. J. Fish. Aquat. Sci. 49 (1992) 1216–1227. [26] Esteves E., Pina T., Chícharo M., Coelho M.L., Andrade J.P.,
Comparison of RNA/DNA ratios obtained with two methods for nucleic acid quantification in gobiid larvae, J. Exp. Mar. Biol. Ecol. 245 (2000) 43–55.
[27] Ferreira P.L., Ré P., Feeding of larval anchovy, Engraulis
encrasicolus (L.), in the Mira Estuary (Portugal), Port. Zool. 2
(1993) 25–37.
[28] Fives J.M., Blennidae of the North Atlantic (revised), Identi-fication sheets on fish eggs and larvae, ICES 172 (1986) 6 p. [29] Fortier L., Leggett W.C., Small-scale covariability in the abundance of fish larvae and their prey, Can. J. Fish. Aquat. Sci. 41 (1984) 502–512.
[30] Frank K.T., Independent distribution of fish larvae and their prey: natural paradox or sampling artefact, Can. J. Fish. Aquat. Sci. 45 (1988) 48–59.
[31] Frank K.T., Leggett W.C., Environmental regulation of growth rate, efficiency and swimming performance in larval capelin (Mallotus villosus) and its application to the match/mismatch hypothesis, Can. J. Fish. Aquat. Sci. 39 (1982) 691–699. [32] Frank K.T., Leggett W.C., Reciprocal oscillations in densities
of larval fish and potential predators: a reflection of present or past predation, Can. J. Fish. Aquat. Sci. 42 (1985) 1841–1849. [33] Hjort J., Fluctuation in the great fisheries of northern Europe. Viewed in the light of biological research, Rapp. P.-v. Reun. Cons. Perm. Int. Explor. Mer 20 (1914) 1–228.
[34] Hjort J., Fluctuations in year classes of important food fishes, J. Cons. Perm. Int. Explor. Mer 1 (1926) 5–38.
[35] Holmes R.H.A., Henderson P.A., High fish recruitment in the
Table VII. Regression models obtained for RNA/DNA ratios vs. relevant abiotic/biotic variables. n, Sampling size (AN, annelid larvae; C,
copepodites; CC, copepod nauplii; CIL, ciliates; CR, cirriped nauplii; CUM, cumaceans; D, decapod nauplii; DD, decapod (zoea/mysis); DN, dinoflagellates; HH, hydromedusae (>500 mm); PL, bivalve larvae; PREY, pooled prey; T, temperature. All regressions significant: ***,
P<0.001). Model n R2 F Mira Clupeidae RNA/DNA = 58.608 + 0.0053(D) – 3.227·T –0.00003(C) + 0.00029(CC) 17 0.955 64.26*** RNA/DNA = 7.55 – 0.0004(CR) – 3.80·T + 0.0061(D) 16 0.948 73.39*** RNA/DNA = 2.849 + 0.972(CR) 18 0.859 97.34*** RNA/DNA = 4.59 + 0.001(CC) + 0.00012(PL) – 7·10–5(PREY) 16 0.732 10.93*** Guadiana Clupeidae RNA/DNA = 10.28 + 0.0022(DD) – 0.449·T 35 0.639 28.28*** RNA/DNA = 0.369 + 0.00259(DD) + 0.0092(D) 33 0.654 28.34*** Blennidae RNA/DNA = 1.642 + 0.0002(DN) + 5·10–6(CC) 60 0.431 21.59*** RNA/DNA = 1.638 + 0.0109(HH) – 0.296(CUM) 60 0.436 22.00*** RNA/DNA = 1.654 + 4·10–6(CC) + 0.002(HH) 60 0.434 21.82***
Severn Estuary: the effect of a warm year? J. Fish Biol. 36 (1990) 961–963.
[36] Houde E.D., Micro- and fine-scale biology, in: Rothshild B.J., Rooth C.G.H. (Eds.), Fish Ecology III. A foundation for REX - A Recruitment Model, Technical Report No. 82008, Univer-sity of Miami, Miami, 1982, pp. 96–122.
[37] Houde E.D., Patterns and trends in larval-stage growth and mortality of teleost fish, J. Fish Biol. 51 (Suppl. A) (1997) 52–83.
[38] Hugie D.M., Dill L.M., Fish and game: a game theoretic approach to habitat selection by predators and prey, J. Fish Biol. 45 (Suppl. A) (1994) 151–170.
[39] Hunter J.R., Report on a colloquium on larval fish mortality studies and ther relation to fishery research. January 1975, Natl. Oceanic Atmos. Adm. Tech. Rep. NMFS CIRC. 395 (1976) 5 p.
[40] Hunter J.R., Feeding ecology and predation of marine fish larvae, in: Lasker R. (Ed.), Marine Fish Larvae. Morphology, Ecology and Relation to Fisheries, Washington Sea Grant Program, Washington, 1981, pp. 33–79.
[41] Hunter J.R., Thomas G.L., Effect of prey distribution and density on the searching and feeding behaviour of larval anchovy Engraulis mordax Girard, in: Blaxter J.H.S. (Ed.), The Early Life History of Fish, Springer-Verlag, New York, 1974, pp. 559–574.
[42] Knox G.A., Estuarine ecosystems: a systems approach, vol. 1, CRC Press Inc., Boca Raton FL, 1986, 289 p.
[43] Lasker R., Field criteria for survival of anchovy larvae: the relation between inshore chlorophyll maximum layers and successful first feeding, Fish. Bull. U. S. 73 (1975) 453–462. [44] Laurence G.C., Nutrition and trophodynamics of larval fish -review, concepts, strategic recommendations and opinions, in: Rothshild B.J., Rooth C.G.H. (Eds.), Fish Ecology III. A foundation for REX - A Recruitment Model, Technical Report no. 82008, University of Miami, Miami, 1982, pp. 123–171. [45] Martin F.D., Wright D.A., Means J.C., Setzler-Hamilton E.M., Importance of food supply to nutritional state of larval striped bass in the Potomac river estuary, Trans. Am. Fish. Soc. 114 (1985) 137–145.
[46] Matsakis S., Conover R.J., Abundance and feeding of medu-sae and their potential impact as predators on other zooplank-ton in Bedford Basin (Nova Scotia, Canada) during Spring, Can. J. Fish. Aquat. Sci. 48 (1991) 1419–1430.
[47] Mclusky S.D., The Estuarine Ecosystem, Blackie, Glasgow and London, 1989, 215 p.
[48] McGurk M.D., Warburton H.D., Galbraith M., Kusser W.C., RNA-DNA ratio of herring and sand lance larvae from Port Moller, Alaska. Comparison with prey concentration and temperature, Fish. Oceanogr. 1.3 (1992) 193–207.
[49] Moller H., Reduction of a larval herring population by jellyfish predator, Science 224 (1984) 621–622.
[50] Newell G.E., Newell R.C., Marine Plankton, a Practical Guide, 5th ed., Hutchinson of London, London, 1963, 244 p. [51] Omori M., Ikeda T., Methods in Marine Zooplankton Ecology,
Krieger Publishing Company, Florida, 1992, 279 p. [52] Palmer C.J., Culley M.B., The egg and early life stages of the
sandsmelt, Atherina presbyter Cuvier, J. Fish Biol. 24 (1984) 537–544.
[53] Palomera I., Spawning of anchovy Engraulis encrasicolus in the Northwestern Mediterranean relative to hydrographic features in the region, Mar. Ecol. Prog. Ser. 79 (1992) 215–223.
[54] Pepin P., Penney R.W., Patterns of prey size and taxonomic
composition in larval fish: are there general size-dependent models? J. Fish Biol. 51 (Suppl. A) (1997) 84–100. [55] Pestana M.G., Manancial ibérico-atlântico de sardinha
(Sardinha pilchardus, Walb.) sua avaliação e medidas de gestão, Unpubl. dissertation, Instituto Nacional de Investi-gação Científica, Lisboa, 1989, 192 p.
[56] Peterson C.H., Black R., An experimentalist’s challenge: when artefacts of intervention interact with treatments, Mar. Ecol. Prog. Ser. 11 (1994) 289–297.
[57] Purcell J.E., Soft-bodied zooplankton predators and competi-tors of larval herring (Clupea harengus pallasi) at herring spawning grounds in British Columbia, Can. J. Fish. Aquat. Sci. 48 (1990) 505–515.
[58] Purcell J.E., Grover J.J., Predation and food limitation as causes of mortality in larval herring at a spawning ground in British Columbia, Mar. Ecol. Prog. Ser. 59 (1990) 55–61. [59] Ré P., Ictioplâncton da região central da costa portuguesa e do
estuário do Tejo. Ecologia da postura e da fase planctónica de
Sardina pilchardus (Walbaum, 1792) e de Engraulis encrasi-colus (Linné, 1758),Ph.D. thesis (Ed.), Faculty of Sciences
University of Lisbon, Lisbon, 1984, 425 p.
[60] Ré P., Farinha A., Meneses I., Anchovy spawning in Portu-guese estuaries (Engraulis encrasicolus, Pisces: Engraulidae), Cybium 7 (1983) 29–38.
[61] Robinson C.L., Bain M.B., Determinants of estuarine nursery habitat for fish, in: Magoon O.T., Converse H., Miner D., Tobin T., Clark D. (Eds.), Coastal Zone ’89, vol. 2, American Society of Civil Engineers, New York, 1989, pp. 997–1010. [62] Russell F.S., The Eggs and Planktonic Stages of British
Marine Fishes, Academic Press, London, 1976, 524 p. [63] Saville A., Clupeiodae, Identification sheets on fish eggs and
larvae, ICES 1 (1964) 5.
[64] Scheidegger K.J., Bain M.B., Larval fish distribution and microhabitat use in free-flowing and regulated rivers, Copeia 1995 (1995) 125–135.
[65] Schneider G., Behrends G., Population dynamics and the trophic role of Aurelia aurita medusae in the Kiel Bight and western Baltic, ICES J. Mar. Sci. 51 (1994) 359–367. [66] Sinclair M., Marine Populations. An Essay on Population
Regulation and Speciation, Books in Recruitment Fishery Oceanography, Washington Sea Grant, Washington, 1988, 252 p.
[67] Sinclair M., Iles T.D., Atlantic herring (Clupea harengus) distributions in the Gulf of Maine-Scotian shelf area in relation to oceanographic features, Can. J. Fish. Aquat. Sci. 42 (1985) 872–880.
[68] Smith D.L., A Guide to Marine Coastal Plankton and Marine Invertebrate Larvae, Kendall/Hunt Company, Dubuque-Iowa, 1977, 161 p.
[69] Snedecor G., Cochran W., Statistical Methods, Iowa State University Press, Ames-Iowa, 1982, 503 p.
[70] SPSS Inc., SPSS for Windows Release 10.0.5. Standard version, (Software package and Manual), SPSS Inc., Chicago, 1999.
[71] Stein R.A., DeVries D.R., Dettmers J.M., Food-web regula-tion by a planktivore: exploring the generality of the trophic cascade hypothesis, Can. J. Fish. Aquat. Sci. 52 (1995) 2518–2526.
[72] Suthers I.M., Frank K.T., Zooplankton biomass gradient off south-western Nova Scotia: nearshore ctenophore predation or hydrographic separation? J. Plankton Res. 12 (1990) 831–850. [73] Taggart C.T., Leggett W.C., Short-term mortality in post-emergent larval capelin Mallotus villosus. II. Importance of
food and predator density, and density-dependence, Mar. Ecol. Prog. Ser. 41 (1987) 219–229.
[74] Thiel R., Sepúlveda A., Kafemann R., Nellen W., Environ-mental factors as forces structuring the fish community of the Elbe Estuary, J. Fish Biol. 46 (1995) 47–69.
[75] Todd C.D., Laverack M.S., Coastal Marine Zooplankton. A Practical Manual for Students, Cambridge University Press, Cambridge, 1991, 159 p.
[76] Turner T.F., Trexler J.C., Miller G.L., Toyer K.E., Temporal and spatial dynamics of larval and juvenile fish abundance in a temperate floodplain river, Copeia 1994 (1994) 174–183.
[77] van der Veer H.W., Impact of coelenterate predation on larval plaice Pleuronectes platessa and flounder Platichthys flesus in the western Wadden Sea, Mar. Ecol. Prog. Ser. 25 (1985) 229–238.
[78] Wyatt T., Some effects of food density on the growth and behaviour of plaice larvae, Mar. Biol. 14 (1972) 210–216.
[79] Zar J.H., Biostatistical Analysis, 3rd ed., Prentice Hall Inter-national Editions, NJ, 1996.