KERING’S VALUATION
Maria Anjos Lopes dos Reis Braga
Project submitted as partial requirement for the conferral of
Master in Finance
Supervisor:
Prof. Pedro Manuel de Sousa Leite Inácio, ISCTE Business School, Finance Department
I
Resumo
O presente projecto tem como objectivo a avaliação da empresa Kering, com vista a chegar a um preço-alvo e fazer uma recomendação de investimento.
A Kering é uma empresa multinacional francesa que opera no sector dos bens de luxo e está presente em todo o mundo. A empresa está dividida em duas divisões: a divisão de luxo e a de desporto e estilo de vida, possuindo um portfolio diversificado de marcas bem conhecidas, como a Gucci, Yves Saint Laurent, PUMA, entre outras. Nos últimos anos, a Kering tem passado por um processo de reestruturação com a venda de todas as empresas do segmento de retalho, com o objectivo de se tornar num grupo mais coeso, integrado e internacional.
Para avaliar a empresa foram escolhidos o Método de Fluxo de Caixa Descontado e o Método dos Múltiplos de Mercado. Para tal, é necessário analisar cuidadosamente os fundamentais da empresa, assim como estimar as principais variáveis.
Todas as análises e projecções foram elaboradas com a informação disponível até Dezembro de 2013.
Através do desenvolvimento do modelo de avaliação, chegou-se a um valor de € 184.50 por acção, que comparado com o valor de mercado de € 153.65 à data de 31 de Dezembro de 2013, significa que a Kering estava a negociar com um desconto de 20%. Desta forma, a recomendação de investimento seria então de compra da acção.
Palavras-chave: Kering, Bens de Luxo, Método de Fluxo de Caixa Descontado, Múltiplos JEL Classification System: G30, G32
II Abstract
The present project aims to evaluate Kering company in order to make an investment recommendation.
Kering is a French multinational holding company, with a worldwide presence. The company operates in the luxury goods sector and is divided into two divisions - the Luxury Division and the Sport & Lifestyle Division - having a wide brand portfolio with some well-known brands like Gucci, Yves Saint Laurent, PUMA, among others. Through the past years, Kering has been restructuring itself to become a more cohesive, integrated and international Group. In order to see if the company is trading at a premium or at a discount, the company’s fundamentals are deeply evaluated and the main variables are estimated to apply Discounted Cash Flow and Market Multiples Method. The purpose is to reach a price target and to make an investment decision.
All the analysis and projections were only prepared with the information available until December 2013.
The valuation model points to a value of € 184.50 per share, which compared to the market value of € 153.65, in 31th
December 2013, meaning that Kering share was trading at a discount of 20%. Thus, and according to this analysis, the investment recommendation at that time would have been to buy the share.
Keywords: Kering, Luxury Goods, Discounted Cash Flow, Multiples JEL Classification System: G30, G32
III Acknowledgements
I would like to thank all the people that helped and supported me in the elaboration of the present project.
In particular, I want to thank to my supervisor Pedro Leite Inácio, for all his comments, advices and share of knowledge that helped to improve my project.
I also could not stop thanking to BPI Asset Management for all the availability of resources and particularly to my colleagues João Caro Sousa, José Duarte Mendes, Ana Luísa Aguiar and Duarte Carlos Rodrigues, for all their accessibility and for helping me go through this project until its end.
Lastly but not least, thank you to my family and friends that have supported me and encouraged me to do not give up and to always do my best.
IV Index Resumo ... I Abstract ... II Acknowledgements ... III Index ... IV List of Tables and Figures ... V List of Abbreviations ... VII
Executive Summary/Introduction ... 1
1. Revision of Existing Literature ... 3
2. Industry Analysis ... 16
2.1. Macroeconomic Outlook ... 16
2.2. Luxury Goods Market ... 16
2.3. Sport & Lifestlyle Market... 28
3. Company Overview and Outlook ... 30
3.1. Company Description ... 30
3.2. Strategy ... 33
3.3. Brands ... 34
4. Company Valuation ... 61
4.1. Projections ... 61
4.2. Discounted Cash Flow Method – Target Price ... 66
4.3. Market Multiples Method ... 67
4.4. Risks ... 68
4.5. Sensitivity Analysis ... 69
5. Conclusion ... 71
6. Bibliography ... 73
V List of Tables and Figures
FIGURE 1 – GDP 2000-2018E ... 16
FIGURE 2 –Inflation 2000-2018E ... 16
FIGURE 3 – Luxury market breakdown by segment 2012 ... 16
FIGURE 4 – European Luxury Goods Sector ... 17
FIGURE 5 – Worldwide personal luxury goods market trend (1995-2013E|€B) ... 18
FIGURE 6 –Luxury LFL and global GDP = 0.9... 18
FIGURE 7 – Worldwide personal luxury goods market by category (€b) ... 19
FIGURE 8 – Worldwide personal luxury goods market by channel (€b) ... 19
FIGURE 9 – Worldwide personal luxury goods market by region (€b) ... 20
FIGURE 10 – Share of sales to tourist vs domestic by European major country (2013E) ... 20
FIGURE 11 – China Luxury Goods Market by segment trend (2013E) ... 21
FIGURE 12 –Luxury Goods Market by consumer nationality (1995-2013€b) ... 21
FIGURE 13 –Luxury Goods Market by consumer nationality (2013€b) ... 22
FIGURE 14 – Top 10 nations by amount spent ... 22
FIGURE 15 – Main categories in share of amount spend 2012 ... 22
FIGURE 16 –Luxury goods market trend ... 23
FIGURE 17 – Share of global luxury market ... 23
FIGURE 18 – Contribution to luxury growth ... 23
FIGURE 19 – Chinese outbound travel forecasts ... 24
FIGURE 20 – Household disposable income by income group ... 25
FIGURE 21 – Income Class of Chinese Population ... 25
FIGURE 22 – GDP per capita by region ... 26
FIGURE 23 – Global Blue y/y worldwide spend growth % ... 26
FIGURE 24 – Global Consumption (trillion USD) ... 27
FIGURE 25 – Worldwide Sport & Lifestyle market trend (2006-2012, in € billions) ... 28
FIGURE 26 – Worldwide Sport & Lifestyle market: breakdown by category ... 28
FIGURE 27 – Worldwide Sport & Lifestyle market: breakdown by region ... 29
FIGURE 28 – Shareholders Structure 2012 ... 31
FIGURE 29 – Revenues vs reported growth (%) ... 32
FIGURE 30 – EBIT vs EBIT margin (%) ... 32
FIGURE 31 – Dividend per Share ... 32
FIGURE 32 – Solvency (Net debt/EBITDA) ... 32
FIGURE 33 – Revenues breakdown by division ... 32
FIGURE 34 – EBIT breakdown by division ... 32
FIGURE 35 – Revenues breakdown by brand 2012 ... 33
FIGURE 36 - EBIT breakdown by brand 2012 ... 33
FIGURE 37 – Revenues breakdown by region ... 33
FIGURE 38 – Gucci: Revenues vs Organic growth (%) ... 34
FIGURE 39 – Gucci: EBIT vs EBIT margin (%) ... 34
FIGURE 40 - Gucci: Revenues breakdown by product category 2012 ... 35
FIGURE 41 – Gucci: Logo vs No-logo handbags ... 35
FIGURE 42 – Gucci: Handbags sales breakdown by materials ... 35
FIGURE 43 – Gucci: Handbags sales breakdown by price category ... 36
FIGURE 44 – Gucci: Revenues breakdown by region 2012 ... 36
FIGURE 45 – Gucci: Logo % handbags sales by region ... 37
FIGURE 46 – Gucci: Revenues breakdown by distribution ... 38
FIGURE 47 – BV: Revenues breakdown by region 2012 ... 41
VI
FIGURE 49 – BV: EBIT vs EBIT Margin (%) ... 42
FIGURE 50 – BV: Revenues breakdown by product category ... 42
FIGURE 51 – Soft luxury product breakdown by brand ... 43
FIGURE 52 – BV price positioning (€ for black leather tote bag) ... 43
FIGURE 53 – Soft luxury price positioning vs EBIT margin... 44
FIGURE 54 - Revenues breakdown by distribution channel 2012 ... 44
FIGURE 55 – Soft luxury own retail as a % of sales ... 44
FIGURE 56 – Bottega Veneta store numbers versus peers ... 45
FIGURE 57 – Soft luxury % of sales from retail vs EBIT margin (%) ... 45
FIGURE 58 – YSL: Revenues breakdown by region 2012 ... 47
FIGURE 59 – YSL: EBIT vs EBIT margin (%) ... 47
FIGURE 60 – YSL: Revenues vs Organic growth (%) ... 47
FIGURE 61 – YSL: EBIT margin vs peers ... 48
FIGURE 62 – YSL: Revenues breakdown by product category ... 48
FIGURE 63 – YSL: Revenues breakdown by distribution channel 2012... 49
FIGURE 64 – OLB: Revenues breakdown by brand 2012 ... 50
FIGURE 65 – OLB: EBIT breakdown by brand 2012 ... 50
FIGURE 66 – OLB: Revenues vs Organic growth (%) ... 51
FIGURE 67 – OLB: EBIT vs EBIT margin (%) ... 51
FIGURE 68 – PUMA: Revenues breakdown by product category 2012 ... 54
FIGURE 69 – PUMA: Revenues breakdown by distribution channel 2012 ... 54
FIGURE 70 – PUMA: Revenues breakdown by region 2012 ... 55
FIGURE 71 – PUMA: Revenues vs Organic growth (%) ... 55
FIGURE 72 – PUMA: EBIT vs EBIT margin (%) ... 55
FIGURE 73 – OSL: Revenues breakdown by region 2012 ... 59
FIGURE 74 – OSL: EBIT vs EBIT margin (%) ... 59
FIGURE 75 – Organic revenue growth assumptions ... 61
FIGURE 76 – Revenues breakdown by Division in the next 3 years ... 62
FIGURE 77 – EBIT margins assumptions ... 62
FIGURE 78- Cost of Capital ... 65
FIGURE 79 –Enterprise value to Equity Value ... 66
FIGURE 80 – Price Target ... 67
FIGURE 81 – Characteristics of Kering and its comparable companies ... 67
FIGURE 82 – Multiples projections 2014 ... 68
FIGURE 83 – Sensitivity analysis ... 69
VII List of Abbreviations
BV – Bottega Veneta YSL – Yves Saint Laurent OLB – Other Luxury Brands
OLB – Other Sport & Lifestyle Brands DCF – Discounted Cash Flow
LFL – Like-for-Like
WACC – Weighted average cost of capital rE – Cost of Equity
rD – Cost of Debt EV – Enterprise Value ASL – Average Selling Price AUR - Average Unit Retail
NBS - National Bureau of Statistics of China HNWI – High-net-worth individuals
1
Executive Summary/Introduction
As part of the thesis in the Master of Finance, it was proposed to carry out a project or a dissertation. The choice made relies on a project that reconciles the work activity as an equity analyst at BPI Asset Management with the academic work. Choosing the company took into account what would be useful for the bank, in professional terms, as well as the personal interests. As a result, the company chosen was Kering.
Kering is a French multinational holding company that operates in the luxury goods sector and has a wide brand portfolio with around 20 brands. The company is divided into two divisions - the Luxury Division and the Sport & Lifestyle Division - and its brands are distributed in more than 120 countries around the world, with mainly presence in Western Europe (30% of revenues) and Asia-Pacific (25% of revenues). The company comprises several known brands, such as Gucci, Yves Saint Laurent and PUMA. Gucci is the main brand, contributing with 37% of revenues and 62% of EBIT in 2012. In the same year, the company made € 9.7 million in revenues and obtained an operating income of € 1.8 million, representing an EBIT margin of 18%.
The aim of this work is first to evaluate the financial and economic situation of the company and secondly to reach a price target in order to make an investment decision – buy, hold or sell the related share.
The main issues that arise are "Is the company cheap or expensive? Is it worth investing on it? What are the expected returns?”. To address these questions it was made a complex model with all the past information of the company and the estimates are made with the goal of reaching a price target for Kering.
In the end, the reached price is € 184.50 and the current market price is € 153.65, which is translated into an upside potential of 20%. Thus the recommendation decision is to buy. The structure of this report was carefully thought in order to give the reader a good understanding of the process.
It starts with the review of the main literature, which includes the different valuation methods and a greater emphasis is made on the methods that are used to value the company – discounted cash flow and multiples methods.
2
Then, it is made an overview of the company by characterizing its business, history, brands, strategy and industry. Since Kering has several brands and in order to do an accurate analysis of the company, each one of the brands is comprehensively described.
After this, are presented not only the main assumptions for each brand in terms of revenues and EBIT margins but also other assumptions for the company as a whole. The assumptions are based on several research reports, on information published by the company, on conference calls with analysts specialized in this sector and that follow Kering, and on Kering’s investor relations.
Finally, the discounted cash flow and multiples methods are shown as well as a sensitivity analysis. To conclude, a recommendation decision is made.
After reading this report, the reader should be aware about the reality of Kering, namely its businesses and results, and should easily take his or her own conclusions.
3 1. Revision of Existing Literature
1.1. Introduction to Corporate Valuation
Every asset has a value. The challenging of valuation is to accurately estimate how much is its worth, by analyzing the sources of the value, as Damodaran (2012) states.
Valuation consists in determining the current value of an asset or company. Although it looks simple, this is very far from being an exact science. The success of this task is dependent on the accuracy of data inputs, very often based on the views and beliefs of the analysts. Some assets are easier to value than others, and the chosen valuation method may vary from case to case, depending on the information available and on many other characteristics of the asset. First of all, it is crucial to understand what value is. Several concepts of value are used for the foundation of different valuation models. CFA (2011) states intrinsic value as the starting point of an equity analysis and as the very relevant concept of this process. However, there are many other concepts of value – going-concern value, liquidation value and fair value, which will be explained shortly.
Intrinsic value is the value of an asset based on all the underlying characteristics of that asset. It reflects the investor’s view of the “true/fair” value of it. Going-concern value corresponds to the value of a company assuming that it will continue its business activities (it is based on the principle of continuity). Generally, equity analysts estimate intrinsic value under a going-concern assumption.
Liquidation value is the company’s value assuming that it went bankrupt and its assets will be sold individually. According to CFA (2011; p. 12), fair market value is “(…) the price at which an asset (or liability) would change hands between a willing buyer and a willing seller when the former is not under any compulsion to buy and the latter is not under any compulsion to sell”.
Corporate valuation is used for several purposes. According to Frykman and Tolleryd (2003), valuation is necessary to raise capital for growth; to create an incentive program to keep and attract employees; to execute a merger, acquisition or divestiture; or to conduct an IPO. As stated by Damodaran (2012), valuation is important for portfolio management, merger and acquisitions and corporate finance. In addition, Fernández (2007) considers some other purposes of valuation, including inheritances and wills – used to compare the share’s value
4
with that of the other assets; compensation schemes based on value creation; identification of value drivers; strategic decisions on the company’s continued existence and strategic planning.
The final objective of Kering’s valuation is to decide whether or not to include this company in a portfolio, making this project important for portfolio management. Fundamental analysts try to value the company by analyzing its growth prospects, risks and cash flows in order to seek companies that seem to be undervalued.
CFA (2011) states that the process of valuing a company has five essential steps. First, it is necessary to understand the business, including its financial statements, economic, competitive and industry context, and also its strategy. The second step is to forecast the company performance, which includes the projection of revenues, dividends, earnings and financial position. Then it is necessary to select the appropriate valuation model and after that to convert forecasts into a valuation. Lastly, valuation conclusions are applied.
There are countless ways to divide the different valuation models.
According to Frykman and Tolleryd (2003) the valuation models can be divided in valuation models based on cash flows, which include the dividend discount model (DDM), the discounted cash flow model (DCF) and the cash flow return on investment (CFROI); valuation models based on returns, including the economic value added model (EVA); valuations based on assets, constituted by the net asset valuation approach; options valuation and valuation based on multiples.
As said by Fernández (2007), valuation models can be classified in balance sheet based methods (book value, adjusted book value, liquidation value and substantial value), income statement based methods (multiples analysis), mixed methods, cash flow discounting methods (DCF, APV, equity cash flow and capital cash flow), value creation (EVA, economic profit, cash value added and CFROI) and option methods, of which the first four enumerated methods are considered the most widely used ones.
Damoradan (2012) only considers three approaches of valuation: discounted cash flow valuation, which contemplates FCFF, FCFE, DDM, APV and EVA; relative valuation and contingent claim valuation (use of option pricing models). He also explains that many authors use the asset based valuation as a valid method, even though he does not consider this
5
approach as an alternative to discounted cash flow, relative valuation or option pricing models because replacement and liquidation values can be obtained from these approaches.
In fact, almost all the authors consider the same approaches of valuation although they divide them in very different ways.
The different valuation models can be briefly described as:
Dividend discount model (DDM) – consists in projecting the present value of expected future dividends to achieve the value of the company’s equity;
Discounted cash flow model (DCF) – assumes the enterprise value as the present value of expected future cash flows. This model can be divided in firm or equity perspective;
Adjusted Present Value – considers the value of the operations if the company were all equity financed and the value of tax shields that arise from debt financing;
Economic Value Added (EVA) – it is the value a company can create, thus it compares the required rate of return of the company’s stakeholders with its cost of capital;
Relative (or multiples) valuation – estimates the value of a company by looking at the pricing of other companies, the industry average or the company’s own historical data; Real options valuation – uses option pricing models to measure the value of investment
opportunities and companies;
Liquidation Value – it is the value of a company if its assets were sold and its debts were paid off;
Cash flow return on investment model (CFROI) – consists in calculating a return ratio that represents the company’s current or future ability to produce free cash flow;
Net asset valuation – it is the adjusted value of the equity on the balance sheet.
Damodaran (2012) states that the majority of the analysts use discounted cash flow models and/or multiples to value companies, therefore these are the methods that are fully described below and used to value the company. Koller et all (2010, p.103) agree with Damodaran stating that “DCF remains a favorite of practitioners and academics because it relies solely on the flow of cash in and out of the company, rather than on accounting-based earnings”.
6 1.2. Discounted Cash Flow Model
Discounted Cash Flow Model (DCF) is the most used valuation model in the real world. The general idea behind this model is that a value of an asset corresponds to the present value of expected future cash flows on that asset.
(1)
Where:
n – Life of the asset
CFt – Cash flow in period t
r – Discount rate reflecting the riskiness of the estimated cash flows
By using DCF it is possible to estimate the intrinsic value of an asset based on its fundamentals. According to Damodaran (2012, p. 12), intrinsic value is defined as “the value that would be attached to the firm by an unbiased analyst, who not only estimates the expected cash flows for the firm correctly, given the information available at the time, but also attaches the right discount rate to value these cash flows”.
There are numerous DCF models, however the more common ones are the models based on dividends (DDM), on cash flows (FCFF and FCFE), APV and EVA.
The most frequently used model is the one based on cash flows, also known as McKinsey DCF model, that can be applied either in an equity (FCFE) or a firm (FCFF) approach.
On the Free Cash Flow to Firm Method (FCFF) the company is valued as a whole and all the claimholders, such as shareholders, bondholders and preferred shareholders are taken into consideration. It is also possible to value just the equity stake in the business, through the Free Cash Flow to Equity Method (FCFE).
Depending on which method is used, it is necessary to use different discount rates in order to reflect the risk of the whole business – in the case of the FCFF method or to only reflect the risk of equity – FCFE method.
Kering’s valuation is obtained through the implementation of the FCFF method. For that reason a deeper analysis on this method is developed.
According to Frykman and Tolleryd (2003) DCF is very popular because it is theoretically correct and compatible with some capital market models; it responds well to market values
7
and it works for all types of companies. For a successful result the analyst must have a good understanding of the underlying characteristics of the company and also have a good comprehension of its business and industry. This effort is not required by other valuation models such as relative multiples, since the valuation is based on comparisons.
DCF model also has disadvantages. DCF is a mechanical valuation tool and once it is used to estimate intrinsic value it requires more information than other models. Also, small changes in input variables can have large impacts in the value of a company; and inputs can be easily manipulated by the analyst to obtain the results he or she wants. Other drawback relies on the fact that the DCF valuation model only concludes if stocks are over or undervalued, that being a problem for equity researches analysts, who want to make recommendations of buy, hold or sell stocks in a specific sector.
Free Cash Flow to Firm Method
This method intends to value the company as a whole and consists in four main steps:
1. Estimating the Discount Rate – WACC
In order to reflect the risk of the whole business, the cash flows available to the firm are discounted using the weighted average cost of capital (rWACC).
WACC is the company’s cost of capital in which each source of financing (equity and debt) is proportionately weighted:
(2)
Where:
D – market value of debt E – market value of equity
D + E – market value of the company rd – cost of debt
re – cost of equity
t – tax rate
Target Capital Structure
Company’s capital structure can change over time, thus WACC can also change over time and that is why analysts often use a target capital structure instead of using the current market
8
value weights. This target capital structure reflects analysts’ expectations on the future capital structure of the company and it can be estimated by using some inputs: the current capital structure based on market values, capital structures of comparable companies, and based on management’s financing policies and corporate strategy.
Cost of Equity
The cost of equity corresponds to the return that a shareholder requires to invest in the company.
Although there are several ways to calculate cost of equity - using capital asset pricing model (CAPM), arbitrage pricing model (APM), Fama-French three-factor model or proxy models - CAPM is the most consensual one. As Damodaran (2012, p. 77) says “We would argue that a judicious use of the capital asset pricing model, without an over reliance on historical data, is still the most effective way of dealing with risk in valuation in most cases.”. The CAPM formula is the following:
(3)
Where:
re – cost of equity
rf – risk free rate
rm – expected market return rm-rf – marker risk premium βe – company levered beta
According to Frykman and Tolleryd (2003), the risk-free rate is usually the return on a government bond or a treasury bill in the home country of the company, being valued with a maturity that matches the investor’s investment horizon.
The market risk premium is the required return by an investor to invest in a risky security compared with “risk-free” investments such as government bonds. There is no preferred model to estimate market risk premium, however Koller et all (2010) describes three methods
to estimate it: by measuring and extrapolating historical returns; by using regression analysis
to link current market variables (dividend-to-price ratio for example) and by using DCF valuation, along with estimates of profitability and growth, solving for the implicit market’s
9
cost of capital. Based on these three methods, the authors believe that the appropriate market risk premium is between 4.5 and 5.5 percent.
Beta measures the company-specific risk compared to the market, i.e. how much the stock and the market move together. CFA (2011) considers that the simplest way to estimate beta is based on an ordinary least squares regression of the return on the stock on the return on the market, being considered a “raw” historical beta. However it is necessary to adjust this beta to better predict the future beta. It is done by using the following formula presented by Blume (1971) that follows the general idea of mean reversion:
(4)
Nevertheless, Damodaran (1999) criticizes regression betas because they are affected by the choice of the market index, time period and return interval. Different choices about these variables result in different betas for the same company.
According to the same author there are three alternatives to this methodology: to modify the regression betas in order to reflect the current fundamentals of the company; to come up with a measure of relative risk, such as relative volatility or accounting betas, without using historical prices on the stock and the index, or to estimate bottom-up betas, which reflect its current financial leverage and the businesses where the company operates.
He considers that the better way to estimate beta is by using the bottom-up approach, which uses the weighted average of the unlevered betas of the different businesses where the company operates, adjusted to reflect the current operating and financial leverage of the company. This is his preferred approach because it estimates the unlevered betas, by sector, by averaging across regression betas; it reflects the current company structure, since it uses the current weights for different businesses and the levered beta is computed using the current financial leverage of the company, rather than the average leverage over the period of the regression.
Cost of Debt
According to Frykman and Tolleryd (2003, p. 75) “(…) the required return on debt is the cost to the company for attracting more money from external lenders, in the first instance banks and other lending institutions.”. In other words, the required return on debt is the interest that the lender requires to lend its money to the company.
10
The cost of debt should reflect the default risk and the level of interest rates in the market and according to Damodaran (2013) it can be estimated by looking at the company’s yield to maturity of a long-term bond or at the company’s debt rating and estimate a default spread based on it, in the case the company does not have long term bonds that are liquid.
2. Calculating Free Cash Flow
Free Cash Flow to Firm corresponds to the cash flow available to all claimholders and there are several ways to calculate it:
(5) (6) (7) (8) Where: t – tax rate
D&A – depreciations and amortizations NWCN – net working capital needs
Capex – capital expenditures (net of divestures) FCFE – free cash flow to equity
CFO – cash flow from operations
To calculate free cash flows it is necessary to distinguish between explicit forecast period and terminal value period. In the explicit forecast period the free cash flows are predicted for each year and in the terminal value is assumed a constant growth. However, in the case of high growth companies it is possible to have a third period in order not to move from an extremely high growth rate period to a much lower growth rate state (terminal value period).
To compute FCFF the main variables that need to be estimated are: EBIT, cash taxes on EBIT, capex, depreciation and working capital.
11
(9)
Where:
FCF – free cash flow
t – number of years in the explicit period
3. Calculating Terminal Value
After calculating the free cash flow for the explicit forecast period, it is necessary to estimate the terminal value of the company in order to have the enterprise value.
The terminal value, according to Frykman and Tolleryd (2003) is “the free cash flows from the year after the last year of the explicit period to perpetuity”:
(10)
Where:
TV – terminal value
FCFt+1 – level of free cash flow in the first year after the explicit forecast period
rWACC – weighted average cost of capital
g – expected growth rate in free cash flow in perpetuity
The terminal value’s calculation is extremely important because 70-80 percent of a company’s value comes from this value, thus assumptions on this calculation must be extremely accurate and reasonable.
In the long-term, industry growth is not expected to be higher than GDP growth.
4. Estimating the Final Value of the Company Calculating the Enterprise Value
Having determined FCFF, the terminal value and the WACC, it is possible to calculate the enterprise value, which is nothing more than the present value of all the future cash flows, including the terminal value, discounted at the WACC.
12
(11)
Calculating the Equity Value
Once the FCFF is calculated it is then necessary to subtract the market value of debt and add the market value of non-operating assets to reach the equity value.
(12)
Non-operating assets are assets that are not essential to the ongoing operations of the company but that can generate return. It includes cash, marketable securities, investments in equities and bonds of other firms and minority holdings in other firms.
Calculating the Price Target – Objective
Finally the price target of the company’s stock is achieved by dividing the shareholder’s equity by the number of shares outstanding:
(13)
In the end, this value is compared with the market value to see if the company is over or undervalued.
1.3. Market Multiples Method
Market multiples are used to reinforce the DCF valuation conclusions and provide a relative valuation between a company and its peers.
According to Frykman and Tolleryd (2003), there are two approaches relating multiples: fundamental and relative multiples. The fundamental multiples are calculated based on company fundamentals and the relative multiples compare the company multiples with the ones of comparable companies, industry or historical data, being the second approach the most common one.
There are two type of multiples: equity multiples, which are ratios of a stock’s market price (numerator) in relation to some other variable (denominator), and enterprise value multiples
13
which relate the total market value of all sources of a company’s capital (numerator) in relation to other variables (denominator).
The market multiples method has some advantages. It is objective and efficient since it can be easily applied; it is easy to understand; it can be used in different investments styles, such as value and growth, and it requires less information than DCF model. In this valuation method there are always securities under or overvalued.
Nevertheless, it also has some drawbacks. It is too simplistic and can exclude company-specific value drivers; it is very difficult to find out comparables and multiples are influenced by the company fundamentals and by market sentiment.
It is important to note that multiples tend to be different from industry to industry. For example, technology sector has a P/E ratio much higher than the utility sector.
Equity Multiples
1. Price to Earnings Ratio
Price to earnings ratio is the most popular multiple and it compares the share price of a company with its earnings. This ratio shows how much investors are willing to pay per unit of earnings.
A high P/E ratio means that investors are anticipating higher earnings growth in the future.
This ratio can be a trailing P/E, when the current price is divided by the EPS from the last twelve months or a forward P/E, when are used the next year’s expected earnings.
This ratio is very easy to understand and that’s why it is the most commonly used. Nevertheless, earnings are based on accounting measures and can easily be manipulated, which can result in biased results.
2. Price to Book Ratio
Price to book ratio reflects the current market price in relation to the company’s book value, which is the adjusted book value of total assets less adjusted book value of liabilities.
(14)
14
With this ratio it is possible to see if the investor is paying too much for what would be left if the company went bankrupt immediately. The stock could be undervalued if it has a low P/B ratio.
3. Price to Sales Ratio
Price to sales ratio relates a company’s stock price to its sales.
(16)
This ratio represents the value placed on each unit of a company’s sales. A low P/S ratio may indicate the stock is undervalued.
4. Dividend Yield
Dividend yield relates how much a company pays in dividends with its share price. It represents how much cash flow it gets for each unit invested in a stock.
(17)
Enterprise Multiples
1. Enterprise Value to EBITDA Ratio
It is used to determine the fair market value of a company.
(18)
This ratio is a better measure than P/E ratio since it is not affected by capital structure and thus can be used to compare companies with different capital structures.
A lower ratio indicates that a company might be undervalued.
2. Enterprise Value to EBIT Ratio
This multiple is similar to the previous ratio. The only difference is that this one considers depreciation and amortization in the denominator.
(19)
3. Enterprise Value to Sales Ratio
15
(20)
A lower ratio means the company can be undervalued. However, it can also mean the future sales prospects are weak.
Others
Free Cash Flow Yield
Free Cash Flow Yield ratio relates the free cash flow per share with the price per share.
(21)
The higher the ratio, the more attractive the company is.
This ratio is better than earnings yield because it considers capital expenditures and other ongoing costs, better reflecting what an investor receives.
16 FIGURE 3 – Luxury market breakdown by segment 2012
Source: SG Asset Management Research
2. Industry Analysis 2.1. Macroeconomic Outlook
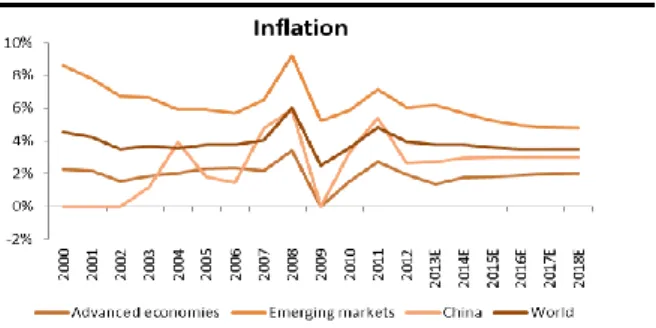
GDP trends are slowing down, mainly in some emerging markets, such as China. The absence of a strong recovery in Europe and in the United States has been also contributing to muted projections for 2013. IMF anticipates a worldwide GDP of 2.9% for 2013, the lowest value since 2010.
However, according to IMF it is expected a slight recovery from both advanced economies and emerging markets, although China will continue to slowdown. The IMF estimates a GDP of 2.6% for advanced economies and 5.5% for emerging markets, resulting in a worldwide GDP of 4.1% in 2018. China GDP is projected to be around 7%. World’s inflation is expected to reach a level of 3.5% in 2018.
2.2. Luxury Goods Market
Kering is part of the luxury market, more precisely of the personal luxury goods sector.
The luxury market is constituted by different segments, such as personal luxury goods, which represents around 30% of the market in terms of revenues, luxury cars (39% of the market), luxury hotels and leisure, luxury food, design furniture, luxury yachts, and luxury wines and spirits.
FIGURE 1 – GDP 2000-2018E
Source: IMF, World Economic Outlook, October 2013 Source: IMF, World Economic Outlook, October 2013
17
The personal luxury goods (also named luxury goods sector) sector is constituted by companies that develop, produce, market and sell not only high-end leather goods, apparel, jewellery, watches and accessories, but also other premium-priced categories, like fragrances and wines and spirits. This sector is characterized by its very high operating margins, strong cash flow generation and more recently also by its high exposure to emerging markets.
Kering is included more precisely in the European luxury goods sector, which can be divided in the following way:
Diversified groups, where Kering is included, are constituted by companies that market different product categories: fashion and leather, fragrance and cosmetics, wines and spirits or watches and jewellery.
Hard luxury companies are the ones focused on watches, jewellery and pens. Soft luxury describes high-end apparel and leather goods.
Market Overview
The personal luxury goods market is facing the first slowdown since the financial crisis of 2008/09, leaving behind the double digit growth of the recent years. For 2013, the market expected revenues of € 217 billion for the luxury goods market, corresponding to a growth of 2% as reported and 6% at comparable exchange rates.
Source: Adapted from European luxury goods sector’s analysts
FIGURE 4 – European Luxury Goods Sector
European Luxury Goods
Diversified groups or holdings LMVH Kering Luxottica Hard luxury companies Richemont Swatch Soft luxury companies Burberry Hermès Tod's Salvatore Ferragamo Hugo Boss
18
This sector is known for outperforming the global economy when the economy is growing, but also to underperform the market during recessions, once it follows the global market trend.
Beyond the global economic factors, there are also other drivers that affect the demand and growth of luxury goods, such as positive trends in emerging markets driven mainly by middle class increase, growth in the global population of high-net-worth individuals and increase of tourism spending. However, in the short term there are some concerns that could weight down the development of this market, such as high import taxes on luxury goods in some emerging countries and new and more restrictive regulations on travel and in the acquisition of luxury goods.
Lastly, it should be noted that in this market, the currency has a very high impact on the companies’ performance. According to Bain & Company (2013), the euro appreciation has been penalizing market performance over 2013, albeit constant growth has been higher than in 2012. The main contributor to the difference between real and nominal growth is the yen devaluation, which drives over half of this differential.
Product categories
The luxury goods sector has four product categories: accessories, apparel, hard luxury and beauty.
FIGURE 5 – Worldwide personal luxury goods market trend
(1995-2013E|€B)
Source: Bain&Company
FIGURE 6 –Luxury LFL and global GDP = 0.9
19
Accessories category includes shoes, leather goods (handbags, wallets and others), textile accessories and eyewear. This category accounts for 28% of total luxury goods sector and it was expected to record the fastest growth in the sector at 4% in 2013. Leather goods are the fastest growing category in luxury with 5% growth.
Apparel category comprises ready-to-wear for both women and men and represents 25% of the sector. It is spread into men’s and women’s products, with a super-performance of high-end segment of menswear driven by made-to-measure.
Hard luxury is constituted by watches and jewellery and represents 23% of the market. High-end and affordable jewellery are growing significantly, but watches are slowing down in real terms.
At last, beauty includes perfume and cosmetics and represents 20% of the total luxury goods market. This category is suffering in Europe due to promotions increases, which lowers the average price.
Distribution Channels
Retail channel is essential for the success of a luxury brand because it allows a better control over the consumer shopping experience and over product assortment, merchandising and customer service. In 2013 it represents 31% of the luxury goods market.
FIGURE 7 – Worldwide personal luxury goods market by
category (€b)
Source: Bain&Company
FIGURE 8 – Worldwide personal luxury goods market by channel
(€b)
20
Despite decelerating organic growth, this channel is the only growth driver in the luxury goods sector, with main focus on store expansion. Therefore it is expected a slowdown in new DOS (directly operated stores) openings, mainly in emerging markets and store expansion, renovation and relocation, in mature markets.
The online channel is gaining scale reaching € 10 billion in 2013, up 28% versus 2012. It comes 70% from wholesale and 30% from retail, representing 5% of total luxury goods market.
Geographic Regions
Europe is becoming the leading geographical region in luxury goods market, accounting for 34% of revenues, up 3% at comparable exchange rates in 2013. This growth is driven by touristic flows that are increasing in Europe, offsetting the decline of local consumers, due to increases in local prices.
The Americas region is the second largest region, representing 31% of the market, being the United States the largest country in terms of luxury goods consumption. In 2013 this region was expected to grow 7% at comparable exchange rates due to consumer confidence, strong momentum from tourism in major cities and brand expansion in cities such as Miami, Las Vegas and Los Angeles.
Japan, which accounts for 9% of the market, is being hugely affected by yen devaluation in 2013, redirecting consumption locally. At comparable exchange rates, the trends are being very positive (9% growth), caused by strong internal consumption.
The Asia Pacific ex-Japan was expected to grow 5% and accounts for 21% of the market. Greater China1 is the largest area within this region, accounting for € 28 billion, up 4% in
1
Greater China is constituted by Mainland China, Hong Kong, Macau and Taiwan.
Source: Bain&Company
FIGURE 9 – Worldwide personal luxury goods market by
region (€b)
FIGURE 10 – Share of sales to tourist vs domestic by
European major country (2013E)
21
2013. In Mainland China real growth is slowing down, due mainly to government crackdown on public officials spending in luxury and anti-corruption campaigns still negatively affecting gifting and to increasing consumer spending abroad from Chinese consumers.
Chinese consumers become more sophisticated, seeking for high-end and sophisticated luxury. They are also logo fatigue, with aspirational consumers shifting to more accessible luxury-premium brands, benefiting also from the rise of new middle class.
Nationality
Chinese consumers are the ones growing the most, very close to become one third of the market due to sustained domestic market and relevant spending in Europe.
In the Americas region, there are more domestic consumers than tourists. In the US and in Brazil, consumers buy mainly locally. In Europe, consumers are evenly divided and Asian consumers are fundamental, with Chinese consumers increasing in number. Western Europeans are decreasing spending and buying more locally. In Asia, Chinese consumers are the top foreign nationality for most markets in Greater China, SEA and Korea and Japanese overseas spending is decreasing due to yen devaluation. In contrast, Japanese consumption is increasing locally.
FIGURE 11 – China Luxury Goods Market by segment trend
(2013E)
Source: Bain&Company
FIGURE 12 –Luxury Goods Market by consumer nationality
(1995-2013€b)
22 FIGURE 15 – Main categories in share of amount spend 2012
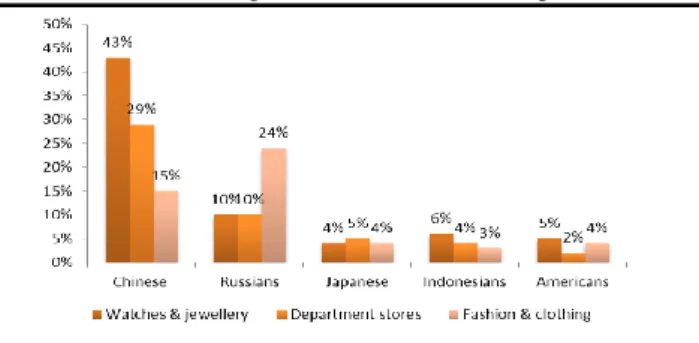
Source: Barclays Research, Global Blue
According to Global Blue2, 50% of tourism spending is made by Chinese tourists (25% of total spending), Russian (16%), Japanese (5%) and Indonesians/Americans (4%).
The tourism spending has many drivers. The outbound tourist flows is driven by GDP per capita, the wealthier consumers become the more they want to travel abroad; culture also matters, for example the gift giving for Chinese customers; foreign exchange, costs and requirements of visa and development of air transport.
Regarding the different categories of products, Chinese prefer to spend in watches and jewellery (43%) and Russian prefer fashion & clothing (24%).
2 Global Blue – a leader company that processes VAT refunds from tourists is a good measure on the growth rates for tourism spending in the luxury industry, once it gives information about tourism spending rather than just traffic. It is important to note that Global Blue does not count with tourism spending in the US, Hong Kong and Dubai, due the fact these countries do not have VAT refund systems in place.
FIGURE 13 –Luxury Goods Market by consumer nationality
(2013€b)
Source: Bain&Company
FIGURE 14 – Top 10 nations by amount spent
23
Market Outlook
Sector’s analysts are positive on the sector in the long term given the potential for structural growth from emerging markets, the barriers to entry, cash flow generation and pricing power. However, in the short term it is expected a continued share price volatility in the sector given consumer uncertainty around the fiscal cliff in US and leadership transition in China.
Bain&Company (2013) forecast a 3-5% growth at comparable exchange rates over the next 3 years for the luxury goods market.
The main drivers of this growth are the Chinese consumers potential, positive trends in China, new emerging markets, continued expansion of tourism, increase in high-spending consumer classes, global consumption and development of new high-end products and services.
1. China/Chinese consumers
As it was referred before, Chinese consumers represent around 30% of the luxury consumers in the world, being a key for the luxury goods market. It is expected that Chinese people will contribute more than 50% to luxury growth in 2013.
Chinese outbound tourists have been increasing for the past few years, being the main reasons for this new trend, the easing of travelling abroad, due to the less restrictive visa requirements,
FIGURE 16 –Luxury goods market trend
Source: Bain & Company
FIGURE 17 – Share of global luxury market
Source: Swiss & Global Asset Management
FIGURE 18 – Contribution to luxury growth
24
as well as the significant price differential of luxury goods between China and abroad. The huge price gap is driven by high import duties and consumption tax on luxury goods imports and by a weak Euro against RMB.
Global Blue (2013) estimates that Chinese outbound travels will growth 14% in the next 5 years, which can benefit European luxury goods companies.
Chinese consumers’ tastes are becoming more sophisticated and in tier 1 and tier 2 cities they worry more about the history and culture of the brands, being less logo orientated. However consumers in lower-tier cities may still prefer brands with easily recognized logos, since they have recently reached a new social status that can afford luxury goods and like to show off it. According to Fung Business Intelligence Centre (2013), China’s luxury market has some positive drivers, such as the increase in household disposable income, the fact that the number of wealthy individuals is growing at a rapid pace, the fast growing affluent and middle class, and the ongoing urbanization and rising luxury demand in smaller cities.
Household disposable income in China has grown consistently over the years. According to the National Bureau of Statistics of China (2013), the highest income segment was the one that grew the most (14.5%), followed by the high income and upper middle income segment. These income groups are the biggest spender on luxury goods.
It is expected that household disposable income will continue to rise since the Chinese government wants to double the per capita household income by 2020 in order to stimulate domestic consumption.
FIGURE 19 – Chinese outbound travel forecasts
25
According to the same source, it is predicted that HNWIs in China will double to 14,000 by 2016.
Middle class is driving luxury sector tendencies and according to McKinsey & Company (2013) the upper middle class (income between 16,000 and 34,000 USD) is expected to reach 54% of urban households in 2020 from 14% in 2012. Therefore middle class as a whole is expected to be 75% of China’s urban consumers and will stem mainly from third-tier cities.
Middle class will be the consumer dominant force since the increase in urbanization degree and in disposable income will help this class to become more sophisticated, by changing their consumption tastes and make them willing to pay a premium for high quality goods, benefiting luxury brands.
The Chinese tourism spending has been slowing down since the end of 2012, however there is still high potential due to the rising of the middle class where the average disposable income and purchasing power of consumers has continued to grow.
China has the lowest consumer spending as percentage of GDP and thus there is scope for China consumer spending to increase faster than GDP growth.
FIGURE 20 – Household disposable income by income group
Source: Fung Business Intelligence Centre, NBS
FIGURE 21 – Income Class of Chinese Population
26
China has only three regions that show developed GDP per capita – Shanghai, Beijing and Tanjing and seven regions growing fast. The twelve remaining regions are still developing, meaning that there is significant growth remaining for China.
There are also economic and others risks in China. According to Barclays Research (2013), global recession causes China hard landing; corruption – “gifting” and soft bribery – is another problem and social unrest, given by the unpalatable wealth divide.
2. Tourism spending
In September 2013, tourism spending in the luxury industry raised 14% y/y, which represents an YTD growth of 12%. This trend represents more moderate growths, after a very strong period of growth from 2009 to 2012, but still robust.
Tourism has been increasing significantly as percentage of sales in Europe. According to Barclays Research (2013), tourism is a very important driver in the European luxury goods sector. As an example there is the fact that tourism accounts for 60% of European sales for Richemont.
This increase has two main explanations. The first one is the increase in traffic especially from Asia with the development of the emerging economies - the air traffic between Europe
FIGURE 22 – GDP per capita by region
Source: Barclays Research
FIGURE 23 – Global Blue y/y worldwide spend growth %
27
and the Far East grew 28% between 2009 and 2013. The other reason is related with the huge increase in the average tourism spending, which raised 143% between 2008 and 2013, representing a 19% CAGR. Chinese tourism spending increased 38%, moving from 7% of contribution to total tourism spending to 19%.
3. Global consumption
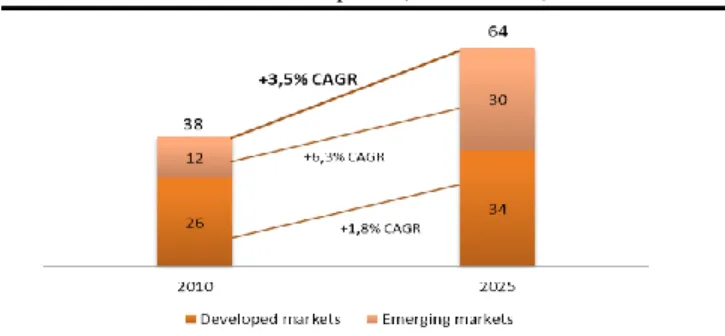
According to Swiss Global Asset Management (2013), the global consumption will grow 3.5% (CAGR) until 2025, with an impressive growth of consumption in the emerging markets, which is expected to be around 6.3% (CAGR). This growth has impact in the luxury market. The emerging market consumption is driven by economic and wage growth, and urbanization.
The world wealth is expected to rise almost 50% from 2012 to 2017 and China will surpass Japan and become the second wealthiest country in the world. Nowadays the US has the higher number of millionaires, followed by Japan and Germany. North America and Europe had 31% of the wealth in 2012 each. There are more millionaires living in Asia than in Europe.
4. New emerging countries
Beyond China, Middle East, Brazil, Australia, Africa and India, there are also other emerging countries that, according to Bain & Company (2013), are fundamental to the growth of the luxury goods sector, such as Indonesia, Malaysia, Vietnam and Thailand. Luxury growth will result essentially from emerging markets.
5. High-spending consumer classes
The high-net-worth individuals (HNWI’s) are expected to increase 6.5% per year, reaching USD 55.8 trillion by 2015, driven mainly by Asia Pacific HNWI wealth growth.
FIGURE 24 – Global Consumption (trillion USD)
28 2.3. Sport & Lifestlyle Market
Since Kering has also sport and lifestyle brands, it is also necessary to analyse this market. This section derives from “Kering – 2013 Financial Document”, which in turn was based on “2012 Global Sport Market Report” by NPD Group.
Market Overview
The sport and lifestyle market has been growing since 2009 and reached revenues of € 273 billion in 2012, representing a 5% growth rate as reported. Since 2006, this market registered a compound annual growth rate of 3%.
This market has four main drivers: demographic trends and an increase in world GDP, increase in leisure time and increased awareness among the population of the positive effect of sport on health, globalization and convergence of consumer habits as sport promotes universal value, and increase in purchasing power and urbanization in emerging countries.
Product Categories
The sport and lifestyle sector has four product categories: footwear, apparel, equipment and bicycle and accessories.
FIGURE 25 – Worldwide Sport & Lifestyle market trend
(2006-2012, in € billions)
Source: Company data
FIGURE 26 – Worldwide Sport & Lifestyle market: breakdown
by category
29
Apparel is the largest product category with 33% of revenues in 2012, followed by footwear – 27% of revenues.
All categories grew in 2012 and footwear registered the highest growth of 7%.
The five main sports, which represent half of the market, are cycling, fitness, walking/hiking, running and football/soccer.
The major players of this market are Nike, Adidas and PUMA, but there are other smaller players specialized in only one category.
Distribution Channels
Wholesale is the most important distribution channel for the sport and lifestyle market. However, players are developing their network of directly-operated stores, shop-in-shops and joint ventures with retailers.
Geographic Regions
In 2012, Americas represented 39% of the market at comparable rates and Europe 29% in terms of revenues.
United States is the largest country, with 27% of market share, followed by China and Japan. Macro-economic headwinds influenced Western Europe, but it increased 2%. Northern Europe offset weaknesses in Southern Europe. Emerging markets, mainly Brazil, South Africa and India, grew the most.
Market Outlook
NPD Group expects a compound annual growth rate of 3% for 2013-2016, driven by a positive global GDP and consumer spending. They also predict that the top five sports will outperform the sport and lifestyle market growth, with growth rates around 4%-5%.
FIGURE 27 – Worldwide Sport & Lifestyle market: breakdown by
region
30 3. Company Overview and Outlook
3.1. Company Description
Kering, previously known as PPR, is a French multinational holding company that operates in the apparel and accessories sector and is organized in two divisions: the Luxury Division and the Sport & Lifestyle Division.
The Luxury Division includes brands such as Gucci, Yves Saint Laurent, Bottega Veneta, Alexander McQueen, Balenciaga, Brioni, Christopher Kane, Stella McCartney, Sergio Rossi, Boucheron, Dodo, Girard-Perregaux, Jeanrichard, Pomellato and Qeelin and the Sport & Lifestyle Division includes PUMA, Volcom, Cobra, Electric and Tretorn.
PPR was founded in 1963 by François Pinault and it started as a building materials business. In the 1990s PPR entered in the retail activity, with the acquisition of Conforama. Later in 1999, the Group acquired a 42% stake in Gucci Group, entering thus in the luxury goods sector. In 2007, PPR purchased a controlling stake in PUMA.
In 2008, PPR was a diversified group involving several sectors: retail business, with Fnac, Redcats, Conforama and Cfao; luxury business with the Gucci Group and sport & lifestyle business with PUMA.
It is possible to see the company structure evolution since 2008 in Appendix 1 - Company Structure.
In the last years, Kering has been transforming itself in an integrated group which is no longer concerned with the retail business, focusing exclusively on its two main divisions. This transformation was expected to be concluded in 2013, with Kering exiting its remaining historical retail businesses, through the Fnac de-merger (happened in the first half of 2013) and the disposal of Redcats.
In July 2013, in order to reflect this transformation, the Group’s name changed from PPR to Kering. This new name reflects not only the company attitude towards its brands, people, customers, stakeholders and the environment, but also an opportunity to reaffirm the Group’s international dimension.
A new emblem was also created: an owl, a sign of wisdom, which represents the visionary side of the Group, the capacity to anticipate trends and spot potential.
31
This new identity, started several years ago, came from the transformation of its business, going through a diverse conglomerate to a cohesive, integrated and international group.
Kering celebrated its 50th birthday in 2013.
Shareholders Stucture
Kering is a public company listed on NYSE Euronext Paris, or Paris Bourse, and it is a member of the CAC 40 Index since 1995.
The main shareholder is Artémis Group with a 41% of the Group’s share capital in 2012. In that same year, while international institutional investors had 42%, French institutional investors only held 11% of the share capital. Regarding the employee shareholders, they detained 6% of the share capital in 2012.
Revenues and Margins
Kering has been having high growth rates in the last years. However that is not perceivable in FIGURE 29 due to the simultaneous disinvestment from the retail businesses. Only the two last years are comparable because 2011 data was re-stated. With comparable data, Kering’s revenues registered a strong performance by growing 20.8% in 2012, hugely affected by positive movements on currencies. Contrariwise, in the first nine months of 2013, revenues grew 3.9% at comparable data, but only 0.4% as reported due to very negative currency impact.
Regarding margins, since Kering started the disposal of its retail business, margins begun to rise strongly, due to higher margins in the luxury goods sector. In 2012 the company reached an EBIT margin of 18.4% and in the first half of 2013 of 18%.
FIGURE 28 – Shareholders Structure 2012
32 Dividend per Share and Solvency
Kering has been growing its dividend per share paid to its shareholders, reaching a maximum of € 3.75 in 2012. Since 2008, Kering is decreasing its net debt/EBITDA, reaching a ratio of 1.21 in 2012. This low ratio is confirmed by S&P’s rating of BBB. In the first half of 2013, Kering’s gross borrowings maturing within one year corresponded to 50%. In spite of having low long term debt, because of its strong cash generation and its current high level of cash in the balance sheet, the company is not exposed to liquidity risk.3
3.1.1. Divisions and brands
Luxury division increased from 20% of revenues in 2008 to 66% in the first half of 2013 and represented 88% of EBIT.
3
See Appendix 2 – Liquidity.
FIGURE 29 – Revenues vs reported growth (%)
Source: Company data
FIGURE 30 – EBIT vs EBIT margin (%)
Source: Company data
FIGURE 31 – Dividend per Share
Source: Company data
FIGURE 32 – Solvency (Net debt/EBITDA)
Source: Company data
FIGURE 33 – Revenues breakdown by division
Source: Company data
FIGURE 34 – EBIT breakdown by division
33
Gucci is a key stock driver for Kering Group, representing 37% of revenues and contributing for 63% of total EBIT. The second biggest brand in terms of revenues is PUMA with 34% of revenues but it only accounts for 16% of EBIT in 2012. Bottega Veneta is the second more important brand in terms of EBIT margin, accounting for 16% of EBIT.
3.1.2. Geographic regions
Over the years Kering has been focused on internationalization and since 2009 revenues in Western Europe fell by half and are now around 30%. To counteract this decreasing trend, revenues in Asia-Pacific excluding Japan, and in North America grew from 9% to 26% and from 16% to 21%, respectively, between 2009 and 2013.
3.2. Strategy
The strategy of Kering is based on enhancing the organic growth of their current brands through the expansion into new markets, on the reinforcement of their presence in mature markets and on the development of their distribution network and channels.
Another strategy is the acquisition of small to medium size brands that meet some strict criteria, which will strengthen and complement their brand portfolio.
FIGURE 35 – Revenues breakdown by brand 2012
Source: Company data
FIGURE 36 - EBIT breakdown by brand 2012
Source: Company data
FIGURE 37 – Revenues breakdown by region
34 3.3. Brands
This section provides a deeper analysis of each brand, as well as the corresponding estimates for the next three years in terms of revenues and margins. All the analysis and projections are essentially based on several researches from HSBC, Barclays, JP Morgan, Societe Generale, Credit Suisse and Cantor Fitzgerald.4
3.3.1. Luxury Division
3.3.1.1. Gucci
Gucci was founded by Guccio Gucci in Florence in 1921 and it is one of the world’s leading luxury fashion brands. This brand contributed with 37% of revenues and accounted for 59% of EBIT in 2012, being a key brand for the Group.
Gucci’s main product category is leather goods and is mainly present in Asia-Pacific. Retail channel is the principal distribution channel chosen by Gucci.
The Gucci brand is known by its quality, Italian craftsmanship, exclusivity, innovation, creativity and social responsibility.
The brand sees as main competitors Hermès, Chanel and Louis Vuitton.
It has sustained strong EBIT and revenues momentum with the margins increasing since 2009, as well as revenues, due to its new positioning.
History
Between the 1950’s and 1970’s, the brand was an absolute reference in the luxury market, however in the 1980’s the brand’s strategy was affected by infighting among the family,
4 To see how the revenues were estimated, see Appendix 3 – Revenues projections. The exchange rates impact only was considered for 2013, by using the trend of the first nine months of 2013.
FIGURE 38 – Gucci: Revenues vs Organic growth (%)
Source: Company data
FIGURE 39 – Gucci: EBIT vs EBIT margin (%)
35
resulting in the brand’s loss of relevance and thus becoming more affordable. In the 1990’s the brand was one dimensional on “sexy fashion”, with 85% of its business being fabric and logo bags and was excessively affordable, thus Gucci’s icons were lost. In the mid-2000’s the company tried to bring back the icons but it was not successful, as the consumers were still focused on fabric and logo bags.
The main objective of Patrizio di Marco, CEO since 2009, was to redefine the positioning of Gucci as a true luxury brand with a strong heritage and craftsmanship – a positioning that Hermès has captured – bringing back the original appeal of the 50’s-70’s.
Price/Product Mix
Gucci designs, manufactures and distributes a wide range of products, such as leather goods (handbags, small leather goods and luggage) – which is the main product category (59% of Gucci revenues), shoes, ready-to-wear, silks, timepieces and fine jewellery.
In the last 4 years, Patrizio di Marco has been trying to recapture the mid to high end consumer, focusing on increasing no-logo and leather products. This upscale strategy is going very well with no logo handbags representing 55% of sales, increased from 10% in the start of 2009 and from 48% in the start of 2013 and leather being 70% of sales, compared to 30% at the start of 2009 and 57% at the start of 2013.
Source: Company data
FIGURE 40 - Gucci: Revenues breakdown by product category
2012
FIGURE 41 – Gucci: Logo vs No-logo handbags
Source: Company data
FIGURE 42 – Gucci: Handbags sales breakdown by
materials