Universidade do Algarve
RISK TO PATIENT SAFETY FROM LABORATORY ERRORS AND DELAYS
Wei Wang
Dissertação de Mestrado/ Master Dissertation
Mestrado Erasmus Mundus em Inovação Química e Regulamentação (Erasmus Mundus Master in Chemical Innovation and Regulation)
Trabalho efetuado sob a orientação de:
Work supervised by:
Dr. Luisa Alvarez (Hospital Clínic de Barcelona)
Prof. Isabel Cavaco
DECLARATION OF AUTHORSHIP
“RISK TO PATIENT SAFETY FROM LABORATORY ERRORS AND DELAYS”
I declare that I am the author of this work, which is original. The work cites other authors and works, which are adequately referred in the text and are listed in the bibliography.
____________________________________
Wei Wang
Copyright: Wei Wang. The University of Algarve has the right to keep and publicise this work through printed copies in paper of digital form, or any other means of reproduction, to disseminate it in scientific repositories and to allow its copy and distribution with educational and/or research objectives, as long as they are non-commercial and give credit to the author and editor.
ACKNOWLEDGEMENT
Standing at the terminal point of the 24-month journey of EMMC-ChIR, when I look back I am grateful to the world. I would like to express my gratitude:
To the European Commission and EMMC-ChIR program for the lifetime opportunity and international vision it offered to me. It gave me more than what I expected. To my excellent colleagues with whom I had experienced the amazing journey: Yu Zhang, Miguel Brion, Donaldban Neba, Tugce Eran, Bas Nakamura, Peeaye Roxas, Hagos Tesfay, Angelo Kenneth Romasanta, Mireia Broch, Paola Blair, Asnake Gudisa Ede, Bethel Anucha, Anisur Rahman Jamil. Now even though we are departing to different destinations, we are the best friends and will continue inspiring each other. To the world-class professors of ChIR for their inspiring lectures and teaching style. To the Hospital Clínic de Barcelona for hosting me to perform the study. To Dr. Luisa Alvarez and Dr. Anna Soler for the professional guidance and detailed help to my study. To my warm-hearted colleagues in the hospital: Leonor Guinon, Manoli Barragan, Angels Cano and Inma Hurtado. To all the laboratory technicians, physicians and staff for their great support to my study.
To Prof. Isabel Cavaco for the guidance of the thesis.
To Prof. Daniel Sainz and Mar Santacana of UB for the kind support during my stay in Barcelona. To the Nataliya Butenko, Celia Oliveira for their patience and help that made my stay in Ualg easy and warm.
To my beloved parents to whom I owe all my life. Their love has been giving me all the strength to be what I can be, to do what I want to do. To all my family members and friends in China and all over the world, who are always there for me, listening to me and supporting me.
With all their love and support, I will keep moving on.
1
INDEX
INDEX ... 1 ABSTRACT ... 3 RESUMO ... 4 LIST OF ACRONYMS ... 5 LIST OF FIGURES ... 6 LIST OF TABLES ... 7 1 INTRODUCTION ... 81.1 Patient Safety in Healthcare Industry ... 8
1.2 Clinical Laboratory and Patient Safety ... 10
1.3 Clinical Laboratory Quality Management ... 13
1.4 Risk Management and Patient Safety ... 13
2 STUDY OBJECTIVES ... 14
3 RATIONALE AND METHODOLOGIES ... 14
3.1 ISO Standards of Quality and Risk Management... 16
3.2 Failure Modes and Effects Analysis ... 16
3.3 Fishbone Cause-Effect Diagram ... 19
4 RESULTS AND DISCUSSIONS ... 23
4.1 Scope and Boundaries ... 23
4.2 Cross-Functional Team Organization ... 25
4.3 Process Maps ... 25
4.3.1 Pre-analytical Phase: Reception of Extraction Center ... 26
4.3.2 Pre-analytical Phase: Extraction Center ... 29
4.3.3 Pre-analytical Phase: Reception of Samples ... 32
2
4.3.5 Analytical Phase: Extraction Platform ... 39
4.3.6 Analytical Phase: Robot 1 Normalization and Quantification ... 42
4.3.7 Analytical Phase: Robot 2 PCR Assembly and PCR ... 45
4.3.8 Analytical Phase: Robot 3 PCR Purification ... 48
4.3.9 Analytical Phase: Sanger Sequencing and Fragment Analysis ... 50
4.4 FMEA Tables ... 52
4.4.1 Pre-analytical Phase: General ... 54
4.4.2 Pre-analytical Phase: Reception of Extraction Center ... 55
4.4.3 Pre-analytical Phase: Extraction Center ... 58
4.4.4 Pre-analytical Phase: Reception of Samples ... 62
4.4.5 Pre-analytical and Post-analytical Phase: Secretary UGC ... 69
4.4.6 Analytical Phase: Core BM General ... 72
4.4.7 Analytical Phase: Extraction Platform ... 74
4.4.8 Analytical Phase: Robot 1 Normalization and Quantification ... 77
4.4.9 Analytical Phase: Robot 2 PCR Assembly and PCR ... 78
4.4.10 Analytical Phase: Robot 3 PCR Purification ... 81
4.4.11 Analytical Phase: Sanger Sequencing and Fragment Analysis ... 83
4.4.12 Post-analytical Phase: Physician Validation and Sample Archiving .... 85
4.5 Results Summary and Discussions... 86
4.5.1 FMEA Results and Discussions ... 86
4.5.2 Methodology Discussions... 87
5 CONCLUSIONS ... 89
3
ABSTRACT
In most of the cases, patients are diagnosed and treated directly based on the clinical laboratory results. Thus the impact of laboratory errors and delays to the patient safety is significant, and has drawn increasing attention from both the general public and the healthcare professionals. Nowadays, the laboratory error rate is still high and continuously results in serious or irreversible medical consequences. It is critical to develop an effective and efficient quality system to prevent and reduce the errors and delays, or at least detect and correct them before it is too late.
This study focuses on the risk assessment of patient safety in the entire processes (i.e. pre-analytical, analytical and post-analytical phases) in a clinical laboratory: Core Molecular Biology Laboratory (Core BM) in Hospital Clínic de Barcelona, which was newly-built in January 2016. It is a prospective risk assessment that helps to evaluate and improve the designed processes before their full implementation, to ensure the laboratory quality as well as patient safety ultimately.
According to ISO standards and guidelines, the processes of the Core BM were assessed using Failure Modes and Effects Analysis (FMEA), with the help of Fishbone Cause-Effect Diagram. 216 risks were identified, the majority of which were from pre-analytical and analytical phases. 21 risks were ranked as high or medium priority to be treated, which mainly focused on sample quality and manual procedures. Actions were proposed to relevant processes for implementation.
This is the first study in Europe that applied FMEA in a hospital clinical laboratory in the TTP scope, i.e. pre-analytical, analytical and post-analytical phases of Core BM. It has laid the foundation of the risk management system in the laboratory, and allows the future improvement from both detailed steps and general scope.
4
RESUMO
Na maioria dos casos, os pacientes são diagnosticados e tratados directamente com base em resultados clínicos laboratoriais. Assim, o impacto dos erros de laboratório e atrasos sobre a segurança do paciente é significativo, e tem atraído cada vez mais atenção tanto do público em geral como dos profissionais médicos. Hoje em dia, a taxa de erro de laboratório é ainda elevada e resulta continuamente em consequências médicas graves ou irreversíveis. É fundamental desenvolver um sistema de qualidade eficaz e eficiente para prevenir e reduzir os erros e atrasos, ou pelo menos detectar e corrigi-los antes que seja tarde demais.
Este estudo centra-se na avaliação de risco da segurança do paciente nos processos completos (ou seja fases pré-analítica, analítica e pós-analítica) num laboratório clínico recém-inaugurado: o laboratório de Biologia Molecular núcleo (Núcleo BM) no Hospital Clínic de Barcelona. O estudo é uma avaliação do risco potencial que ajuda a avaliar e melhorar os processos concebidos antes da sua plena aplicação, de forma a garantir a qualidade de laboratório, bem como a segurança do paciente, em última instância.
De acordo com as normas e diretrizes da ISO, os processos do núcleo BM são avaliados utilizando o método “Failure Modes and Effects Analysis” (FMEA), com a ajuda de diagramas de causa-efeito espinha de peixe. Foram identificados 216 riscos, a maioria das quais eram de pré-Analytica e fases de análise. 21 riscos foram classificados como de alto ou médio prioridade a ser tratado, que se concentrou principalmente na qualidade da amostra e procedimentos manuais. Ações foram propostas para os processos relevantes para a implementação.
Este é o primeiro estudo na Europa, que aplicado FMEA em um laboratório clínico hospitalar no âmbito TTP, isto é, as fases pré-analítica, analítica e pós-analítica do núcleo BM. Ele lançou as bases do sistema de gestão de risco em laboratório, e permite a melhoria futura de ambas as etapas detalhadas e alcance geral.
Palavras chave: Risco, Segurança do Paciente, Laboratório Clínico, Processo Analítico, FMEA
5
LIST OF ACRONYMS
AF Fragment Analysis
CDB Biomedical Diagnostic Center
CE Extraction Center
CLI Clinical Laboratory Interface
CLSI Clinical and Laboratory Standards Institute
Core BM Core Molecular Biology Laboratory
FMEA Failure Modes and Effects Analysis
HCB Hospital Clínic de Barcelona
ISO International Organization for Standardization
PCR Polymerase Chain Reaction
QC Quality Control
Reception CE Reception of Extraction Center
RL Risk Level
RM Reception of Samples (Reception de Muestras)
RPN Risk Priority Number
SEQ Sequencing
SIL Laboratory Informatics System
SOP Standard Operating Procedure
TAT Turnaround Time
TTP Total Testing Process
UGC Client Management Unit (Unidad de Gestión de Clientes)
6
LIST OF FIGURES
Figure 1. The Brain-to-Brain Loop of TTP ... 12
Figure 2. Risk Management Process ... 15
Figure 3. Fishbone Diagram for Errors or Delays in the Pre-analytical Phase ... 20
Figure 4. Fishbone Diagram for Errors or Delays in the Analytical Phase ... 21
Figure 5. Fishbone Diagram for Errors or Delays in the Post-analytical Phase ... 22
Figure 6. CDB Organizational Chart ... 23
Figure 7. Process Map of Reception CE ... 26
Figure 8. Process Map of CE ... 29
Figure 9. Process Map of CE (Reception of Urine) ... 31
Figure 10. Process Map of RM ... 32
Figure 11. Process Map of Secretary UGC (Pre-analytical Phase) ... 34
Figure 12. Process Map of Secretary UGC (Post-analytical Phase) ... 37
Figure 13. Process Map of Extraction Platform ... 39
Figure 14. Process Map of Robot 1 ... 42
Figure 15. Process Map of Robot 2 ... 45
Figure 16. Process Map of Robot 3 ... 48
7
LIST OF TABLES
Table 1. Severity Scoring Criteria ... 17
Table 2. Probability Scoring Criteria ... 18
Table 3. Detectability Scoring Criteria ... 18
Table 4. RPN Matrix ... 19
Table 5. FMEA: General ... 54
Table 6. FMEA of Reception CE ... 55
Table 7. FMEA of CE ... 58
Table 8. FMEA of CE (Reception of Urine) ... 60
Table 9. FMEA of RM ... 62
Table 10. FMEA of Secretary UGC ... 69
Table 11. FMEA of Core BM General ... 72
Table 12. FMEA of Extraction Platform ... 74
Table 13. FMEA of Robot 1 ... 77
Table 14. FMEA of Robot 2 ... 78
Table 15. FMEA of Robot 3 ... 81
Table 16. FMEA of Sanger SEQ and AF ... 83
Table 17. FMEA of Physician Validation and Sample Archiving ... 85
8
1
INTRODUCTION
1.1 Patient Safety in Healthcare Industry
Among the 10 facts published by WHO in 2014, it is estimated that in developed countries as many as 1 in 10 patients is harmed while receiving hospital care [1]. This rate is nowhere lower in the European countries: every 10th patient in Europe experiences preventable harm or adverse events in hospital, causing suffering and loss for the patient, their families and healthcare providers, and taking a high financial toll on healthcare systems [2].
The moral imperative that generations of students and doctors have taken to be an ethical foundation to their practice – “first do no harm” – is one that is flouted inadvertently or deliberately on a daily basis [3]. However nowadays healthcare is not as safe as it should be. What goes wrong? According to the Murphy’s Law, whatever can go wrong, will go wrong. In the context of healthcare industry, it works the same. And the cost is inevitably – patient safety.
Based on 1984 data developed from reviews of medical records of patients treated in New York hospitals, the US Institute of Medicine (now National Academy of Medicine) published the famous report: "To Err Is Human: Building a Safer Health System." [4], which dropped a bombshell on the healthcare industry by reporting that up to 98,000 Americans per year die directly as a result of medical errors. The number disclosed that medical errors represent one of the leading causes of death and injury in the US [5], probably the third one following heart diseases and cancers [6, 7]. The fact was reinforced the next year by the UK's “An Organisation with a Memory” [8].
Since then, the issues of patient safety and medical errors have become important topics in health policy and healthcare practice in several countries. And they are discussed ubiquitously in the mass media to continuously draw attention and criticism of the public. The healthcare professionals have been making more prospective effort to counteract this problem. The US, Australia, UK, Denmark and Canada are among the pioneers to build a safer healthcare system for patients by initiating focused efforts to reduce medical errors and improve patient safety [9].
Despite the worldwide concern of this topic, there is no standard definition of “patient safety”. WHO defines “Patient safety is the absence of preventable harm to a patient during the process of healthcare. The discipline of patient safety is the coordinated efforts to
9
prevent harm, caused by the process of healthcare itself, from occurring to patients.” [10]. Summarizing the similar definitions from the WHO Regional Office for Europe [11], the UK National Health Service (NHS) [12], the Agency for Healthcare Research and Quality [13], and academic books and literatures [14, 15], the main characteristics of “patient safety” are:
(1) The ultimate goal is to eliminate preventable harm from reaching to the patient;
(2) Preventable harm is generated during healthcare processes, which include errors that deviate from the good medical practise, and preventable accidents during the course of healthcare service (e.g. accidental falls);
(3) Preventable harm may cause physical or mental injury for a patient (from mild to severe);
(4) Errors that could have caused harm to patients should also be considered (potential hazard);
(5) The approach is to prevent, recover and reduce errors and accidents as much as possible;
(6) Ensuring patient safety is a systematic effort through the processes of delivering care in a complex system, not an "individual provider issue".
Despite the continuous effort made by healthcare professionals, the situation seems to be worse. An updated estimate was developed from modern studies published from 2008 to 2011. The number of premature deaths associated with preventable harm to patients was estimated at more than 400,000 per year in the US. Serious harm seemed to be 10- to 20-fold more common than lethal harm [16]. However, the data revealed is only a tip of an iceberg. First, the data is only about deaths, not including other level s of harms. Second, the outpatient data is difficult to collect. Third, the studies can only collect the incidents that are directly attributed to healthcare process while many lay hide due to lack of clear evidence. Fourth, the data is not adequately reported largely as a result of attempting to avoid blame. In the UK, it is estimated that only 5% of incidents are adequately reported [17].
While healthcare has become more effective it has also become more complex, with greater use of new technologies, medicines and treatments [11]. Admitting the fact that the automation, modern technology and better trained staff may have reduced the possibility of
10
errors, patient harm caused by medical errors increased nonetheless. The reasons could be complex:
- Increased complexity of medical practice and operational management
- Higher expectation vs. more difficult decisions required by aging population and complicated diseases
- Overloaded work with rapider patient flow vs. increasing economic pressure
- Overuse of risky, invasive, revenue-generating procedures
- Over-confidence on new technology and procedures
- Barriers in cross-disciplinary teams communication
Patient safety is a multifactorial and complex issue that has no one-shot solution. It needs all parties’ effort and cooperation. These efforts rely on the patient and his family, the healthcare professionals and organizations, in the regulatory and accreditation bodies, among suppliers, and at policy levels, including government and non-governmental organizations.
Patient safety is now recognized in many countries, with global awareness fostered by the WHO’s World Alliance for Patient Safety. And yet there continue to be significant challenges to implementing patient safety policies and practices. However it is worthy of accepting these challenges not only for the patient welfare, but also for saving the resources and costs for the healthcare industry and the government. European Statistics show that strategies to reduce the rate of adverse events in the European Union alone would lead to the prevention of more than 750,000 harm-inflicting medical errors per year, leading in turn to over 3.2 million fewer days of hospitalization, 260,000 fewer incidents of permanent disability, and 95,000 fewer deaths per year [2].
1.2 Clinical Laboratory and Patient Safety
Diagnostic errors are an important source of preventable harm [18]. To a large extent, the diagnosis for patients depends directly on the clinical laboratory results [19, 20]. Laboratory testing is widely used to diagnose disease and disease subtypes, to determine optimum treatments and patient’s likely response to a treatment, to make judgment of patient’s recovery, etc. Among medical errors, the laboratory errors are the mostly neglected,
11
underestimated, but significant factor which contributes almost 55-58% of diagnostic errors [20, 21].
Therefore, it is very important to make sure that laboratory services are of high quality – as medical decisions made based on them could only be as good as the quality of the results supplied. To better control the quality delivered by the clinical laboratory, generations of physicians tried to describe the loop of testing process. Thus, a now widely accepted concept of “Total Testing Process” (TTP) evolved through the past 40 years.
The concept was firstly shaped in 1971 aiming to aid the predicted automated clinical laboratory testing process [22]. Lundberg developed the idea to the “brain-to-brain turnaround time loop”, focusing more on the patient-clinician reaction and the interaction with the laboratory test. “A laboratory test begins when a clinician’s brain decides there is a need for such a test. It proceeds through a series of steps from that point forward: Question, test selection, ordering, identification of patient and specimen, collection, transportation, preparation, analysis, reporting, interpretation, and action.” [23].Sometimes the first two steps are integrated to the ordering step since they are in the brain of the clinician that will be reflected in the ordering. Schumacher, et al. suggested “patient effect follow-up” should be added after action as the final step [24].
The TTP is a systems-based framework for the evaluation of the interactions, connections, and activities involved in the testing process. The process is circular and includes the all phases of the testing cycle. Cognitive tasks are required at multiple steps, by both the primary care provider and the laboratory [25]. Anything that stands in the way of the prompt and perfect receiving of laboratory results for the patients is perceived as a "laboratory problem or error." If any inappropriate action occurs within this loop, it will cause, at the most, a tragedy and, at the least, a waste [26]. This framework allows the design and implementation of interventions that may reduce or eliminate errors that adversely affect testing and patient-health outcomes. This framework also allows for the study of barriers and limits to quality-improvement activities. The TTP encompasses all components or steps of the cycle from the point of the clinical question to the point of clinical action [25]. Traditionally it is a cycle consisting of three phases: pre-analytic, analytic, and post-analytic phases. Figure 1 shows the TTP adapted from Smith, et al. [25] and Plebani, et al. [27].
12
Figure 1.The Brain-to-Brain Loop of TTP (adapted from [25, 27])
The quality of all processes occurring in these phases, associated in a workflow, determine the quality of test or results, e.g. accuracy, precision, reliability, turn-around time, etc. However, most attention - developmental and strengthening efforts (e.g. quality assurance system, new technology, maintenance etc.) - has been focused on the analytic phase. The pre-analytic and post-analytic phases, which are also referred to as clinic-laboratory interface (CLI), have been largely neglected. Errors are known to occur in any of the phases, with majority of the errors being found to occur in the pre-analytic and post-analytic phases. The testing processes that are more affected are those that occur outside the laboratory, meaning at healthcare facilities. Such processes include: specimen collection, storage of specimen, specimen packaging and transportation, completion of test forms, test ordering, test result collection and filing, and finally using and acting upon the results for patient management and decision making. Some of the errors particular to CLI include inappropriate test requests, misidentification of patient, inappropriate test tube, inadequate sample collection and transport, inadequate sample/anticoagulant volume ratio, insufficient sample, labelling errors, improper data entry, etc. For the provision of high quality laboratory services that respond to healthcare needs, it would be necessary to pay attention
Ordering Identification Collection Processing Transportation Pre-treatment Analysis Validation Reporting Interpretation Action P re -a na ly tica l P o st -a na ly tica l Analytical
13
and strengthen all the phases in laboratory process cycle [28].With this consideration, this study includes all the upstream and downstream workflow of Core BM to assess the risk.
1.3 Clinical Laboratory Quality Management
The past decades have seen sustained improvements in analytical performances, such as the reduction of the turnaround time (TAT), but the error rate, particularly in pre- and post-analytical phases is still high [29]. There exist many obstacles to build a clear and quantity-oriented monitoring system. The lack of a universally accepted methodology and “allowable error rate”, the practical difficulty in reporting and measuring the number of errors, reduce the possibility of evaluating the impact of laboratory errors on patient safety. Bonini, et al. pointed out several major factors: there is a need for better definition of laboratory errors and their causes, for classifying laboratory errors by relating them to their effects on patient outcomes, and for allowing definition of the relevance of the error itself. A standard for laboratory error detection and reporting needs to be defined, and an accurate analysis of the risk of errors in the clinical laboratory needs to be performed.
Among recent independent studies, laboratory error data was collected from worldwide healthcare organizations and analyzed. Different error classification systems and safety assessment criteria were proposed. Specific risk management guidelines were also developed for managing the health risk in clinical laboratory errors [30, 31]. Risk management can minimize the chance of errors and ensure reliability of test results in a prospective way. It develops various quality control activities employed by the laboratory to achieve the goal of generating accurate and reliable test results.
1.4 Risk Management and Patient Safety
Compared to the risks in any other industries, healthcare is a relatively high risk area [32] and has less tolerability of errors. Medical errors are extremely serious and thus very sensitive to the general public.
ISO/IEC Guide 51:2014 defines “safety” as “freedom from risk which is not tolerable” [33]. “ISO15189:2012 Medical laboratories - Requirements for quality and competence” requires: “The laboratory shall evaluate the impact of work processes and potential failures on examination results as they affect patient safety, and shall modify processes to reduce or eliminate the identified risks and document decisions and actions taken.” [34]. To ensure patient safety, as a part of clinical laboratory quality management system, risk management
14
for a clinical laboratory is a necessity. It is a valuable tool that can help managers and clinical staff improve their work and the care delivered to patient [35].
Risk management benefits the healthcare industry as it:
- Strives for the optimal balance of risk by focusing on the reduction or mitigation of risk while supporting and fostering innovation so the greatest returns can be achieved with acceptable results, costs and risks;
- Helps healthcare organizations comply with the quality standards and obtain or maintain accreditations;
- Supports better decision-making through a solid understanding of all risks and their likely impact;
- Helps healthcare organizations plan for uncertainty, cope with the impact of unexpected events and increase staff, patient and public confidence in care that is delivered with well-considered contingency plans;
- Highlights the weakness and vulnerability in procedures, practices and policy changes.
2 STUDY OBJECTIVES
This risk assessment study is designed to identify and assess the potential risks that could affect patient safety in the Molecular Biology Laboratory (Core BM) and related pre-analytical and post-pre-analytical areas; to propose improvement actions in order to remove, reduce or control the risks; and to lay the foundation of the risk management system for Core BM.
3 RATIONALE AND METHODOLOGIES
15
Figure 2. Risk Management Process [36]
Ideally, risk assessment is performed at the start of a new system design or before its implementation. For ongoing systems, a retrospective risk assessment can also be performed to make improvements. However, considering the organizational structure and heavy workload in the reality of Core BM, the risk assessment is performed in different situations:
(1) For pre-analytical and post-analytical phases, both are functioning according to a well-established system. Only the interface processes with Core BM are new. However all of the processes have impact on the Core BM work flow, and they have never been assessed this way. A risk assessment was performed for all the processes in pre-analytical and post-analytical phases, also considering that almost 80% of laboratory errors originate from these less-automated areas [20].
(2) For the analytical phase, since the Core BM clusters several common functions within the CDB, all the working processes are maintained directly from previous functions and are implemented immediately. The risk assessment can only be performed while the system is functioning. What makes the situation more complicated is: new equipments are under testing while the old equipments are still in service; all the equipments are functioning while being adjusted frequently; the interfaces with other services are new and not unified.
16
Considering the time limitation, the step of risk treatment, monitoring and review were not performed within this study but will be continued in the hospital.
3.1 ISO Standards of Quality and Risk Management
The laboratory follows the general principles of “ISO15189:2012 Medical laboratories — Requirements for quality and competence” [34]. This study follows “ISO31000:2009 Risk management” [36], and “ISO/IEC Guide51:2014, Safety aspects — Guidelines for their inclusion in standards” [33]. The terminology used in this study refers to “ISO/IEC Guide73:2009 Risk management – Vocabulary - Guidelines for use in standards” [37].
3.2 Failure Modes and Effects Analysis
While the whole system related to Core BM is functioning without previous risk assessment, a prospective Failure Modes and Effects Analysis (FMEA) is performed. Ideally, FMEA begins during the earliest conceptual stages of design and continues throughout the life of the system service when changes occur. In the case of Core BM, FMEA was performed at the time of transition and trial operation.
From the ISO/TS223671 definition, FMEA is a systematic review of a system or product
involving identification of potential failures and assessing the impact on total system/product performance of that failure. FMEA was first introduced in US military in 1960s and developed by the aerospace and automotive industries [38]. It has been adopted by the healthcare industry since 1990s. With the requirement of JCHAO [39], now FMEA is universally applied in healthcare industry especially in clinical laboratory [40]. This study adopts the Clinical and Laboratory Standards Institute (CLSI) guidelines for FMEA [30] and customizes the methodology according to the actual situation for Core BM.
The steps applied in this study are as follows (adapted from the recommendation of American Society for Quality [38]:
1) Assemble a cross-functional team of people with diverse knowledge about the organization, process, equipments and customer needs.
2) Identify the scope and boundaries of the FMEA. It is for the newly-built Core BM and all its related processes. It should be as detail as possible to identify every possible error.
17
3) Break the scope into separate subsystems: pre-analytical, analytical and post-analytical phases. Within each subsystem, identify different processes dedicated to diverse functions.
4) For each function, identify all the potential failure modes for every process (how the process could go wrong), with the help of process maps. This is a brainstorming step that needs to analyze all the factors within each single process and to hypothesize the ways they can go wrong.
5) For each failure mode, identify all the potential consequences on the process, related processes, or the delivered outcome (identify all possible “Immediate Effects” in regards of process failure or testing result), and finally on patient safety (“End Effects”). Determine how serious the “End Effects” is. Severity (S) is rated on a scale from 1 to 5 (Table 1). If a failure mode has more than one potential “End Effects”, use the highest severity score (the worst).
Table 1. Severity Scoring Criteria
Severity (S) The potential end effects on lab result output for one run, or directly on patient safety
Value Significance Definition
1 No relevant effect
on safety No effect on patient safety, system operable, history data not well maintained
2 Minor Result acceptable with minor defect or can be corrected easily and immediately, patient mental discomfort (confusion, anxiety, distrust, etc.)
3 Moderate Result acceptable with obvious defect, need more effort to correct. E.g. inaccurate or incomplete
4 Critical Delayed or unreliable result, unacceptable result or repetition needed, delayed diagnosis/ treatment, patient is mal-treated physically, e.g. blood is taken more than necessary
5 Catastrophic
Erroneous result that will misleading the diagnosis, no result, or patient safety is directly jeopardized. E.g. incorrect or reversed result, patient is treated with wrong approach or adverse event is resulted
6) For each failure mode, determine all the potential causes applying the best knowledge and experience of the team. The causes are used to estimate the probability (P), to identify the existing detection methods for assigning detectability (D), and finally to propose actions.
7) For each failure mode, determine the probability of its occurrence during the lifetime of the scope (considering all the causes that could result in this failure mode). Determine
18
how likely or frequently it is to occur. Probability (P) is rated on a scale from 1 to 5 (Table 2). The probability can be estimated with the reference of the relevant history record, if exists.
Table 2. Probability Scoring Criteria
Probability (P) Frequency or likelihood to which extent the failure mode is likely to occur
Value Significance Definition
1 Extremely unlikely or Never detected < 1 in 150,000 patients or cases (< 0.0007%) 2 Remote > 1 in 10,000 patients or cases (0.01%) 3 Occasional > 1 in 2,000 patients or cases (0.05%) 4 Reasonably possible > 1 in 200 patients or cases (0.5%) 5 Frequent > 1 in 20 patients or cases (> 5%)
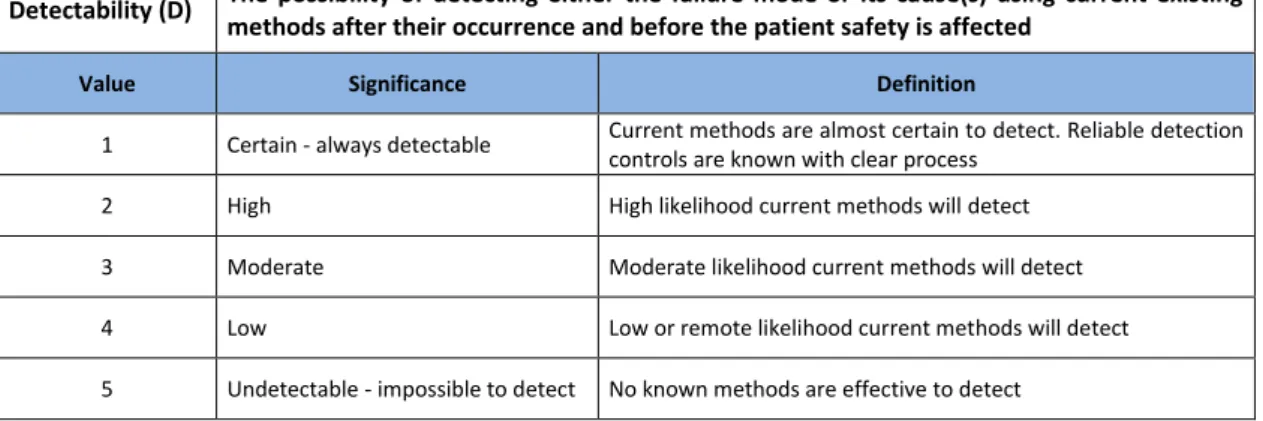
8) For each failure mode, identify current methods of detection for all the causes and the failure mode itself. These methods might prevent the causes from leading to a failure, reduce the probability of occurrence or detect the failure mode after its occurrence but before the patient safety is affected. In other words, the detectability defines the probability of stopping the failure from leading to the end effect on patient safety. The score determines how difficult it is to detect the failure mode or its causes. Detectability (D) is rated on a scale from 1 to 5 (Table 3).
Table 3. Detectability Scoring Criteria
Detectability (D) The possibility of detecting either the failure mode or its cause(s) using current existing methods after their occurrence and before the patient safety is affected
Value Significance Definition
1 Certain - always detectable Current methods are almost certain to detect. Reliable detection controls are known with clear process
2 High High likelihood current methods will detect 3 Moderate Moderate likelihood current methods will detect 4 Low Low or remote likelihood current methods will detect 5 Undetectable - impossible to detect No known methods are effective to detect
9) Organize team review meetings to review the identified failure modes, effects, causes, detection methods, and the rating is given with the agreement of all team members. This is a time-consuming step that needs rounds of discussions to reach final agreement.
19
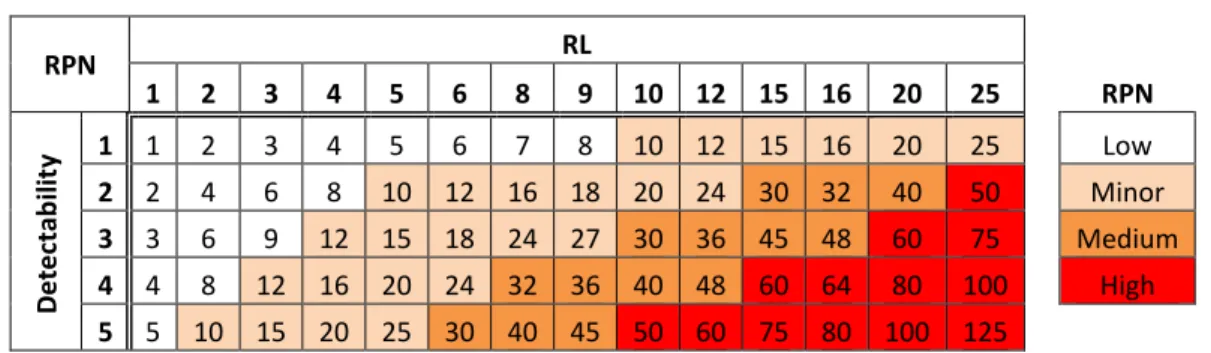
10) Calculate the risk priority number (RPN), which equals S × P × D. These numbers provide guidance for ranking potential failures in the order they should be treated. The RPN matrix (Table 4) defines the priority of treating the risks.
Table 4. RPN Matrix RPN RL 1 2 3 4 5 6 8 9 10 12 15 16 20 25 RPN D e te ctab ili ty 1 1 2 3 4 5 6 7 8 10 12 15 16 20 25 Low 2 2 4 6 8 10 12 16 18 20 24 30 32 40 50 Minor 3 3 6 9 12 15 18 24 27 30 36 45 48 60 75 Medium 4 4 8 12 16 20 24 32 36 40 48 60 64 80 100 High 5 5 10 15 20 25 30 40 45 50 60 75 80 100 125
11) Propose recommended actions. These actions may be design or process changes to lower severity or probability. They may be additional methods to improve detection.
12) As actions are completed, evaluate new S, P or D ratings and calculate new RPNs. Check if improvements are shown after the implementation of the recommended actions.
13) Note: Risk in FMEA is identified by "failure mode". Each "failure mode" can result in multiple effects and can have multiple causes. As such, finally multiple actions can be proposed to all the causes to eliminate the occurrence of one "failure mode" (one row).
3.3 Fishbone Cause-Effect Diagram
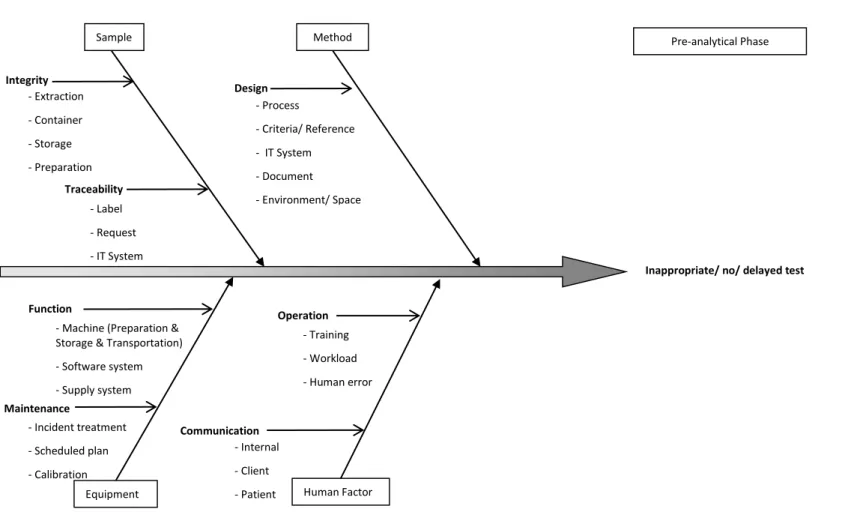
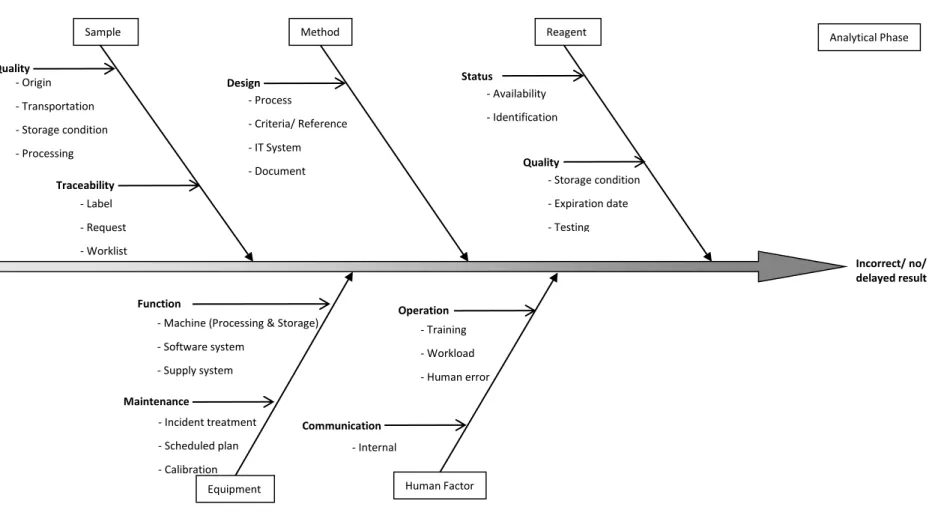
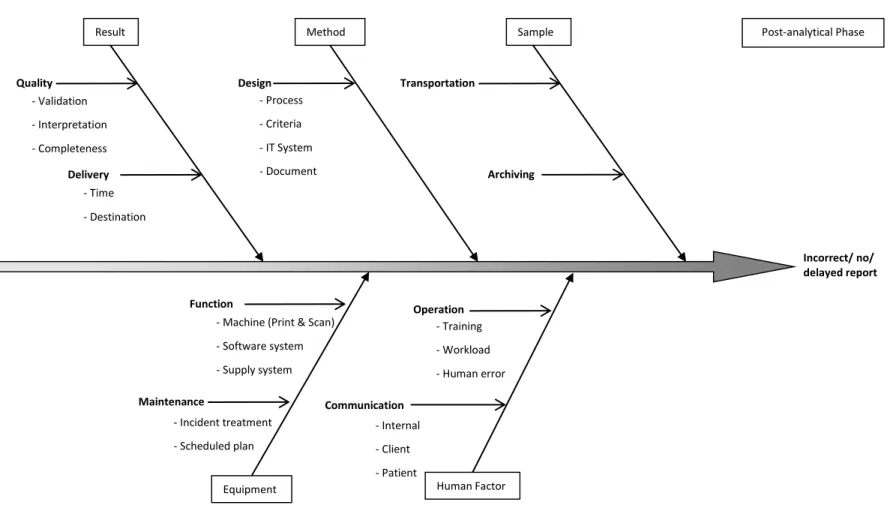
The fishbone diagram (Ishikawa Diagram) helps to structure a systematic thinking. It identifies all the possible cause categories for a general effect (the loss of a function) and helps in FMEA step 6. This study developed the fishbone diagrams with the reference of American Society for Quality [41]. They are described for for pre-analytical phase (Figure 3) analytical phase (Figure 4) and post-analytical phase (Figure 5).
20
Figure 3. Fishbone Diagram for Errors or Delays in the Pre-analytical Phase
Inappropriate/ no/ delayed test
Sample Method
Equipment Human Factor
Traceability - Label - Request - IT System Design - Training - Workload - Human error Operation
- Machine (Preparation & Storage & Transportation) - Software system - Supply system Function Maintenance - Process - Criteria/ Reference - IT System - Document - Environment/ Space Communication - Incident treatment - Scheduled plan - Calibration - Internal - Client - Patient Pre-analytical Phase Integrity - Extraction - Container - Storage - Preparation - Transportation
21
Figure 4. Fishbone Diagram for Errors or Delays in the Analytical Phase
Incorrect/ no/ delayed result
Sample Method
Equipment Human Factor - Origin - Transportation - Storage condition - Processing Traceability - Label - Request - Worklist Design - Training - Workload - Human error Operation
- Machine (Processing & Storage) - Software system - Supply system Function Maintenance - Process - Criteria/ Reference - IT System - Document - Environment/ Space Communication - Incident treatment - Scheduled plan - Calibration - Internal Analytical Phase Reagent Status - Availability - Identification Quality - Storage condition - Expiration date - Testing Quality
22
Figure 5. Fishbone Diagram for Errors or Delays in the Post-analytical Phase
Incorrect/ no/ delayed report
Result Method
Equipment Human Factor
Quality - Validation - Interpretation - Completeness Delivery - Time - Destination Design - Training - Workload - Human error Operation
- Machine (Print & Scan) - Software system - Supply system Function Maintenance - Process - Criteria - IT System - Document Communication - Incident treatment - Scheduled plan - Internal - Client - Patient Post-analytical Phase Sample Transportation Archiving
23
4 RESULTS AND DISCUSSIONS
4.1 Scope and Boundaries
This study was applied to the Core BM in the Biomedical Diagnostic Center (CDB) of Hospital Clínic de Barcelona. The Core BM was newly-built in January 2016 to centralize a series of DNA analysis services that were previously performed separately by individual department.
The CDB comprises all the laboratories of Hospital Clínic de Barcelona. It attends to the laboratory needs of 400,000 patients annually from Hospital Clínic de Barcelona and receives samples from 80,000 patients seen in other hospital centers and private laboratories. Approximately 7,000,000 determinations within 2,327 different tests are performed per year [42].
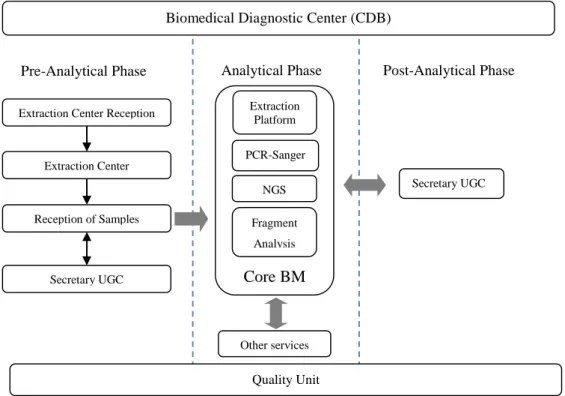
To assess the risks, the entire workflow of the Core BM was studied, including pre-analytical, analytical and post-analytical phases. The CDB laboratory departments studied are described in the organization chart in Figure 6.
Figure 6. CDB Organizational Chart
Extraction Center Extraction Center Reception
Reception of Samples Secretary UGC Other services Extraction Platform PCR-Sanger NGS Fragment Analysis Core BM
Pre-Analytical Phase Analytical Phase Post-Analytical Phase
Secretary UGC
Quality Unit
24 General function of each department:
- Extraction Center Reception (Reception CE): Patient goes to the Reception CE first to activate the test request(s) and/or to ask for information. The detailed processes are shown in Figure 7.
- Extraction Center (CE): Patient blood sample is extracted and urine sample is collected in CE. The detailed processes are shown in Figure 8 and Figure 9.
- Reception of Samples (RM): The internal and external samples are received, registered, processed and transported to analytical laboratories. The detailed processes and its interaction with Secretary UGC are shown in Figure 10.
- Secretary UGC: For both pre-analytical and post-analytical phases, the internal and external incidences and requirements are managed, documents and result reports are archived and managed. The detailed processes are shown in Figure 11 and Figure 12.
- Core BM Extraction Platform: Samples from RM and other internal and external clients are received, registered. DNA is extracted, normalized and quantified. The detailed processes are shown in Figure 13 and Figure 14.
- Core BM PCR Sanger: From the extracted DNA, the entire PCR Sanger sequencing process is performed. The entire processes are shown in Figure 15, Figure 16 and Figure 17.
- Core BM NGS: Currently NGS robot process has not been established. This study excludes the NGS process.
- Core BM Fragment Analysis: It is performed for the DNA samples sent from other services. The detailed processes are shown in Figure 17.
- Other services: Samples of different type can be sent directly from other CDB services to Core BM, and are extracted or analysed here. In some cases samples are returned to these services per request. The interaction between Core BM and other services are generally shown in Figure 13 and Figure 17.
25 4.2 Cross-Functional Team Organization
The professionals included in the cross-functional team are:
Pre- and Post-analytical area team: 2 laboratory coordinators, 1 quality unit expert, 1 facilitator;
Analytical area (Core BM) team: 2 technicians, 3 laboratory physicians (one of them is also the Core BM manager, and another one is the Core BM quality manager), 1 quality unit expert, 1 facilitator.
3 rounds of review meetings were held for reviewing and assessing the risks of pre- and post-analytical area; while 6 were held for reviewing and assessing the risks of Core BM.
4.3 Process Maps
In this chapter, the process maps for each individual department are described in detail (Figure 7 to Figure 17), based on the observational studies and interview with 4 staff in Reception CE, 8 staff in CE, 12 staff in RM, 7 staff in Secretary UGC, 7 technicians and 3 physicians in Core BM.
General instructions of reading the process maps:
- Following each process map, a detailed annotation is described for each numbered step. The same steps across the departments are not described repeatedly.
- The dash lined steps are performed by other departments, which interact with the department described in the process map.
- The multi-process steps are either described in a separate process map, or described in the following text.
26
4.3.1 Pre-analytical Phase: Reception of Extraction Center
Figure 7. Process Map of Reception CE
No
No Yes
Print request and activate
9. Print labels and give to patient Q-Matic 8. Combine requests 11. Assign SGC category and nº of extraction No Yes Yes
4. Program functional tests
7. Multiple requests? 4. Functional
tests? 3. Ask for result or
proof? No
Yes
3. Prepare result or proof
Lab report copy
IMP-834 Proof of Attendance IMP-835 Proof of Companion
IMP-812 Functional Tests Agenda
IMP-821 Functional Tests Appointment Sheet
Patient name OK? 2. Patient reception: ask patient name
No 1. Organize and call
patients in the queue
Patient leaves for CE Patient visit
10. 24h urine sample and label consistent?
Yes
12. Call patient for re-appointment Re-extraction request
13. Create new request
Coordinator email
No
Reception CE
Yes
Yes
Appointment, request, DNI, TSS
5. Activate
request in SIL OK? 6. Find in SAP? No
15. Manage incidences
IMP-823 Resolution of incidences
Patient information
General Analytical Request Form
27
1. Organize and call patients in the queue: Patients are grouped according to the appointment time (every 15 min is one group). Q-Matic displays the current appointment group on the screen. Patients who have the appointment of this time queue in front of the reception desks and go to the desks one by one. After the completion of one group (about 15 min), call the next group by pressing the Q-Matic keyboard.
2. Patient reception: ask patient name: ask the name of the patient, check the consistency with the lab test request that the patient brings. If the patient does not bring the request, check with the other documents that the patient brings: appointment, DNI (ID card) or TSS (Social Health Card).
3. Ask result or proof? : If the patient comes to fetch his previous test result, print a lab report copy as requested. If the patient asks for a proof of attendance or a proof of companion, prepare accordingly and stamp it.
4. Functional tests? : If the patient comes to schedule his functional tests, desk 4 staff should program the schedule in the excel “IMP-812 Functional Tests Agenda” and manually complete the “IMP-821 Functional Tests Appointment Sheet” and give to the patient.
5. Activate request in SIL OK? : If the patient comes with a request to give samples, activate the request in SIL by scanning the barcode of request number. Manage incidence if it occurs.
6. Find in SAP? : When the patient does not bring his request or request cannot be activated in SIL, search in SAP to find the correct request.
7. Multiple requests? : Patient may come with more than one request. There are different tests on different requests.
8. Combine requests: Activate each request and select “combine” in SIL. SIL automatically adopts the number of the oldest request. By doing so, all the tests have the same request number.
9. Print labels and give to patient: After the activation of all requests for one patient, print all the test labels and give them to the patient.
10. 24h urine sample and label consistent? : When there is a label for “24h urine”, if the patient does not bring the sample, create a new request for the test “24h urine” in SIL so
28
that the patient can bring the sample next time. If patient brings the sample or there is no label for “24h urine”, patient can leave for extraction directly.
11. Assign SGC category and nº of extraction: According to the information given by the patient himself or from the request, assign SGC category (Normal, Urgent, Port-a-cath, Sintrom, Wheelchair, Histocompatibility, Myelography) and nº of extraction and give the ticket to the patient.
12. Call patient for re-appointment: If a re-extraction request email from the coordinator is received, call the patient and make a new appointment for extraction. The email contains all information such as patient name, old request number, test name, reason for re-extraction, etc.
13. Create new request: Register in SIL the repeated tests and complete manually “General Analytical Request Form”, only for the “24h urine” and other repeated tests. In the case of “24h urine” (patient is present without 24h urine sample), patient should bring the new request form together with the sample in his next visit. In the case of phone call re-extraction, archive the new request form and activate when patient comes for re-extraction.
14. Archive requests: When patient leaves for extraction, archive the requests activated. In the case of phone call re-extraction, archive the printed email together with the manual request form for patient’s next visit.
15. Manage incidences: Try to solve the incidence immediately. When nonconformity occurs, register in “IMP-823 Resolution of incidences”.
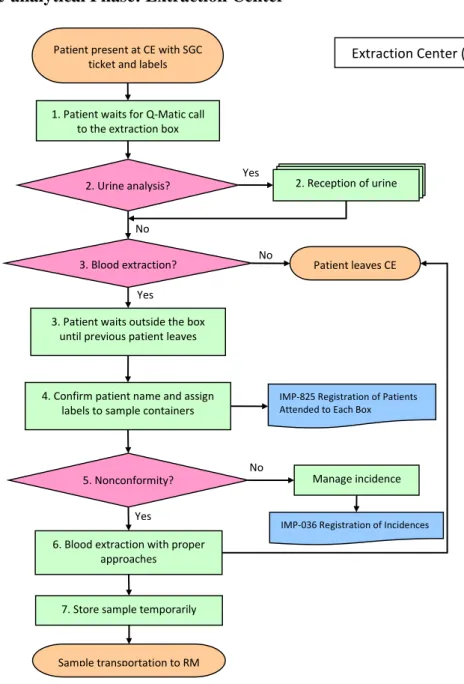
29 4.3.2 Pre-analytical Phase: Extraction Center
Figure 8. Process Map of CE
1. Patient waits for Q-Matic call to the extraction box: Patient comes to CE with SGC ticket and labels (and sometimes with 24h urine sample), waits until his number appears on the Q-Matic screen.
2. Urine analysis? : If there is urine sample(s) to be collected, patient stops firstly at the urine reception desk and follows the processes of “Reception of Urine” (Figure 9). If no urine sample, patient goes to the assigned box for blood extraction.
3. Blood extraction? : If no blood sample is going to be collected, patient can leave the CE. Otherwise patient should wait outside the assigned box until the previous patient leaves.
Yes
7. Store sample temporarily 3. Patient waits outside the box
until previous patient leaves
IMP-036 Registration of Incidences
No 5. Nonconformity?
No 1. Patient waits for Q-Matic call
to the extraction box Patient present at CE with SGC
ticket and labels Extraction Center (CE)
2. Reception of urine 2. Urine analysis? Yes No 3. Blood extraction? Yes Patient leaves CE
IMP-825 Registration of Patients Attended to Each Box
4. Confirm patient name and assign labels to sample containers
Manage incidence
6. Blood extraction with proper approaches
30
4. Confirm patient name and assign labels to sample containers: Extractor asks the patient name and checks with the name on the label(s). The header label is pasted on “IMP-825 Registration of Patients Attended to Each Box”, and then the sample labels are assigned to corresponding types of containers (tube, syringe, etc.).
5. Nonconformity? : If nonconformity occurs, extractor should manage accordingly. Ask help from coordinator if necessary, register in “IMP-036 Registration of Incidences”. 6. Blood extraction with proper approaches: Extractor selects proper materials and approaches to extract blood samples.
7. Store sample temporarily: Extractor places the samples under required conditions (special conditions include 37ºC incubating, in ice water, light-protected container, etc.) until RM staff collects them.
31
Figure 9. Process Map of CE (Reception of Urine)
1. Record 24h urine: If the patient brings 24h urine sample, weigh and record the volume (according to the weight) on two copies of “IMP-810 Diuresis Sheet”.
2. Aliquot samples: Take necessary aliquot(s) as indicated by the number of label(s). If a patient has more than one bottle of 24h urine, mix before aliquoting.
3. 24h urine necessary? : If patient comes to get a bottle of 24h urine, dispense appropriate container (with or without additives) according to the test. If patient is uncomfortable to return a bottle, give 3 tubes and instruct the patient to record 24h urine volume at home.
4. Other samples? : If other samples are requested (e.g. random urine sample, sputum, feces, etc.), dispense corresponding containers and instruct patient to collect these samples and return them.
5. Collect and label samples: Collect samples returned by the patient, check nonconformity and manage incidences. Assign correct labels to the corresponding containers.
6. Store sample temporarily: Place the samples in the rack until the RM staff collects them. Reception of Urine
Patient brings 24h urine?
No
Yes
1. Record 24h urine 2. Aliquot samples
4. Other samples? Yes Dispense containers and
instruct patient No
5. Collect and label samples
6. Store sample temporarily 3. 24h urine
necessary?
Yes
IMP-810 Diuresis Sheet (2 copies)
Patient present with urine labels
Sample transportation to RM
No
Patient leaves CE Dispense container and
instruct patient
32 4.3.3 Pre-analytical Phase: Reception of Samples
Figure 10. Process Map of RM
1. Other samples: Samples from external clients or other HCB services such as IBC, MIC, AP, etc.
2. Samples/ requests inspection OK? : Check the number of samples, sample integrity and status against the requests. If not ok, reject internal samples or send external samples to Secretary for incidence management and registration.
3. Multiple requests? : If multiple requests (>3) come in a batch, send to Secretary for SIL introduction. Keep the samples in pending boxes and wait for the labels from Secretary.
Reception of Samples (RM)
Yes
Leftovers 4. Activate/ introduce requests in SIL and
print labels
IMP-036 Registration of Incidences
Yes 2. Samples/ requests
inspection OK?
No Samples from CE/ wards
Centrifuge?
Yes
Resolved? HCB Internal/ external requests
8. Sample distribution
IMP-811 Samples Return Card IMP-817 Registration of Samples Return
Secretary manages external incidences
6. Register the traceability and prepare for distribution
1. Other samples
Secretary introduces to SIL and return to RM No 5. Identify samples Yes 7. Aliquot? Yes Frozen? Store in freezer No No No Return samples? Yes 3. Multiple requests? Yes Requests archiving No No
IMP-810 Diuresis Sheet
33
4. Activate/ introduce requests in SIL and print labels: Activate the requests in SIL by scanning request barcode. For non-standard external requests, introduce all the information manually (client, patient and test information). Print labels for all the samples. Archive the requests in different categories and send to UGC.
5. Identify samples: Match and paste the labels with the corresponding sample containers. 6. Register the traceability and prepare for distribution: For the samples transported from CE, scan for “entry” and “exit” in separate computers. For samples received at the reception desks (from the internal wards, services or external clients), scan for “exit” only. Distribute the samples according to first destinations depending on the destination code on the labels: stay for pretreatment (centrifuge, aliquot), send directly to services, send to core lab chain, etc. Register diuresis result (“IMP-810 Diuresis Sheet” received from Urine Reception) in SIL in a separate computer.
7. Aliquot? : Some blood or urine samples need multiple aliquots for different tests. Urine samples are aliquoted manually; blood samples are normally aliquoted by robot that is connected to SIL and assigns labels to aliquots automatically. For insufficient blood samples, technicians do manual aliquoting and assign labels manually.
8. Sample distribution: According to the scheduled timetable and by batch, send the samples to services for testing via different pathways. E.g. samples for MIC, IMM should be sent by pneumatic pipe; samples for IBC or external labs are fetched by particular express companies; some samples must be sent by staff manually. During transportation, the required storage condition should be respected.
34
4.3.4 Pre-analytical and Post-analytical Phase: Secretary UGC
Figure 11. Process Map of Secretary UGC (Pre-analytical Phase)
1. Multiple requests: When RM receives more than 3 requests from one origin, RM keeps the samples in pending boxes and leaves the requests for secretary to introduce to SIL. Secretary returns labels to RM.
2. Requests/ samples with incidences: When there are incidences for any request or sample that RM receives, RM leaves the sample and request for secretary management. Secretary
IMP-036 Registration of Incidences
Secretary UGC
Resolved?
4. Review and correct requests in SIL 1. Introduce to SIL and
print labels 1. Multiple requests
Register & manage incidences
Yes
No No
Requests archiving
2. Requests/ samples with incidences
Leftovers
IMP-811 Sample Return Card IMP-817 Registration of Sample Return
3. Return samples? Yes
CCEE requests with incidences
5. Scan requests Wards requests with incidences
Scholarships and studies requests
External client’s requests
Incidence ?
Yes Register & manage incidences No
IMP-036 Registration of Incidences
IMP-802 Reception of Requests
6. Register request origin and quantity
Requests of adding/ deleting tests
Possible? Yes 7. Add/ delete tests in SIL IMP-815 Register Modification of Request No
Doctor orders new request
Return to RM
Requests manually introduced to SIL by RM or Secretary
35
manages and registers incidences in “IMP-036 Registration of Incidences”, and returns to RM after incidence is solved.
3. Return samples? : In case of incidence is not solved, ask client if sample(s) should be returned. If yes, prepare transportation documents “IMP-811 Sample Return Card” and “IMP-817 Registration of Sample Return”. If not, destroy the samples.
4. Review and correct requests in SIL: All the requests manually introduced by RM or Secretary should be reviewed another time. Check all the information on the original requests against the introduced information in SIL, correct errors once detected.
5. Scan requests: All the requests received should be scanned and uploaded to SIL. Check if the automatic reading of the request number is correct. If not, correct manually. Once the request number is correctly identified, the scanned file is uploaded to corresponding SIL request automatically.
6. Register request origin and quantity: At the end of the day, record in “IMP-802 Reception of Requests” the number of requests received daily according to the origin (e.g. external clients, wards, scholarships and studies, etc.). Archive the requests.
7. Add/ delete tests in SIL: Doctor calls Secretary to add or delete tests for the samples that are already in processing in the lab. Secretary checks the possibility of adding or deleting, and then accept or reject the request. The newly added test is registered directly in SIL under the ongoing samples and also on a paper form “IMP-815 Register Modification of Request”.
1. Multiple requests: When RM receives more than 3 requests from one origin, RM keeps the samples in pending boxes and leaves the requests for secretary to introduce to SIL. Secretary returns labels to RM.
2. Requests/ samples with incidences: When there are incidences for any request or sample that RM receives, RM leaves the sample and request for secretary management. Secretary manages and registers incidences in “IMP-036 Registration of Incidences”, and returns to RM after incidence is solved.
3. Return samples? : In case of incidence is not solved, ask client if sample(s) should be returned. If yes, prepare transportation documents “IMP-811 Sample Return Card” and “IMP-817 Registration of Sample Return”. If not, destroy the samples.
36
4. Review and correct requests in SIL: All the requests manually introduced by RM or Secretary should be reviewed another time. Check all the information on the original requests against the introduced information in SIL, correct errors once detected.
5. Scan requests: All the requests received should be scanned and uploaded to SIL. Check if the automatic reading of the request number is correct. If not, correct manually. Once the request number is correctly identified, the scanned file is uploaded to corresponding SIL request automatically.
6. Register request origin and quantity: At the end of the day, record in “IMP-802
Reception of Requests” the number of requests received daily according to the origin (e.g. external clients, wards, scholarships and studies, etc.). Archive the requests.
7. Add/ delete tests in SIL: Doctor calls Secretary to add or delete tests for the samples that are already in processing in the lab. Secretary checks the possibility of adding or deleting, and then accept or reject the request. The newly added test is registered directly in SIL under the ongoing samples and also on a paper form “IMP-815 Register Modification of Request”.
37
Figure 12. Process Map of Secretary UGC (Post-analytical Phase)
1. Export SIL tracking report: For big clients who have a large amount of requests, export the result tracking report (“Client file”) for each of them every day.
2. Calculate analysis duration: In each “client file”, calculate the duration of each ongoing test (how many days have passed since sample reception?), and compare with TAT of the test.
3. Incidence? : Get the feedback from corresponding lab, if the delay is caused by any incidence? If yes, record the cause in both “IMP-036 Registration of Incidences” and “Client file pending list”.
Results Management (Post-analytical Phase)
Coincide? 1. Print reports and
checklist in SIL External client results
Yes No Yes Scan reports No 3. Incidence? Yes 2. Erase patient information
No Register & manage
incidences IMP-036 Registration of Incidences
Send by email? Attach reports and send email
3. Wrap and send post mail
Big external clients
1. Export SIL tracking report
2. Calculate analysis duration
Beyond TAT? Send alert to lab Register incidence
Keep follow-up
Yes
No
Client file
IMP-036 Registration of Incidences
4. Check pending list
Client file pending list
5. Client claims
38
4. Check pending list: After calculating the duration against TAT, always check the pending list in each client file. Make sure all tests beyond TAT are well traced.
5. Client claims: Receive claims from internal or external clients via email, telephone or other channels, register & manage incidences in “IMP-036 Registration of Incidences” database. Update or close the incidence after a new action is taken for a specific incidence.
39 4.3.5 Analytical Phase: Extraction Platform
Figure 13. Process Map of Extraction Platform
1. Sample Reception: Usually, samples are transported via pneumatic pipe to Core BM from RM, AP, MIC. The samples are from HCB internal services such as IMM, IBC, etc. or from external labs. Some samples should be transported manually by RM staff due to
No
Yes
10. Store & transport sample No Yes 6. Pretreatment? 5. Manual extraction? Yes
Register & manage incidence 2. Register & print secondary
label in SIL
No
Load in Robot 1 1. Sample Reception Extraction Platform
Yes
No
IMP-036 Registration of Incidences
4. Sample and worklist coincide? No 3. SIL worklist DNA extracted 8. QC OK? Re-extraction 9. Sample for Core BM? 5. Manual extraction 6. Pretreatment 7. Automatic extraction 11. Quantification and/ or normalization? Yes No Yes
Register & transfer in Robot 1 DNA aliquots DNA sample? Yes
40
special requirements of storage. The sample types include: blood, amniotic fluid, biopsy tissue, dried blood spot, inactivated virus, and DNA or RNA2 samples.
2. Register & print secondary label in SIL: Technicians scan the primary samples to register sample reception in SIL, in the meantime all the secondary labels (for DNA extracted or necessary aliquots) are automatically printed. Technicians store the samples in the fridge by category depending on sample types or extraction methods. The secondary labels are kept in a particular box until they are pasted in an empty eppendorf which is used for receiving the final product (normally DNA) or prepared aliquots.
3. SIL worklist: Technicians print the worklist from SIL to obtain the list of samples that are planned to be processed.
4. Sample and worklist coincide?: Technicians check the consistency between samples received and worklist. In case of inconsistent sample number or identity, register and manage incidence by contacting different services.
5. Manual extraction?: For the insufficient blood, amniotic fluid, inactivated virus samples, manual extraction will be performed using different protocols.
6. Pretreatment?: For the dried blood spot, biopsy tissue samples, pretreatment is necessary before automatic extraction. E.g. dried blood spot sample needs to be dissolved in liquid for automatic extraction; tissues should be treated with cell lysis reagents in advance.
7. Automatic extraction: In the case of sufficient blood samples or other samples after pretreatment, samples can be loaded to automatic extractors depending on sample type. MagNA Pure 96 (Roche) is for batch DNA extraction of blood samples (Robot 0 is used for sample transfer before and after MagNA Pure 96 processing); MagNA Pure Compact (Roche) is for a small quantity of samples and normally used for dried blood spot and amniotic fluid extraction. For both extractors, it is necessary to load the empty receiving eppendorfs with secondary labels.
8. QC OK?: DNA samples are quantified with spectrophotometer Nanodrop to test concentration and purity; DNA extracted from amniotic fluid should be examined with electrophoresis. The QC results are registered in notebook as well as in PC. In case of QC
2In the process map, all RNA samples are omitted due to the little amount of request every year, and all RNA samples are managed manually with special kits
41
not pass, repeat QC to confirm. If the DNA quality is not good, re-extraction should be performed for the specific sample.
9. Sample for Core BM?: Technicians read destination code in the secondary label to identify the next stop of the extracted DNA – stay in Core BM for sequencing or fragment analysis, or send to services for other tests.
10. Store & transport sample: Technicians pack the samples (sometimes together with QC reports) according to the destinations. Depending on the destinations, technicians send samples via pneumatic pipe or store them in the fridge temporarily, waiting for RM staff manual transportation.
11. Quantification and/ or normalization?: All the DNA samples (including received DNA samples) that stay in Core BM for sequencing or fragment analysis should be quantified and normalized in Robot 1. In case of insufficient DNA (10ul needed for quantification & normalization) or special conditions, DNA samples will be loaded in Robot 1 only for being transferred to 2D tubes, registration or aliquoting.
42
4.3.6 Analytical Phase: Robot 1 Normalization and Quantification
Robot 1 quantifies and normalizes the extracted DNA in a 2D tube, which goes to Robot 2 for PCR assembly.
Figure 14. Process Map of Robot 1
1. Load samples, sex primers, reagents, extra aliquot tubes: Load DNA samples with barcoded labels, place in correct positions the 2 prepared primers for sex PCR QC, water and TAQ enzyme. Load PCR plate and empty 2D tubes of Sanger (yellow capped tube with a unique 2D code on the bottom) and NGS (red capped tube with a unique 2D code on the bottom, not applied yet). Load extra tubes with correct labels for aliquoting DNA.
1. Load samples, sex primers, reagents, extra aliquot tubes
No
12. Archive samples DNA extracted or received Robot 1 Normalization and Quantification
Yes
Store & load 2D tube DNA (Sanger SEQ)
11. Coincide? 4. Automatic quantification
5. Decap 2D tubes as Robot indicates
Register and manage incidence 3. Set and check parameters
2. SIL data
6. Automatic normalization
8. Assemble sex PCR PCR 9. QIAxcel electrophoresis
Robot 1 report
XX, XY Result
Check working log & manage incidences 10. XX, XY results OK? No Yes 7. Send data to SIL IMP-036 Registration of Incidences IMP-036 Registration of Incidences
Send normalized aliquots to services
![Figure 1. The Brain-to-Brain Loop of TTP (adapted from [25, 27])](https://thumb-eu.123doks.com/thumbv2/123dok_br/18895836.934592/15.892.197.729.97.582/figure-brain-brain-loop-ttp-adapted.webp)
![Figure 2. Risk Management Process [36]](https://thumb-eu.123doks.com/thumbv2/123dok_br/18895836.934592/18.892.204.764.110.544/figure-risk-management-process.webp)