ORIGINAL PAPER
Determination of parathion in biological fluids by means
of direct solid-phase microextraction
E. Gallardo&M. Barroso&C. Margalho&A. Cruz& D. N. Vieira&M. López-Rivadulla
Received: 29 March 2006 / Revised: 4 July 2006 / Accepted: 4 August 2006 / Published online: 5 September 2006
#Springer-Verlag 2006
Abstract A new and simple procedure for the determina-tion of parathion in human whole blood and urine using direct immersion (DI) solid-phase microextraction (SPME) and gas chromatography/mass spectrometry (GC/MS) is presented. This technique was developed using only 100μL of sample, and ethion was used as internal standard (IS). A 65-μm Carbowax/divinylbenzene (CW/DVB) SPME fibre was selected for sampling, and the main parameters affecting the SPME process such as extraction temperature, adsorption and desorption time, salt addition, agitation and pH effect were optimized to enhance the sensitivity of the method. This optimization was also performed to allow the qualitative determination of para-thion’s main metabolite, paraoxon, in blood. The limits of detection and quantitation for parathion were 3 and 10 ng/mL for urine and 25 and 50 ng/mL for blood, respectively. For paraoxon, the limit of detection was 50 ng/mL in blood. The method showed linearity between the LOQ and 50 μg/mL for both matrices, with correlation coefficients ranging from 0.9954 to 0.9999. Precision and accuracy were in conformity with the criteria normally accepted in bioanalytical method validation. The mean absolute recoveries were 35.1% for urine and 6.7% for blood. Other parameters such as dilution of sample and stability were also validated. Its simplicity and the fact that only 100μL of sample is required to accomplish the analysis
make this method useful in forensic toxicology laboratories to determine this compound in intoxications, and it can be considered an alternative to other methods normally used for the determination of this compound in biological media. Keywords Direct immersion solid-phase microextraction . Parathion . Whole blood . Urine
Introduction
Parathion [O,O-diethylO-(4-nitrophenyl)phosphorothioate] is an organophosphorous pesticide of very high mammalian toxicity [1], and was synthesized by Schrader in the 1940s [2]. It acts by the irreversible inhibition of cholinesterases, which are responsible for hydrolysing, and thereby deacti-vating, the neurotransmitter acetylcholine [3,4]. It may be absorbed through the skin, by inhalation and via the gastrointestinal tract. After absorption it is rapidly metab-olized to paraoxon, in which the sulfur atom is replaced by oxygen. Both compounds are rapidly hydrolysed by plasma and tissue esterases to produce diethylthiophosphoric acid (DETP), diethylphosphoric acid (DEP) and p-nitrophenol. These products are largely excreted in urine and account for the majority of a dose of parathion; however, the parent compound is also excreted in its unchanged form [5].
Intoxication symptoms are similar to those produced by other cholinesterase inhibitors and include respiratory difficulty, excessive salivation, miosis, nausea, vomiting, muscle weakness and paralysis [6]. Toxic levels in plasma are reported to be in the range of 0.01 to 0.08μg/mL [6].
Several methodologies have been developed for sample preparation prior to analysis of parathion in biological or environmental samples [7–10] and these usually involve time- and solvent-consuming techniques. Solid-phase microextraction (SPME), a rapid and simple sampling
DOI 10.1007/s00216-006-0735-4
E. Gallardo (*)
:
A. Cruz:
M. López-RivadullaInstituto de Medicina Legal, Servicio de Toxicología Forense, Universidad de Santiago de Compostela,
San Francisco s/n,
15782 Santiago de Compostela, Spain e-mail: [email protected] M. Barroso
:
C. Margalho:
D. N. Vieira Instituto Nacional de Medicina Legal, Delegação de Coimbra, Largo da Sé Nova, 3000-213 Coimbra, Portugaltechnique developed by Arthur and Pawliszyn in the early 1990s at the University of Waterloo (Ontario, Canada), can provide an alternative to those methods [11]. In fact, the sampling, extraction, concentration and sample introduction steps are combined into a single uninterrupted process, which results in high sample throughput [12]. SPME has been successfully applied for the determination of pesti-cides in environmental samples [13,14], food [15–17] and biological samples [18–23]. Only three papers [24–26] describe the determination of parathion in biological samples by means of SPME, using the headspace sampling technique. However, to the best of our knowledge, the use of the direct immersion approach to determine parathion in this kind of sample has not been published in the literature. This paper describes a new method based on direct immersion SPME combined with gas chromatography/mass spectrometry to determine parathion in blood and urine, using only 0.1 mL of sample.
Experimental Reagents
Analytical standards, parathion and paraoxon were pur-chased from Riedel-de Haën (Seelze, Germany), and ethion (internal standard, IS), an organophosphorous insecticide not commercially available in Portugal, was obtained from Polyscience Corp. (Niles, IL, USA). All pesticide standards were of 98–99% purity.
Methanol (HPLC grade), phosphoric acid, sodium hydrogenphosphate and sodium chloride (analytical grade) were obtained from Merck Co (Darmstadt, Germany).
Stock standard solutions at 1,000 μg/mL for each compound were prepared in methanol and stored at−20 °C in the dark. The analytes were stable under these conditions for at least 6 months. Subsequently working solutions at 100, 10 and 1 μg/mL for parathion and paraoxon, and at 100 μg/mL for ethion, were prepared by appropriate dilution of the stock solutions with methanol. These solutions were stored protected from light at 4 °C.
Phosphate buffer solutions (0.07 M) were prepared by mixing solutions of phosphoric acid and sodium hydro-genphosphate in variable proportions, according to the desired pH [27].
Biological samples
Fresh human blood was obtained from the excess supplies of the Portuguese Institute of Blood (outdated transfusions), preserved with citrate phosphate dextrose (1:7), and was stored at −20 °C until analysis. Urine specimens were
obtained from healthy supposed non-exposed subjects (laboratory personnel).
Instrumentation
The SPME device for manual extraction and the coated fibres, 100-μm polydimethylsiloxane (PDMS) and 65-μm Carbowax/divinylbenzene (CW/DVB), were purchased from Supelco (Bellefonte, PA, USA). Before the first use, new fibres were conditioned as recommended by the manufacturer by heating them in the injector port of the chromatographic system for 30 min, at 250 °C for PDMS and 220 °C for CW/DVB fibres.
Chromatographic analysis was performed using an HP 6890 gas chromatograph equipped with a model 5973 mass selective detector (Hewlett-Packard, Waldbronn, Germany). A capillary column (12 m×0.25-mm I.D., 0.25-μm film thickness) packed with 5% phenylmethylsiloxane (Ultra 2), supplied by J & W Scientific (Folsom, CA, USA), was used.
Chromatographic conditions were as follows: initial oven temperature was 100 °C for 2 min, which was increased by 10 °C/min to 200 °C, held for 1 min, and finally elevated by 24 °C/min to 270 °C, kept constant for 2 min. The temperatures of the injection port and detector were set to 240 and 280 °C, respectively. Splitless injection mode was adopted, and the carrier gas was helium at a constant flow rate of 1 mL/min. The mass spectrometer was operated with a filament current of 300μA and an electron energy of 70 eV in the electron impact (EI) mode. Quantitation was done in the selected ion monitoring (SIM) mode, and the ions were monitored at m/z 109, 139 and 186 for parathion, at m/z 109, 149, 275 for paraoxon, and at m/z 231, 153 and 125 for ethion: in each case the quantitation ion was at m/z 109.
The retention times were 11.10, 11.80 and 14.48 min for paraoxon, parathion and IS, respectively, obtaining a good separation of all compounds.
Extraction procedures Blood
For sample preparation, 10μL IS (100 μg/mL) was added to 100 μL blood. A final volume of 1 mL was obtained after appropriate dilution with deionised water. The sample was vortex-mixed for 30 s, and the CW/DVB-coated fibre was directly immersed in it for 60 min at 60 °C, without stirring. After extraction the fibre was retracted and washed by immersion in deionised water for 5 s, after which it was thermally desorbed in the injector port of the GC for 1 min at 240 °C.
Urine
The procedure adopted to extract urine samples was similar to that of the blood, except that the extraction temperature was 90 °C, and the washing step prior to desorption was omitted.
Results and discussion SPME optimization
Before the application of the extraction technique to the samples, several experiments with spiked blood and urine samples (1μg/mL) were carried out in order to select the optimum conditions for the extraction process. Each experiment was assayed thrice and individually for each selected pesticide, including IS, in each particular matrix. It should be stated that all the parameters related to paraoxon were only optimized for blood samples, because this metabolite is normally not detected in urine [5].
The optimized parameters were type of fibre coating, adsorption and desorption time, extraction temperature, agitation, salt addition and pH effect. Because SPME is an equilibrium process, rather than exhaustive [28], this systematic optimization of the experimental procedure was deemed necessary to achieve higher yields of the analytes and enhance method sensitivity.
The first parameter studied was the type of fibre coating. Two types of fibre coating were assayed: 100-μm PDMS and 65-μm CW/DVB. Peak areas obtained with each fibre were compared, and the CW/DVB fibre was chosen because it extracted 2 and 3 times the amount of parathion than the PDMS fibre in urine and blood, respectively.
In SPME the extraction involves the partitioning of the analytes between the matrix and fibre coating [29]. Therefore, the optimization of the contact time between these two phases is crucial to enhance method sensitivity.
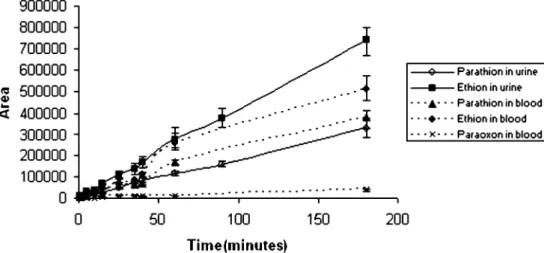
To find the best adsorption time, spiked blood and urine samples were extracted during several controlled times (1, 5, 10, 15, 25, 35, 40, 60, 90 and 180 min). After each extraction, the fibre was desorbed for 3 min at 240 °C in the injector port of the GC. The area counts were plotted against the extraction time (Fig. 1). We observed an increase in the extraction yield with the increase in the extraction time. Equilibrium was not reached by using these extraction times, and 180 min yielded the highest peak areas. However, the selected time for adsorption was not 180 min, as it would waste the aim of a rapid method; a good compromise between acceptable sensitivity and extraction time therefore had to be established. The selected adsorption time was 60 min for both matrices.
This is possible because SPME is an equilibrium process, as stated above. However, equilibrium is not a prerequisite for a quantitative method. In fact, the equilib-rium time is independent of the analyte concentration in the sample. On the other hand, the absolute amount of analyte extracted at a given time is linearly proportional to its concentration [30]. In this way, quantitation can be performed precisely and accurately, as long as the extrac-tion time is the same for calibrators and samples.
The optimization of desorption time aims at achieving the quantitative desorption of the analytes. On the other hand, and because a single coated fibre is designed to last for several extraction/desorption cycles, the possibility of carry-over of analytes is an important issue that must be excluded during method optimization. Several desorption times (1, 2, 3, 4 and 6 min) and two different injector temperatures (220 and 240 °C) were tested. On the basis of peak area evaluation, the best desorption conditions were found to be 1 min at 240 °C. The carry-over of analytes was excluded by analysis of blood and urine samples spiked with high amounts of the compounds (100 μg/mL). After the chromatographic run, the fibre was immediately sub-jected to the same desorption conditions. No peaks were
Fig. 1 Adsorption time profile for parathion, paraoxon and IS in blood and urine samples
observed after the second desorption, which excluded the carry-over of analytes.
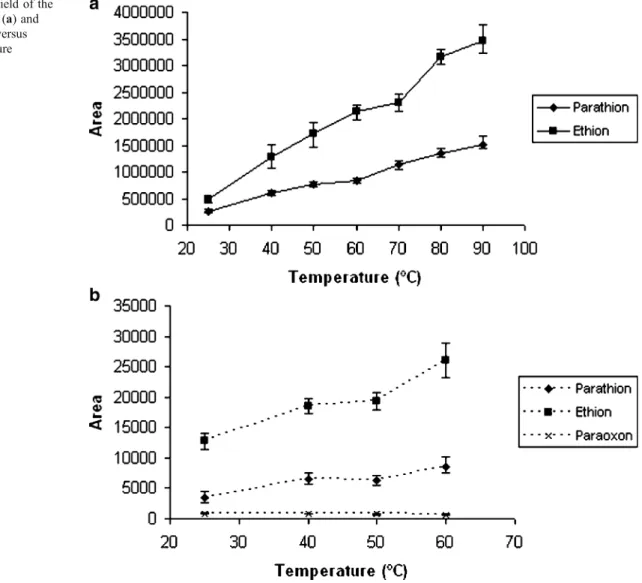
The temperature effect on the extraction yield was evaluated by varying the temperature between 25 °C and 60 °C for blood, and between 25 °C and 90 °C for urine samples. The extraction yield increased with the
tempera-ture (Fig. 2) in both matrices, and therefore the selected temperatures were 60 °C for blood and 90 °C for urine. A 60-min extraction of urine samples at 90 °C yielded 4 times more analyte than 180 min at room temperature.
Blood samples could not be heated above 60 °C, because of coagulation (we experienced coagulation of the samples
Fig. 3 Effect of salt addition on the extraction yield
Fig. 2 Extraction yield of the analytes from urine (a) and blood (b) samples versus extraction temperature
at 70 °C), and a 60-min extraction at this temperature yielded similar amounts of the analytes when compared to a 180-min extraction at room temperature.
In equilibrium, the temperature increase during extrac-tion negatively affects the extracextrac-tion recovery, because the
distribution constant between the sample and the fibre coating decreases. However, under non-equilibrium con-ditions, it is possible to improve sensitivity by increasing the temperature at which the extraction is performed [30]. This fact may explain our results, since the time selected for 11.60 11.70 11.80 11.90 12.00 12.10 12.20 12.30 12.40 38 39 40 41 42 43 44 Time--> Abundance Ion 109.00 (108.70 to 109.70): LIMIPQS2.D Ion 109.00 (108.70 to 109.70): SGBLANCO.D (*) 11.4011.5011.6011.7011.8011.9012.0012.1012.2012.3012.4012.5012.6012.70 40 45 50 55 60 65 70 75
Abundance Ion 109.00 (108.70 to 109.70): LODQ4.D
Ion 109.00 (108.70 to 109.70): BLANCO ORINA.D (*)
10.70 10.80 10.90 11.00 11.10 11.20 11.30 11.40 11.50 11.60 20 40 60 80 100 120 140 160 180 200 220 240 260 280 300 320 340 360 380 400 Abundance Ion 109.00 (108.70 to 109.70): CWDVB2 SANGRE.D Ion 109.00 (108.70 to 109.70): SGBLANCO.D (*) Paraoxon in blood Blank blood
b
Parathion in blood Blank blooda
Parathion in urine Blank urinec
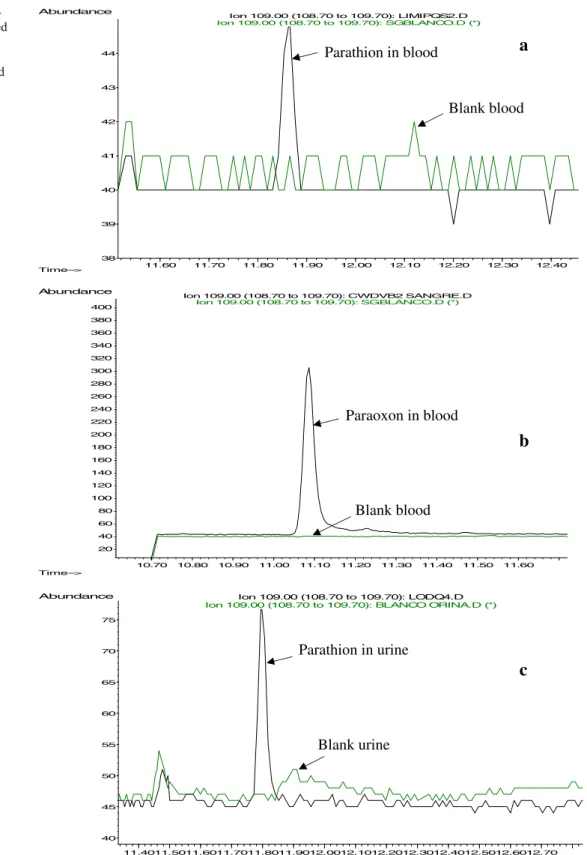
Time--> Time-->Fig. 4 Merged ion chromato-grams of blood samples spiked with parathion at 0.05μg/mL (a) and paraoxon at 1μg/mL (b), and a urine sample spiked with parathion at 0.01μg/mL (c), and from blank samples
extraction was shorter than the equilibrium time (as above mentioned, equilibrium was not reached even after 180 min).
To evaluate the influence of agitation on the extracted amount of parathion and paraoxon, blood and urine samples spiked at 1 μg/mL were analysed with and without agitation during the adsorption process, and peak areas were compared. Sample agitation did not significantly improve the extraction yield, and therefore it was decided not to agitate the samples during the extraction, as it would complicate the process.
The effect of pH on the extraction yield was evaluated by diluting blood and urine samples spiked with 1μg/mL of each pesticide in phosphate buffer 0.07 M (pH 5, 6, 7 and 8) instead of water. The peak areas obtained for each of the pH values were compared, and the highest peak areas were obtained at pH 8. However, the dilution of the sample with water yielded larger recovery of the analytes, which may have been due to an increase in salt concentration derived from the phosphate buffer. Therefore this study was carried out by diluting the sample with water.
Salt addition can improve the extraction yield as a result of a “salting out” effect. The effect of ionic strength on extraction efficiency was evaluated by analysing the amount of pesticides extracted in sample solutions containing 0, 0.375, 0.75, 1.5, 3, 5 and 10% sodium chloride.
Figure 3 illustrates the obtained results, and as can be seen the extracted amount diminished with the increase of salt concentration in the sample, which corroborates the results obtained in the pH experiments. Therefore this study was performed without salt addition.
Method validation
After optimization the methodology was validated accord-ing to internationally accepted criteria [31–33]. The studied parameters were selectivity, calibration curves, precision and accuracy, limits of detection and quantitation, recovery, dilution effect and stability.
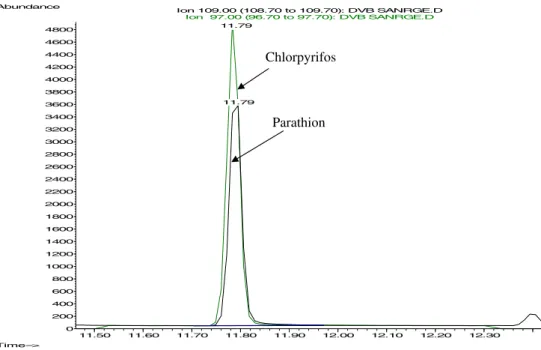
The selectivity of the method was evaluated by analysis of ten blank blood and urine samples of different origin. The obtained chromatograms were compared with those obtained from blood and urine samples spiked with parathion and paraoxon (Fig. 4). The peaks were well-separated and no interferences were observed. Furthermore, the interference of other substances that might eventually be present in the samples, such as other pesticides, was also evaluated, and could be excluded due to different retention times and/or mass spectra. For example, chlorpyrifos (an organophosphorous insecticide) has the same retention time of parathion. However, their mass spectra are different, and therefore it is possible to separate them, as can be seen in Fig. 5.
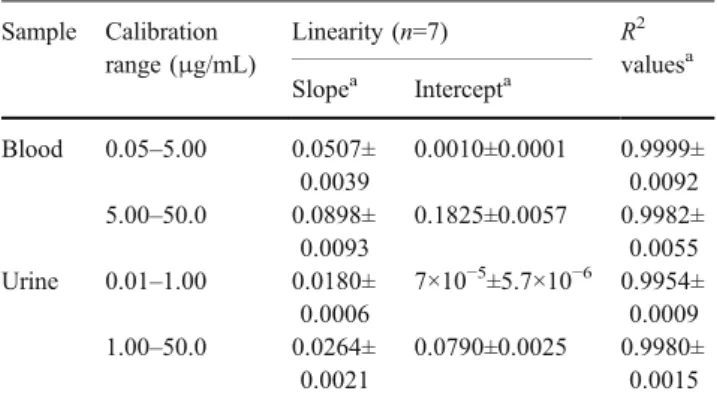
Linearity of the method for parathion was established on spiked blood and urine samples prepared and analysed using the described extraction procedures in the ranges of 0.05 to 50.00μg/mL and 0.01 to 50.00 μg/mL, respectively (ten calibrators each), each calibration level being analysed 6 times. The calibration curves were obtained by plotting the peak/area ratio between the analyte and ethion against analyte concentration. Calibration data is presented in Table 1. This parameter was only studied for parathion, since paraoxon was determined qualitatively.
The calibrators’ accuracy, i.e. mean relative error (bias) between measured and spiked concentrations, was
consid-11.50 11.60 11.70 11.80 11.90 12.00 12.10 12.20 12.30 0 200 400 600 800 1000 1200 1400 1600 1800 2000 2200 2400 2600 2800 3000 3200 3400 3600 3800 4000 4200 4400 4600 4800 Time--> Abundance Ion 109.00 (108.70 to 109.70): DVB SANRGE.D 11.79 Ion 97.00 (96.70 to 97.70): DVB SANRGE.D 11.79 Parathion Chlorpyrifos
Fig. 5 Merged ion chromato-grams of parathion (ion 109) and chlorpyrifos (ion 97)
ered adequate, being within ±15% of the nominal concen-tration for all concenconcen-tration levels, except for the lower limit of quantitation (LLOQ), for which 20% was consid-ered acceptable [31,32].
The limit of quantitation (LOQ) was defined as the lowest parathion concentration that could be measured with adequate precision (coefficient of variation of less than 20%) and accuracy (within ±20% of the nominal concentra-tion), and was found to be 10 ng/mL for urine and 50 ng/mL for blood. The limits of detection (LOD), defined as the lowest tested concentration yielding a signal-to-noise ratio higher than 3, were 25 and 3 ng/mL for parathion in blood and urine respectively, and 50 ng/mL for paraoxon in blood. LOD of paraoxon in urine was not determined because as stated above this metabolite is rapidly hydrolysed [5]. These limits were close to the published values for parathion determination in blood by means of SPME [24–26], and were obtained using a smaller sample volume (100 μL
versus 300 and 500μL). The determination of parathion in urine has not yet been published in the literature, so we cannot compare our results.
Intraday precision and accuracy were evaluated by analysing in the same day 6 replicates of blank urine samples spiked with parathion at LOQ, 0.25, 2.50, 10.0, 25.0 and 50.0 μg/mL for blood, and at LOQ, 0.05, 0.10, 0.50, 2.50, 10.0 and 50μg/mL for urine. Interday precision and accuracy were determined at the same concentration levels over a period of 5 months. The values of intra- and interday precision in both matrices were less than 13%, and the measured concentrations did not deviate more than 12% from the nominal concentration (Table 2).
Absolute recoveries of parathion were determined at 0.5, 5.0 and 25.0 μg/mL in urine and blood. For each concentration, 6 blank samples were spiked with parathion and analysed using the abovementioned procedures. The obtained peak areas were compared with those obtained from a splitless injection of 1 μL methanolic solutions containing the same amount of the analyte. The mean calculated values were 35.1% for urine and 6.7% for blood. These recovery values are higher than the published values for the determination of parathion in blood samples using SPME [24, 26]. We believe that the high temperature at which the extractions were performed contributed to the higher recoveries observed. However, these values are quite low when compared with the recovery values normally observed in other analytical methods (liquid–liquid extrac-tion or solid-phase extracextrac-tion). This is explained by the fact that SPME is an equilibrium process, rather than exhaus-tive. However, in this technique all the extracted amount of analyte is injected into the chromatographic system, unlike
Table 2 Precision, accuracy and recovery for the determination of parathion in blood and urine samples (n=6) Sample Concentration (μg/mL) Recovery (%) Concentration (μg/mL)
Intraday precision Interday precision Concentration mean (μg/mL) CVa (%) Biasb (%) Concentration mean (μg/mL) CVa (%) Biasb (%) Blood 0.50 6.7 0.05 0.05 6.23 8.15 0.05 9.24 −9.79 0.25 0.25 1.75 1.87 0.26 1.21 2.41 5.0 6.6 2.50 2.32 1.82 −7.27 2.42 5.67 −3.33 10.0 9.65 2.98 −3.50 9.08 4.69 −9.16 25.0 6.7 25.0 26.80 3.20 7.20 27.89 6.34 11.59 50.0 52.08 1.04 4.17 46.26 5.03 −7.47 Urine 0.50 45.6 0.01 0.01 5.79 −8.65 0.01 5.68 5.41 0.05 0.05 3.31 6.58 0.04 12.60 −9.36 0.10 0.09 3.35 −3.36 0.09 9.79 −8.20 5.0 37.6 0.50 0.50 4.65 −0.33 0.54 6.91 7.82 2.50 2.43 1.78 −6.21 2.43 2.96 −2.65 25.0 21.9 10.0 10.05 3.97 4.86 9.97 5.94 −0.28 50.0 51.91 6.02 3.82 47.92 6.60 −4.15 aCV coefficient of variation
bBias [(measured concentration−nominal concentration)/nominal concentration]×100
Table 1 Linearity data Sample Calibration range (μg/mL) Linearity (n=7) R2 valuesa Slopea Intercepta Blood 0.05–5.00 0.0507± 0.0039 0.0010±0.0001 0.9999± 0.0092 5.00–50.0 0.0898± 0.0093 0.1825±0.0057 0.9982± 0.0055 Urine 0.01–1.00 0.0180± 0.0006 7×10⁻⁵±5.7×10⁻⁶ 0.9954± 0.0009 1.00–50.0 0.0264± 0.0021 0.0790±0.0025 0.9980± 0.0015
other extraction techniques, in which the extracts must be evaporated and reconstituted in a solvent, from which only a small aliquot is injected into the system. On the other hand, SPME is a highly selective technique, and the obtained chromatograms are in general cleaner than those obtained with other extraction methods. In this way, it is possible to detect and quantitate small amounts of the compounds, in spite of the low recovery observed.
The validation of a partial sample volume was done by spiking blood and urine samples with concentrations above the higher level of calibration. Five replicates of each sample were analysed after appropriate dilution with blank matrix to the validated concentration range (dilution factors of 2, 4 and 10). The calculated concentrations of these diluted samples, after multiplication by their respective dilution factors, showed a precision of less than 10% for blood and 13% for urine samples.
In order to study stability in processed samples at two concentration levels, blood and urine were spiked with 0.25 and 10 μg/mL of parathion, and extracted using the abovementioned procedures (n=3). However, after extrac-tion the fibre was retracted, but it was not desorbed immediately in the GC injector. Instead, the fibre was left standing at room temperature for controlled time intervals (5, 10, 15, 20 and 30 min) before desorption. The measured concentrations for each tested time did not deviate more than 10% from the nominal concentration, and therefore the analyte is stable on the fibre coating for at least 30 min at room temperature.
Short-term stability was evaluated at the same concen-tration levels (n=3). Blood and urine were spiked and these samples were left at room temperature for 24 h. These samples were compared with samples prepared and ana-lysed in the same day, and the obtained values for precision were less than 4% for blood and 13% for urine samples.
Freeze and thaw stability was also evaluated in triplicate at two concentration levels. Blood and urine samples were spiked with 0.25 and 10 μg/mL of parathion, and these aliquots were stored at the intended storage temperature for 24 h, after which they were thawed unassisted at room temperature. When completely thawed, the samples were re-frozen for 12–24 h under the same conditions. This freeze/thaw cycle was repeated twice more, and the samples were analysed after the third cycle. These samples were compared to samples prepared and analysed in the same day, and the analytes were stable for at least 3 freeze/thaw cycles (the measured concentrations did not deviate more than 11% from the nominal concentration for both matrices).
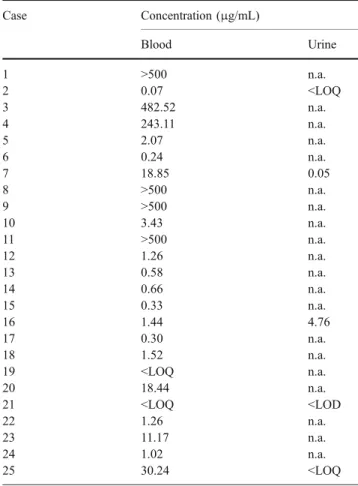
To demonstrate the applicability of this procedure, samples proceeding from 25 cases of acute intoxication were analysed and the obtained results are presented in Table3. The compound was identified by its retention time
and by the relative amounts of the selected ions. A typical chromatogram of a blood sample is shown in Fig.6.
Parathion is the second most detected pesticide in acute organophosphorous intoxications (mainly suicides) in Por-tugal, in spite of the fact that its commercialization has been prohibited since 1995, which indicates that people have stored it, particularly in rural areas. The high levels detected in some of the samples are consistent with the route of administration normally seen in these cases, in which people tend to ingest large amounts of the pesticide. On the other hand, there is the possibility of contamination during autopsy procedures, as well as post-mortem redis-tribution phenomena.
Concerning paraoxon, it was not detected in any of the analysed samples. We believe that the SPME method was not responsible for not detecting this compound, since it was optimized, and a low limit of detection was obtained. It is possible that this compound was not detected because of its lack of stability in the frozen samples, which was not studied. Furthermore, the conservation conditions of the samples between their collection at autopsy and the arrival at the laboratory are not known.
Table 3 Results obtained by applying the method to 25 real samples
Case Concentration (μg/mL) Blood Urine 1 >500 n.a. 2 0.07 <LOQ 3 482.52 n.a. 4 243.11 n.a. 5 2.07 n.a. 6 0.24 n.a. 7 18.85 0.05 8 >500 n.a. 9 >500 n.a. 10 3.43 n.a. 11 >500 n.a. 12 1.26 n.a. 13 0.58 n.a. 14 0.66 n.a. 15 0.33 n.a. 16 1.44 4.76 17 0.30 n.a. 18 1.52 n.a. 19 <LOQ n.a. 20 18.44 n.a. 21 <LOQ <LOD 22 1.26 n.a. 23 11.17 n.a. 24 1.02 n.a. 25 30.24 <LOQ
Concerning the urine samples, in most of the cases this sample was not available, since in most post-mortem situations the pathologist does not send urine samples for analysis. Therefore, only 5 urine samples could be analysed.
Conclusions
We have developed a simple and rapid method for the quantitation of parathion in blood and urine using DI-SPME. The procedure is sensitive and specific, presenting low limits of detection and quantitation, and moreover requires only 100 μL of sample. In this technique no organic solvent is required to accomplish the analysis, which is important from an environmental standpoint, since waste disposal is avoided. There is no need to evaporate and reconstitute the extracts, and therefore this methodol-ogy may be an alternative to the more time-consuming extraction methods, like liquid–liquid or solid-phase ex-traction, for the determination of this organophosphorous insecticide in biological media, both in clinical and forensic toxicology.
References
1. World Health Organization and Food and Agriculture Organiza-tion. Data sheets on pesticides. INCHEM [document online] [cited 26th Jun 2006]. Available from URL: http://www.inchem.org/ documents/pds/pds/pest6_e.htm
2. Tomlin CDS (ed) (1997) The pesticide manual, 11th edn. British Crop Protection Council, Surrey, p 926
3. Kała M (2004) Pesticides. In: Moffat AC, Osselton MD, Widdop B (eds) Clarke’s analysis of drugs and poisons, 3rd edn. Pharmaceutical Press, London, pp 202–226
4. Taylor P (1996) Anticholinesterase agents. In: Hardman JG, Limbird LE (eds) Goodman & Gilman’s the pharmacological
basis of therapeutics, 9th edn. McGraw Hill, New York, pp 161– 176
5. Baselt RC (2004) Disposition of toxic drugs and chemicals in man, 7th edn. Biomedical Publications, Foster City, p 846–848 6. Uges DRA. The International Association of Forensic
Toxicolo-gists (TIAFT): Therapeutic and toxic drug concentrations list. [document online] [cited 26th Jun 2006]. Available from URL: http://www.tiaft.org/tmembers/ttv/ttv_ps.html
7. Tewari SN, Ram L (1970) Mikrochim Acta 58–60
8. Ferrer C, Gómez MJ, Garcia-Reyes JF, Ferrer I, Thurman EM, Fernández-Alba AR (2005) J Chromatogr A 1069:183–194 9. Padrin-Sanz C, Halko R, Sosa-Ferrera Z, Santana-Rodriguez JJ
(2005) J Chromatogr A 1078:13–21
10. Abbas R, Hayton WL (1996) J Anal Toxicol 20:151–154 11. Arthur CL, Pawliszyn J (1990) Anal Chem 62:2145–2148 12. Beltrán J, López FJ, Hernández F (2000) J Chromatogr A
885:389–404
13. Lambropoulou DA, Sakkas VA, Albanis TA (2002) Anal Bional Chem 374:932–941
14. Sng MT, Lee FK, Lakso HÅ (1997) J Chromatogr A 759:225–230 15. Gonzalez-Rodriguez MJ, Arrebola Liebanas FJ, Garrido Frenich A, Martinez Vidal JL, Sanchez-Lopez FJ (2005) Anal Bional Chem 382:164–172
16. Beltrán J, Peruga A, Pitchard E, López FJ, Hernández F (2003) Anal Bional Chem 376:502–511
17. Fernández M, Padrón C, Marconi L, Ghini S, Colombo R, Sabatini AG, Girotti S (2001) J Chromatogr A 922:257–265 18. Gallardo E, Barroso M, Margalho C, Cruz A, Vieira DN,
López-Rivadulla M (2006) Rapid Commun Mass Spectrom 20:865–869 19. Gallardo E, Barroso M, Margalho C, Cruz A, Vieira DN,
López-Rivadulla M (2006) J Chromatogr B 832:162–168
20. López FJ, Pitarch E, Egea S, Beltrán J, Hernández F (2001) Anal Chim Acta 433:217–226
21. Namera A, Yashiki M, Nagasawa N, Iwasaki Y, Kojima T (1997) Forensic Sci Int 88:125–131
22. Tsoukali H, Raikos N, Theodoridis G, Psaroulis D (2004) Forensic Sci Int 143:127–132
23. Hernández F, Pitchard E, Beltrán J, López FJ (2002) J Chromatogr B 769:65–77
24. Tsoukali H, Theodoridis G, Raikos N, Grigoratou I (2005) J Chromatogr B 822:194–200
25. Musshoff F, Junker H, Madea B (1999) Clin Chem Lab Med 37:639–642
26. Musshoff F, Junker H, Madea B (2002) J Chromatogr Sci 40:29–34
27. Dien K, Lentner C (1975) Tablas científicas. Ciba Geigy, Basel Fig. 6 Chromatogram from a
real blood sample (case 7: 18.85μg/mL)
28. Pawliszyn J (1997) Solid phase microextraction. Wiley-VCH, New York
29. Barroso M, Gallardo E, Margalho C, Ávila S, Marques EP, Vieira DN, López-Rivadulla M (2005) J Chromatogr B 816:29–34 30. Ulrich S (2001) J Chromatogr A 902:167–194
31. Food and Drug Administration: US Department of Health and Human Services, guidance for industry, bioanalytical method
validation. FDA [document online] [cited 26th Jun 2006]. Available from URL:http://www.fda.gov/cder/guidance/4252fnl.pdf 32. International conference on harmonization (ICH), validation of
analytical procedures: methodology ICH Q2 B. ICH [document online] [cited 26th Jun 2006]. Available from URL:http://www. ich.org/MediaServer.jser?@_ID=4188@_MODE=GLB