BJRS
RADIATION SCIENCES
07-02B (2019) 01-15ISSN: 2319-0612 Accepted: 2019-04-22
Investigation of polymer-based BaO and rGO nanocomposites
for application in low energy X-ray attenuation
L. A. Silva
a; A. S. M. Batista
b, J. P. Nascimento
c, C. A. Furtado
c; L. O. Faria
caDepartamento de Engenharia Nuclear – UFMG/Av. Antônio Carlos, 6627, 31.270 – 970 Belo Horizonte, MG bDepartamento de Anatomia e Imagem – UFMG/Av. Alfredo Balena, 190, 30.130 – 100 Belo Horizonte, MG cCentro de Desenvolvimento da Tecnologia Nuclear/ Av. Antonio Carlos 6627, 31.270-901 Belo Horizonte, MG
ABSTRACT
Polymeric materials can serve as a matrix for the dispersion of nanomaterials with good attenuation features, resulting in lightweight, conformable, flexible, lead-free and easy-to-process materials. Thus, some well-known radiation shielding materials could be used in low proportion as a filler, for the formation of new materials. On the other hand, nanostructured carbon materials, such as graphene oxide (GO) have been reported recently to show enhanced attenua-tion properties. For the present work, poly(vinylidene fluoride) [PVDF] homopolymers and its fluorinated copolymers were filled with metallic oxides and nanosized reduced graphene oxides (rGO) in order to produce nanocomposites with increased low energy X-ray attenuation efficiency. This work aims to investigate the X-ray shielding features of multilayered PVDF/rGO and P(VDF-TrFE)/BaO composites. PVDF/rGO overlapped with P(VDF-TrFE)/BaO thin films were sandwiched between two layers of kapton films of different thickness. The linear attenuation coefficients were measured for monochromatic X-ray photons with energy of 8.1 keV. The samples were characterized by Scan-ning Electron Microscopy (SEM), Energy Dispersive Spectroscopy (EDS), Ultraviolet–visible (UV-vis) and Fourier-Transform Infrared (FTIR) Spectroscopy. The linear attenuation coefficient of the multilayered sample was evaluated and compared with the linear attenuation of the individual constituents. It was observed an increase in the attenuation coefficient of the overlapping samples. It is demonstrated that thin films of rGO nanocomposite with thickness of only 0.32 mm can attenuate up to 50% of X-ray beams with energy of 8.1 keV, justifying further investigation of these nanocomposites as X-ray or gamma radiation attenuators.
1. INTRODUCTION
The poly(vinylidene fluoride) [PVDF] homopolymer has a semi-crystalline structure. Each chain is formed by the repetition of (-CH2-CF2-)n monomers. In one of its possible five crystalline phases,
the beta-phase, it presents significant ferroelectricity compared to other ferroelectric polymers, which provide technological applications as transducers, actuators and artificial muscles [1]. On the other hand, the PVDF ferroelectric properties are also observed in one of its fluorinated copolymers, the P(VDF-TrFe) copolymer, for TrFE contents ranging from 18% to 63%. It undergoes a structural phase transition ferro-to-paraelectric phase at temperatures ranging from 52 °C to 80°C, respective-ly. The great difference in the degree of crystallinity observed in both PVDF and P(VDF-TrFe) is attributed to the different processes of obtaining samples [2].
One of the promising future applications of polymer-based nanocomposites is in the field of X-ray
attenuation, such as interventional radiology procedures and aerospace industry. Polymeric com-pounds filled with metal oxides and reinforced with graphitic materials have presented promising results regarding shielding and attenuation for both cosmic and X-ray radiations. [3], [4], [5] In this context, an enhanced X-ray absorption effect of CNTs was reported by Fujimore et al. (2011) [5], when compared with highly oriented pyrolytic graphite (HOPG). They have demonstrated that CNT-coated fabrics could efficiently absorb 17.5 keV X-ray photons by using polyester fibers filled with 2.5 wt% of ZrO2 and coated with 8.0 wt% of multiwalled carbon nanotubes (MWCNTs). On
the other hand, the main graphitic material that has attracted both academic and industrial interest is graphene because it can produce significant improvement in nanocomposite properties, at very low filler contents. We remark that CNTs can be thought of as a graphene sheet (a hexagonal lattice of carbon) rolled into a cylinder. Thus, it is believed that graphene sheets should also present enhanced X-ray attenuation features like CNTs. In fact, recently, Viegas et al. (2017) [6] reported an en-hanced X-ray attenuation efficiency for PVDF/GO nanocomposites when filled with only 1.88 wt% of graphene oxide nanosheets. The mass attenuation coefficient was found to be four times higher than that encountered for nanocomposites made of PVDF filled with 1.88 wt % of other graphitic materials. Graphene Oxide, which is chemically similar to graphene, is formed by hexagonal lattice, two-dimensional carbon monolayer in atomic-scale, and can be functionalized with epoxy, hydrox-yl, carboxylic and carbonyl groups. It is generally prepared by the oxidation of graphite flakes, giv-ing OG characteristics of hydrophilicity, better dispersion features and compatibility with various
polymer matrices. Reduced graphene oxide (rOG) has a lower amount of oxygen groups on the gra-phene surface, making it structurally more similar to gragra-phene. The main routes of obtaining the reduced graphene oxide (rGO) frequently reported are the thermal and chemical reductions [7]. The attenuating characteristics presented by graphene and its oxides such as absorption of electromag-netic radiation (white light) [8], shielding in the microwave region [9] and improvement of compo-site properties with low fill percentage (< 2% filler) make graphene oxide and reduced graphene oxide excellent candidates for diverse applications as well as the graphene itself. [10-13].
The addition of nucleating agents in non-polar alpha phase of PVDF, such as graphitic materials (carbon nanotubes, graphene, graphene oxide and reduced graphene oxide) or metal oxides with attenuation features (barium oxide, bismuth, lead oxide) [14-15] can induce the formation of the ferroelectric beta phase. A common way to produce PVDF-based composites is to solve PVDF pel-lets in a solvent. After dissolution, graphitic or metal oxides materials, also dispersed into a solvent, is added to the solution [13,16].
In this work, we have used a metallic oxide with excellent attenuation efficiency for low energy X-ray: the barium oxide. According to the values provided by National Institute of Standards and Technology (NIST, 2017) [17], it has the highest mass attenuation coefficient for X-ray energies around 8.1 keV when compared to other metallic-based attenuators such as Pb, Bi and W. On the other hand, it is well known that polymer composites reinforced with graphitic materials have also presented extremely satisfactory results for radiation shielding and attenuation in both cosmic and high-energy X-ray radiation (100 keV to 1.16 MeV) [18], [19]. The properties of PVDF−graphene nanocomposites have been also explored for applications in several specific fields [20-23]. In order to perform this investigation, PVDF/rGO nanocomposites, filled with 1.9, 4.0, 6.0 and 8.0 % of rGO, overlapped with P(VDF-TrFE)/BaO thin films were sandwiched between two layers of kap-ton® films. The kapton layers were used just to provide structural stiffness for the proof samples. The linear attenuation coefficients of the multilayered samples were evaluated and compared to the linear attenuation of the individual constituents, for monochromatic 8.1 keV X-ray photons.
2. MATERIALS AND METHODS
The dispersion of rGO occurred in aqueous medium (pH 12, 0.8 mg/mL) by sonication in a Sonics Vibracell VCX 500, with 750 W − 20 kHz, for 30 min. The PVDF/rGO nanocomposite films were prepared dissolving (0,03g/mL) of PVDF, with molecular weight of 180.000 Mw, in a solvent formed by n,n-dimethylacetamide (DMAC) and 1 wt % of acetic anhydride at 60 °C. The PVDF were sup-plied by Sigma Aldrich. The rGO was also supsup-plied by Aldrich with Product Number: 777684. After dissolution of PVDF, dispersed rGO was added to the solution in proportions of 1.9%, 4%, 6% and 8% relative to the weight of PVDF. After solvent evaporation, PVDF/rGO films of c.a. 25 μm thick and cut with area of 9.63 cm2 were produced.
P(VDF-TrFe)/BaO composites were prepared by dissolving small quantities of P(VDF-TrFE) using the same methodology used to dissolve PVDF. After dissolution, 8% of BaO was added to the solu-tion. After solvent evaporation, P(VDF/TrFE)/BaO films of c.a. 64 μm were produced.
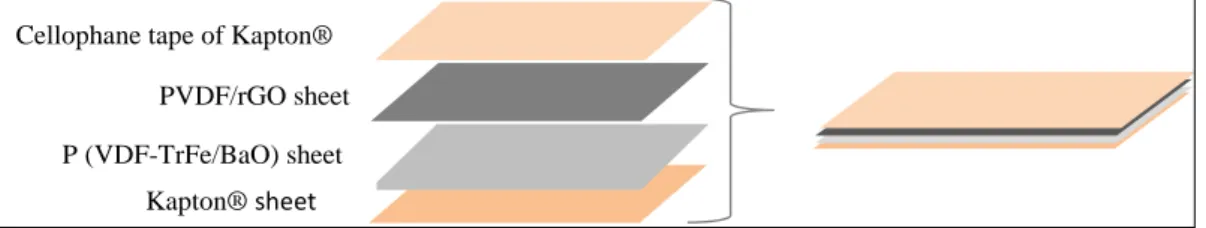
Figure 1: Scheme of the arrangement of the layers for final nanocomposites
For radiation shielding characterization, PVDF/rGO nanocomposites filled with 1.9, 4.0, 6.0 and 8.0% of rGO, overlapped with P(VDF-TrFE)/BaO thin films, were sandwiched between two layers of kapton® films, following the scheme shown in Figure 1. The multilayered samples were exposed to an incident monochromatic X-ray beam from the Rigaku diffractometer. In order to generate a monochromatic incident X-ray beam, a monochromatic X-ray was first directed to a single crystal of Si (111). The constructive diffraction from Kα lines of Cu (E = 8.1 keV) X-ray beams was
ob-tained at 2θ approximately equal to 26.60°. The samples were individually positioned in the path of the radiation beam, near the detector.
The attenuation analysis of each sample was performed following the well-known Beer-Lambert law
I = I0 . e
-μx (1)Cellophane tape of Kapton®
P (VDF-TrFe/BaO) sheet PVDF/rGO sheet
where I0 and I are the X-ray intensities of the incident and transmitted beams, x is the sample
thick-ness (in cm) and μ is the linear attenuation coefficient (in cm-1). The percentual attenuation of an X-rays beam is expressed as
At% = (1- I/I0) x 100
(2)The nanocomposite characterization was performed by Fourier-Transform Infrared (FTIR) and Ul-traviolet–visible (UV−Vis) Spectroscopy techniques and also by Scanning Electron Microsco-py (SEM). The FTIR spectra were collected by a Bomem 100 spectrometer in the transmission mode by directly exposing the films to the FTIR beam, for wavenumbers ranging from 200 to 4000 cm−1. The beam was always focused in the center of each film sample. UV−Vis spectra were taken in a Shimadzu UV- 2401 PC spectrometer, for wavelengths ranging from 190 to 900 nm. SEM micrographs were taken in a Sigma VP field emission scanning electron microscope (Zeiss).
3. RESULTS AND DISCUSSION
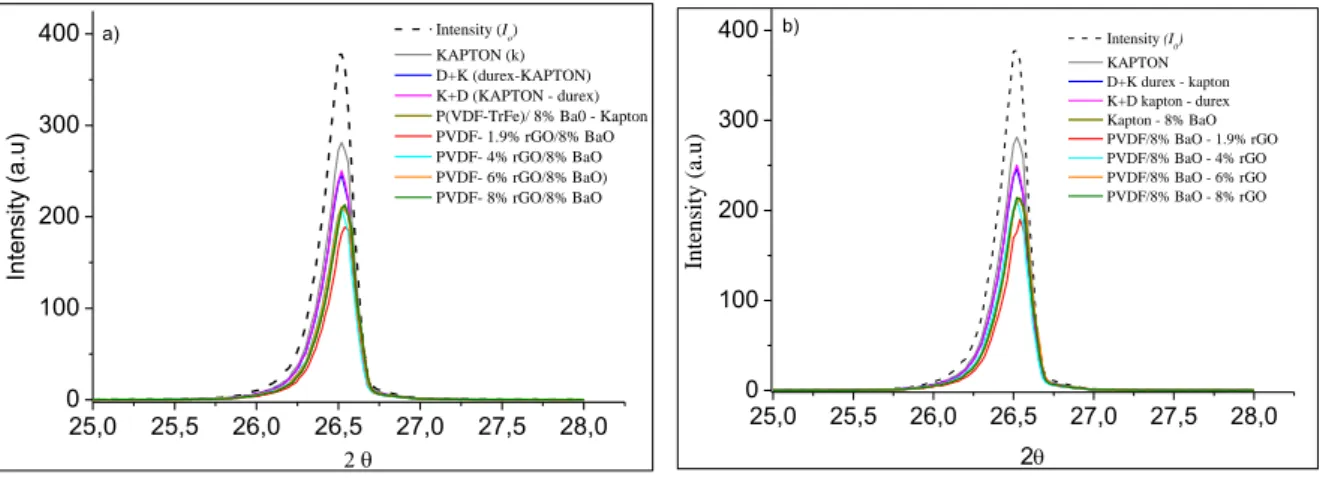
We started the shielding characterization of the multilayered nanocomposites made of PVDF/rGO and P(VDF-TrFE)/BaO remarking that they may have different linear attenuation coefficients when irradiated with monoenergetic photons of the same energy, once they have different polymeric ma-trix and fillers. Also, the behavior of the linear attenuation coefficients as a function of the photon energy with energies ranging from 0.001 keV to 20 MeV may be different. This is due to the nature of the interaction of electromagnetic radiation with matter, which involves photoelectric absorption, coherent scattering, incoherent scattering and par production effects. Thus, for a given monoener-getic photon, the total attenuation of the multilayered samples produced in this work will depend on which nanocomposite the X-ray radiation first interacts. In order to observe this influence, we have irradiated each multilayered sample with the X-ray beam directed first to one side and, subsequent-ly, to the opposite side. The results are presented in Figure 2 that shows the counting spectra meas-ured by the Diffractometer detector at 2θ approximately equal to 26.60°. In Figure 2(a), the X-ray beam first crosses the PVDF/rGO nanocomposite and in Figure 2(b) it crosses first the P(VDF-TrFE)/BaO composite.
Figure 2: The X-ray spectra taken for each component of the multilayered sample and also to
PVDF/rGO nanocomposites. The X-ray beam intensity measured without any sample corresponds to I0 in equation (1). The X-ray beam is directed to a) the layer x%rGO – BaO and b) the layer
BaO - x%rGO.
As it can be seen, the spectra are quite similar, meaning that the above mentioned effect can be ne-glected at this energy, i.e. 8.1 keV. In this Figure, the X-ray beam intensity measured without any sample corresponds to I0 in equation (1). The other spectra were taken for each component of the
multilayered sample and also to PVDF/rGO nanocomposites with 1.9, 4, 6 and 8% of rGO. The peak heights reveal little difference between I0 and I (transmitted beam), for all samples. The
multi-layered sample with P(VDF-TrFE)/BaO and PVDF/rGO with 1.9% of rGO presented the larger radiation attenuation among the multilayered samples.
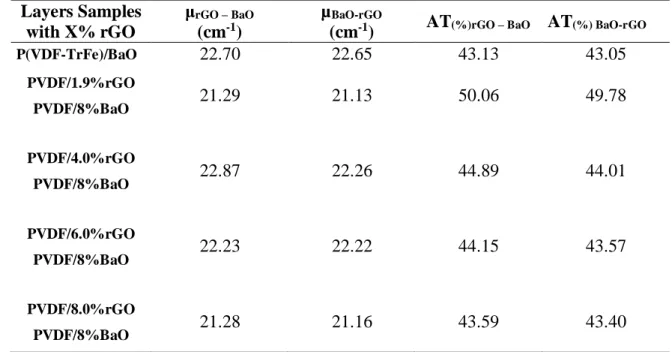
By using the equation (1) it is possible to calculate the attenuation percentages and also their respec-tive linear attenuation coefficients (µ) for both sides of incidence of the X-ray beam. These data are shown in Table 1. Comparing the attenuation features for both directions of the X-ray beam, we see again that there is practically no differences. The X-ray attenuation obtained by the sample with P(VDF-TrFE)/BaO and PVDF/rGO with 1.9% of rGO is around 50%. For this sample, the total thickness, including the Kapton films, is 0.0326 cm. This is then the effective half value layer (HVL) for the multilayered sample. The corresponding linear attenuation coefficient is 21.29 cm-1. For comparison purposes, the HVL for aluminum at this same energy is 0.0051 cm. It is also inter-esting to observe, in Table 1, the improvement around 7% in the X-ray attenuation provoked by the addition of the PVDF/1.9% rGO nanocomposite, which is only 26 μm thick, in the multilayered sample. 25,0 25,5 26,0 26,5 27,0 27,5 28,0 0 100 200 300 400 Inte ns ity ( a.u) Intensity (Io) KAPTON (k) D+K (durex-KAPTON) K+D (KAPTON - durex) P(VDF-TrFe)/ 8% Ba0 - Kapton PVDF- 1.9% rGO/8% BaO PVDF- 4% rGO/8% BaO PVDF- 6% rGO/8% BaO) PVDF- 8% rGO/8% BaO a) 25,0 25,5 26,0 26,5 27,0 27,5 28,0 0 100 200 300 400 In te n sit y ( a.u ) 2 Intensity (I 0) KAPTON D+K durex - kapton K+D kapton - durex Kapton - 8% BaO PVDF/8% BaO - 1.9% rGO PVDF/8% BaO - 4% rGO PVDF/8% BaO - 6% rGO PVDF/8% BaO - 8% rGO b)
Table 1: Attenuation percentages and their respective linear attenuation coefficients (µ) derived
from Fig.2 by using equation (1).
Layers Samples with X% rGO
μrGO – BaO
(cm-1)
µBaO-rGO
(cm-1) AT(%)rGO – BaO AT(%) BaO-rGO
P(VDF-TrFe)/BaO 22.70 22.65 43.13 43.05 PVDF/1.9%rGO PVDF/8%BaO 21.29 21.13 50.06 49.78 PVDF/4.0%rGO PVDF/8%BaO 22.87 22.26 44.89 44.01 PVDF/6.0%rGO PVDF/8%BaO 22.23 22.22 44.15 43.57 PVDF/8.0%rGO PVDF/8%BaO 21.28 21.16 43.59 43.40
Figure 3 shows the mass attenuation coefficients as a function of photon energy for BaO, rGO and PVDF, obtained by using the NIST database simulation. We can notice that the metal oxides pre-sent the same attenuation coefficient in the X-ray region between 5.0 and 10.0 keV (panel a); in the energy range around 8.9 keV, the PVDF matrix presents higher attenuation coefficient that poten-tializes the attenuation properties of the nanocomposite reinforced with rGO (panels b and c). Figure 3: Attenuation coefficient provided by the NIST database: a) BaO, b)rGO c) PVDF
Figure 4 displays the FTIR spectra of all nanocomposite samples, for wavenumbers ranging from 250 to 900 cm-1 (a) and for wavenumbers ranging from 1400 to 1900 cm−1, just for PVDF/rGO nanocomposites (b). The absorption bands shown in Figure 4(a) are very important because they allow us to check the crystallographic phase of the PVDF homopolymer matrix. There are seven vibrational modes between 552 and 813 cm−1 that are active in the α and/or γ phases but are not
active in the β-PVDF. [6] Most of these vibrational modes are bending (δ-mode) or rocking (r-mode) of CF2 and CH2 molecules. In Figure 4(a) we see that these absorbance peaks are not present
in this spectral range, for all spectra for PVDF/rGO nanocomposites,. This result means that all PVDF/rGO nanocomposite samples are mostly in the β-ferroelectric phase of PVDF. We remark that the β-ferroelectric phase is the one with many technological applications, as for instance in sen-sors and transducers and that this phenomenon was also seen by Viegas et al. (2017) [6], in PVDF/GO nanocomposites filled with 1.9% of graphene oxide nanosheets. In Figure 4(b), the main information revealed is concerned to the increasing absorption intensities at 1587 cm-1, for
increas-ing amounts of reduced graphene oxide in the nanocomposites. This wide peak is well known to be originated by the stretching vibration of C=O bonds. It is a clear indication of the presence of rGO nanosheets in the nanocomposites. The absorbance intensities at 1587 cm-1are 0.277, 0.420, 0.450
and 0.647, for nanocomposites filled with 1.9, 4.0, 6.0 and 8.0 % of rGO, respectively. It is very important to remark that this vibrational mode is reported in literature to be also active in Raman shift spectra at 1587 cm-1, being attributed to the G band of graphene oxide [24]. Back to Fig. 4(b), the absorption intensities observed for nanocomposites filled with 4.0% and 6.0 % of rGO are very close, i.e., 0.42 and 0.45, when compared to the other nanocomposites..
Figure 4: FTIR spectra for P(VDF-TrFe)/BaO and PVDF/x% rGO (x=1.9, 4, 6 and 8
nanocompo-sites), for wavenumbers ranging from 900 to 300 cm−1 (a) and for wavenumbers ranging from 1400 to 1900 cm−1, just for PVDF/rGO nanocomposites (b).
Figure 5 displays the UV-Vis spectra for P(VDF-TrFE)/BaO composites and PVDF/rGO nanocom-posites filled with 1.9, 4, 6 and 8% of rGO. The huge absorption band seen at 270 nm in the P(VDF-TrFE)/BaO spectrum is characteristic of BaO. In the PVDF/rGO filled with 8% of rGO spectrum is possible to see a large band absorption at 270 nm.
900 800 700 600 500 400 300 0,0 0,5 1,0 1,5 2,0 2,5 3,0 Ab so rb a n ce (a .u ) Wavenumber (cm-1 ) P(VDF-TrFe)/8aO PVDF/188% rGO PVDF/4% rGO PVDF/6% rGO PVDF/8% rGO a)
Figure 5: UV-Vis spectra for P(VDF-TrFe)/BaO and PVDF/x% rGO (x=1.9, 4, 6 and 8) for
wave-length ranging from 190 to 900 nm.
This band is characteristic of the π – π* transition of reduced graphene oxide. However, these bands are less intense and very closed in the spectra of the nanocomposites filled with 4.0% and 6.0% of rGO. We think that this result indicates problems with the dispersion of rGO in the PVDF matrix, leading to a poor reproducibility in the production of the nanocomposites. We remark that closed values of absorbance intensities at 1587 cm-1, which are attributed to C=O vibrational stretching, are also observed in the FTIR spectra of the nanocomposites filled with 4.0% and 6.0% of rGO Fig. 4 (b). Thus, we see that the UV-Vis and FTIR data, with respect to the amount of rGO aggregated in these compositions, are in agreement.
SEM micrographs analysis were performed in PVDF nanocomposites filled with 1.9, 4, 6 and 8% of rGO. Figure 6 shows that amount of rGO in the PVDF matrix has fundamental influence in the formation of larger crystalline structures, modifying the mechanism of the crystalline component and the crystallization spherulite kinetics.
Figure 6: Micrographs of pure and non-irradiated PVDF in a 2 μm scale: a)
P(VDF-TrFe)-8%BaO, b) PVDF- 1.9% rGO c) b) PVDF- 4%rGO d) PVDF- 6%rGO e) PVDF- 8%rGO.
In the Figure 6, it is possible to observe spherical aggregates of lamellar crystallites, at least for nanocomposites filled with 4.0, 6.0 and 8.0% of rGO. These big crystalline structures are
character-200 300 400 500 600 700 800 0 1 2 3 4 Ab so rb a n ce (a .u ) Wavelength (nm) P(VDF-TrFe)-8% BaO PVDF- 1.9% rGO PVDF- 4% rGO PVDF- 6% rGO PVDF- 8% rGO
istic of PVDF crystalline homopolymers. This behavior has also been reported by VIEGAS [6] and GAHLOT [25].
In fact, in Figure 7, which displays the SEM-EDS Micrograph PVDF/rGO nanocomposite filled with 4.0% of rGO. In this EDS micrograph, the Oxygen atoms are identified with green color while Fluorine atoms appears in blue color. The smaller green structures among the spherulites are identi-fied as the rGO structures. It is possible to see that the rGO nanosheet agglomerates are accommo-dated on the surface of PVDF spherulites or on the amorphous ligation between two adjacent crys-talline spherulites.
Figura 7: SEM-EDS Micrograph of PVDF/rGO nanocomposite filled with 4.0% of rGO. The
oxy-gen atoms are identified with green color while Fluorine atoms appears in blue color. The spheri-cal structures are attributed to the PVDF spherulitic aggregates of lamellar crystallites. The small-er green structures among the sphsmall-erulites are identified as the rGO structures.
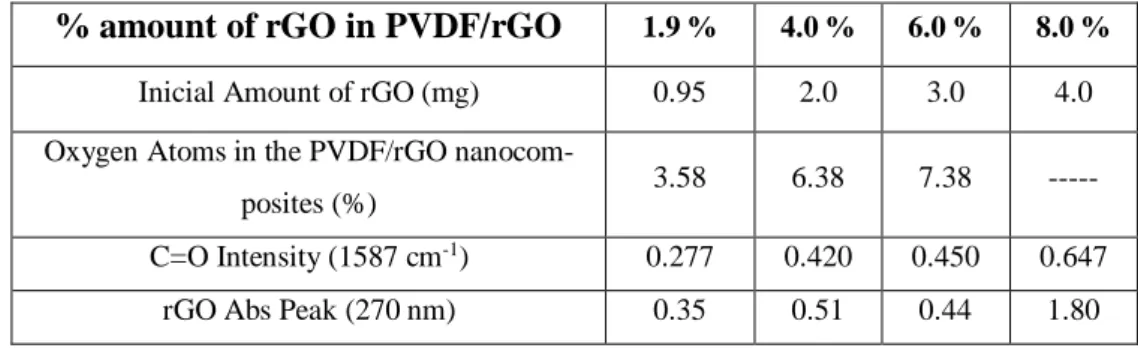
The MEV-EDS micrograph allows the evaluation of amount of atoms of chemical elements present in the examined area. In Figure 7 we evaluated the amount of oxygen and fluorine elements, in or-der to allow us an estimation of the real amount of rGO material that is aggregated to the nanocom-posite. Once the reduced graphene oxide is made by exfoliating the bulk graphite oxide, its nanosheets are linked to C=O and OH bonds. Typically, each nanosheet has 30% of oxygen atoms and 70% of carbon atoms. Thus, the amount of Oxygen atoms evaluated by EDS probe should give us a good estimation. In table 2, we present the percentual amount of Oxygen, related to the sum of Fluorine, Carbon and Oxygen, for the nanocomposites filled with 1.9, 4.0, 6.0 and 8.0%. In this Table, for comparison purposes, we also show the initial amount of rGO (in mg), the intensities of C=O absorption peaks at 1587 cm-1, obtained from FTIR data from Figure 4(b), and UV-Vis ab-sorption intensities (Figure 5). The initial amount of PVDF homopolymer, for all composites, was 50 mg. We see that the amount of Oxygen atoms present in the micrograph area of Figure 7, starting with 3.58% for nanocomposites with 1.9 of rGO, has a huge increase to 6.38% for the sample with
4.0% of rGO. A similar behavior is seen for the equivalent FTIR data, which increases from 0.277 to 0.420, and UV-Vis, which increases from 0.35 to 0.51. It means that there is an increase of 1.78 times for the percentual amount of oxygen, an increase of 1.51 times for the absorption intensities of the peak related to C=O bonds, and an increase of 1.45 times for the peak associated to rGO in the UV-Vis spectrum. When the amount of rGO is increased to 6.0%, these ratios are quite lower, i.e. 1.15 (Oxygen) against 1.05 (FTIR). Obviously, these two techniques led us to think that there is a lower amount of rGO aggregated to the sample filled with 6.0% of rGO. Interestingly, the UV-Vis data from Figure 5 reveals a similar behavior, because the absorbance intensity for the sample with 6.0% (i.e. 0.44) is even lower than that for sample with 4.0% of rGO (i.e. 0.51). For the nanocom-posite with 8.0% of rGO, all techniques, except for the EDS where the measurement was lost, point out to an important increase, i.e. from 0.450 to 0.647 (FTIR) and from 0.44 to 1.80 (UV-Vis). We then conclude that the real amount of rGO structures aggregated to the PVDF matrix seems to be not uniform when compared to the initial amount of rGO used in the sample preparation. It con-firms that there are problems with the dispersion of rGO in the PVDF matrix.
Table 2 – Comparison between the initial amount of rGO in the PVDF/rGO nanocomposites and
the percentual amount of Oxygen atoms measured by the EDS probe (green points in Figure 7). For comparison purposes, the infrared absorption intensities at 1587 cm-1 (Figure 4(b)) and UV-Vis absorption intensities (Figure 5) are also shown.
Finally, we may discuss about the larger X-ray attenuation of the multilayered sample with PVDF/1.9% rGO (AT = 50%) when compared to the samples filled with 4, 6 and 8 % of rGO (AT=44%). We think that this unexpected result is linked to the dispersion of graphene sheets into the PVDF matrix. We note that, Viegas et al. (2017) [6] reported investigated the X-ray attenuation features for PVDF/rGO filled with 0.5, 1.0 and 1.88% of rGO. Among these three nanocomposites, only the one with 1.88% of rGO showed good attenuation features for photons with energy bellow
% amount of rGO in PVDF/rGO 1.9 % 4.0 % 6.0 % 8.0 %
Inicial Amount of rGO (mg) 0.95 2.0 3.0 4.0 Oxygen Atoms in the PVDF/rGO
nanocom-posites (%) 3.58 6.38 7.38 --- C=O Intensity (1587 cm-1) 0.277 0.420 0.450 0.647
22.1 keV. They attributed this behavior to the interaction of the graphene sheets with the crystalline structure of the PVDF chains. In the nanocomposites with 0.5% and 1.0%, they observed formation of crystalline spherulites in the SEM images. In the sample with 1.9% of rGO, there was no for-mation of spherulites. In our PVDF/rGO nanocomposites, we clearly see the forfor-mation of spheru-lites in the samples with 6% and 8% of rGO. Unfortunately, the SEM image for the sample with 1.9% is not sufficiently clear to determine if there are spherulites or not. However, it is quite differ-ent for others. Thus, we think that this question will remain open for future investigation.
4. CONCLUSION
The objective of this work is to investigate the X-ray shielding features of multilayered PVDF/rGO and P(VDF-TrFE)/BaO composites. PVDF/rGO overlapped with P(VDF-TrFE)/BaO thin films were sandwiched between two layers of kapton films of different thickness, in order to provide structural stiffness to the proof samples. We have demonstrated the increased X-rays attenuation efficiency of composites filled with reduced graphene oxide for 8.1 keV photons. The X-ray attenu-ation obtained by the sample with P(VDF-TrFE)/BaO and PVDF/rGO with 1.9% of rGO is around 50%. The corresponding linear attenuation coefficient was 21.29 cm-1. The half value layer was 0.0326 cm, including the thickness of Kapton films used to provide structural stiffness. FTIR data revealed that the ferroelectric β-phase of PVDF is predominant in PVDF/OG nanocomposites sam-ples, because of the lack of vibrational modes between 552 and 813 cm−1, which is characteristic of the β-phase. The results reveal that the multilayered sample that contains overlapped PVDF/rGO and P(VDF-TrFE)/BaO films are good candidates to be further investigated for application in X-ray shielding in interventional radiology and gamma radiation shielding.
5. ACKNOWLEDGMENT
The authors gratefully acknowledge the financial support of Conselho Nacional de Desenvolvimen-to Científico e Tecnológico (CNPQ), Fundação de Amparo à Pesquisa do Estado de Minas Gerais (FAPEMIG), Comissão Nacional de Energia Nuclear (CNEN) and Coordenação de Aperfeiçoamen-to de Pessoal de Nível Superior (CAPES).
6 - REFERENCES
[1] GREGONO, M.; CHAVES, N. Optimization of Polymer Nanocomposite Properties, John Wiley & Sons, Nova Jersey, EUA ,2009
[2] DUCROT, P.H.; DUFOUR, I.; AYELA, C. Optimization of PVDF-trfe Processing Conditions For The Fabrication Of Organic MEMS Resonators, Nature, 6, pp.19426, DOI: 10.1038/srep19426, 2016
[3]. GAIER, J.R;. ET. AL. Effect of Intercalation in Graphite Epoxy Composites on the Shielding of High Energy Radiation, NASA Technical Memorandum 107413, National Aeronautics and Space Administration: Washington, D.C ,DOI: 10.1557/JMR.1998.0320, 1997
4. Nambiar, S.; Yeon, J.T. Polymer-composite materials for radiation protection, ACS Appl. Mater.
Interfaces, v. 4, pp. 5717-5726, DOI: 10.1021/am300783d, 2012
5. FUJIMORI, T.; ET AL. Enhanced X-rays shielding effects of carbon nanotubes, Mater Express, v. 1, p. 273-278,DOI:10.1166/mex.2011.1043, 2011
6. VIEGAS, J.; et. al. Increased X-rays attenuation efficiency of graphene-based nanocomposite. Industrial e Engineering Chemistry Research, DOI: 10.1021/acs.iecr.7b0271, 2017.
7. NAIR J.; POTTS, R., ET AL. Graphene-based polymer nanocomposites, Polymer, v. 52, p. 5-25,. DOI:10.1016/j.polymer.2010.11.042, 2011
8. GRIGORENKO, R.; ET. AL. Fine structure constant defines visual transparency of
graphene. Science, p. 320, 1308 DOI:10.1126/science.115696, DOI:10.1126/science.115696, 2008
9. RUBRICE, K.;ET AL. Dielectric Characteristics and Microwave Absorption of Graphene Com-posite Materials. Materials, 9, 825 DOI:10.3390/ma9100825, 2016.
10. COMPTON O.; Graphene Oxide, Highly Reduced Graphene Oxide, and Graphene: Versatile Building Blocks for Carbon-Based Material. V. 6, p. 711 - 723, 2010 <http://onlinelibrary.wiley.com/doi/10.1002/pc.24292/epdf> Last accessed: 28 Nov. 2017.
11. RAJI, M.; Influence of graphene oxide and graphene nanosheet on the properties of Polyvinylidene Fluoride Nanocomposites. Polymer Composites, v. 38, DOI:10.3390/ma9100825, 2017.
12. THEMA, F.; ET.AL. Synthesis and Characterization of Grapheme Thin Films by Chemical Reduction of Exfoliated and Intercalated Graphite Oxide. Journal of Chemistry, . DOI: 101155/2013/150536, 2013.
13. FONTAINHA, C.; Desenvolvimento de Compósitos Poliméricos com Metais Atenuadores e Estudo da Eficiência de Atenuação da Radiação para Aplicação em Procedimentos Radiológicos. PhD thesis of Department of Nuclear Engineering of Universidade Federal de Minas Gerais. Belo Horizonte, 2016.
14. DEEPAK, A.; SHANKAR, P. Exploring the properties of lead oxide and tungsten oxide based graphene mixed nanocomposite films. Nanosystems : Physics, Chemistry, Mathematics,v. 7, p. 502-505, DOI:10.17586/2220-8054-2016-7-3-502-505, 2016.
15. MENG, N. ET AL. Crystallization kinetics and enhanced dielectric properties of free stand-ing lead-free PVDF based composite films, Polymer,v. 121, p.88-96, 2017.
16. ACHABYA, M.; ACHABYA, E.; ET AL. Piezoelectric β-polymorph formation and properties enhancement in graphene oxide – PVDF nanocomposite films. Applied Surface Science, v. 258, p. 7668-7677, 2012.
17. National Institute of Standards and Technology's web site. NIST. 2015.: <http://srdata.nist.gov/gateway/gateway?dblist=0> Last accessed: 28 Nov. 2017.
18. GAIER, J.; ET. AL. Effect of intercalation in graphite epoxy composites on the shielding of high energy radiation”; NASA Technical Memorandum 107413 ; National Aeronautics and Space Administration: Washington, D.C, DOI:10.1557/JMR.1998.0320,1997.
19. NAMBIAR, S.; YEON, J. Polymer-composite materials for radiation protection. ACS Appl. Mater. Interfaces, v. 4, p. 5717-5726, . DOI: 10.1021/am300783d, 2012.
20. AL-SAYGH, A.; ET. AL. Flexible pressure sensor based on pvdf nanocomposites containing reduced graphene oxide-titania hybrid nanolayers. Polymers, v. 9, p.33, DOI:10.3390/polym90200332017.
21. RAHMAN, A.; ET. AL. Synthesis of PVDF-graphene nanocomposites and their properties. J. Alloys Compd.v. 581, p.724, 2013.
22. RAHMAN,A.;, MD.; ET.AL. Fabrication and characterization of highly efficient flexible ener-gy harvesters using PVDF−graphene nanocomposites. Smart Mater. Struct. 22 (8), 085017, 2013.
23. JANG, J.; ET.AL. Structures and physical properties of graphene/PVDF nanocomposite films prepared by solution-mixing and melt-compression. Fibers Polym, v. 14, p.1332, 2013.
24. Gurunathan, S.; Jae Han J. W.; V., Kim, JH. Green synthesis of graphene and its cytotoxic ef-fects in human breast cancer cells, Int. J. of Nanomedicine, v8, p. 1015-1027, 2013, DOI: 10.2147/IJN.S42047
25. GAHLOT, S.; KULSHRESTHA, V.; AGARWAL, G.; JHA, P. K. Synthesis and Characteriza-tion of PVA/GO Nanocomposite Films. Macromol. Symp. 2015, 357, 173.