BJRS
RADIATION SCIENCES
03-01 (2015) 01-12
Quality control in breast tomosynthesis
R. R. Jakubiak
a; P. C. Messias
a; M. F. Santos
a; L. A. B. D. Urban
baDepartamento Acadêmico de Física/ UTFPR, 80230-901, Curitiba-PR, Brasil
bDiagnóstico Avançado por Imagem, 50740-540, Curitiba-PR, Brasil
ABSTRACT
In Brazil, breast cancer is the most common and the leading cause of death among women, with estimated 57,000 new cases in 2014. The mammography (2D) plays an important role in the early detection of breast cancer, but in some cases can be difficult to detect malignant lesions due overlap of breast tissues. The Digital Breats Tomosyn-thesis (DBT: 3D) reduces the effects of overlap, providing improved characterization of mammographic findings. However, the dose may double as compared with mammography. This study presents results of Contrast to Noise Ratio (CNR) and image quality evaluation on Siemens mammography equipment Mammomat Inspiration with tomosynthesis. The CNR was determined with Polymethylmethacrylate (PMMA) layers of 20 to 70 mm thick and an aluminum foils of 0,2 mm thickness and area of 10 mm². Image quality was assessed with the ACR Breast Simu-lator. In the evaluation of image quality, the detectability of fibers and masses was identical in 2D and 3D systems. Displaying fibers were 4,5 and 4 mass in both modes. In 2D mode were identified 3,5 microcalcifications groups, and 3D showed 3 groups. The Mean Glandular Dose (MGD) for the simulator in 2D mode was 1,17 mGy and 2,35 mGy for the 3D mode. The result reinforces the importance of quality control in the process of obtaining the images and obtained in accordance CNR values, ensuring image quality and compatible dose in 2D and 3D processes.
1. INTRODUCTION
In Brazil, breast cancer is the most common and the leading cause of death among women, with estimated 57,000 new cases in 2014 (INCA, 2013; FACINA, 2014). Currently, the mam-mogram (2D) plays an important role in the early detection of breast cancer (SVAHN, et al., 2014). The amount of fibroglandular tissue present in the breast is directly related to mammo-graphic density. When there are high densities in the image, there may be a difficulty in detec- ting malignant lesions because there are overlapping tissues (SOUZA, et al., 2012). Thus, it is necessary to use an imaging technique that can detect lesions, malignant or not, which are not displayed on a mammogram. The Digital Breast tomosynthesis (DBT: 3D) reduces the effects of overlapping breast tissue and can provide a better characterization of mammographic findings and reducing the need for additional supplementary views (URBAN et al., 2012).
The DBT image acquisition is very similar to the method of digital mammography, the dif-ference is that the x-ray tube rotates around the breast that remains compressed. A number of acquired projections are reconstructed through algorithms (BOUWMAN et al., 2013). The recent introduction of DBT in clinical practice requires Quality Control procedure (QC) and dose measurements (NHSBSP, 2013).
This study aims to implement a QC in DTB equipment, and thus provide a routine clinical practice with acceptable doses for the patient and the professional. The work was performed in a radiology clinic located in the region of Curitiba.
The QC tests in tomosynthesis used in this evaluation were based on those used by the Na-tional Health Service Breast Screening Programme (NHSBSP), European Reference Organiza-tion for Quality Assured Breast Screening and Diagnostic Service (EUREF), American Associa-tion of Physicists in Medicine (AAPM) and the Federal Ordinance 453/98.
2. MATERIALS AND METHODS
The QC tests in modes 2D and 3D were performed in a mammography unit Siemens Mam-momat Inspiration.
The determination of the Contrast to Noise Ratio (CNR) for each specific set of exposure pa-rameters was performed using aluminum (Al) and polymethylmethacrylate (PMMA) plates. The Al foils were used (type Al 1145) with a 99,9% purity, with a square area of 10 mm and a thick-ness of 0,2 mm associated with PMMA plates for the simulation of different breast thickthick-nesses between 20 and 70 mm.
The image quality was evaluated with Breast Simulator recommended by the American Col-lege of Radiology (ACR) and the Brazilian ColCol-lege of Radiology (BCR), model 450, which si- mulates a compressed breast of approximately 4,5 cm thick, and has inside, fiber details, masses and microcalcifications.
2.1. Contrast Ratio Noise
The performance evaluation of CNR in 2D mode was performed by exposure of PMMA plates varying the thicknesses of 20 to 70 mm. The aluminum foil was placed on the right side of the midline of the breast support tray and 6 cm from the chest wall edge. In all measurements, the Al foil was placed on top of a PMMA layer 20 mm thick.
In a first step the exposure was performed using the Automatic Exposure Control (AEC) using target / filter of W/R. After identifying the peak kilovoltage exposure factors (kVp), current ver-sus time product (mAs) for each thickness of PMMA, the exposure factors were reproduced in manual mode.
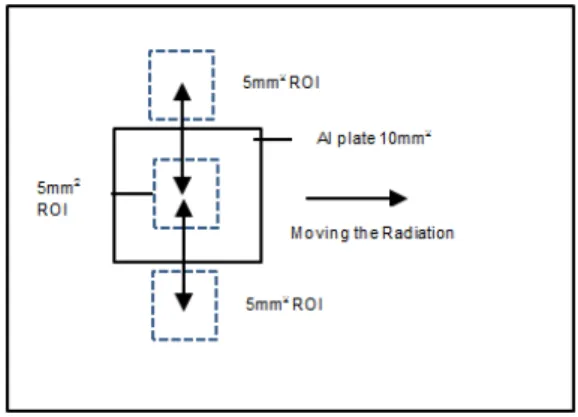
After the acquisition, the images were evaluated in raw data using a Region of Interest (ROI) of about 5mm x 5mm positioned in the center of Al, and two in the bottom region of the chest wall edge and nipple located below and above the Al foil region respectively as shown in Figure 1.
Figure 1: Representation of ROI to calculate the positions CNR
Font: EUREF 2013 (modified).
The obtained data, as Pixel Average Value (PAV) and standard deviation (SD) were recorded to calculate the CNR, using the analysis tools provided by mammography manufacturer. For the 3D method, the CNR was evaluated with the same methodology used for 2D and ROIs were evaluated in the first image reconstructed tomosynthesis in craniocaudal incidence (CC) for each PMMA thickness (EUREF, 2013).
The Figures 2A and 2B shows the images used for the calculation of CNR in tomosynthesis a In Figure 2A the image containing all the data display in the lower left corner of the image; in the Figure 2B the data of one ROI measurement, containing PAV and SD of data.
Figure 2: Image of DTB with PMMA plate and Al; A) the image containing all the data
dis-play in the lower left corner of the image; B) data of the ROI containing the PAV and SD of data A B
The CNR is defined as the ratio of the difference between the PAV and the bottom con-trasting details of a ROI, by the SD and deep structure. For each exposure techniques acquired in 2D and 3D modes, PAVS and SDs of the average pixel values were used to calculate the CNR of each thickness PMMA exposed, according of equation 1.
Equation 1: Equation used to calculate the CNR
Where PAV (PMMA) and PAV (Al) represent the average values of pixels in the regions of Al and PMMA of images. The SD (PMMA) and SD (Al) are the standard deviation measured in ROIs of PMMA and Al and are average values of pixels in the same regions. It should be re-membered that the SD is defined as the positive square root of the variance (YOUNG et al., 2006). It is known that the SD is the distance from an arbitrary value for the average value of the variable being generally represented by Equation 2 (BRASIL, 2014).
Equation 2: Equation used to calculate deviation standard
Where is the average value of the variable and X is any value. The variance aims to analyze the degree of variability of certain situations in which determines more specifically the possible variations, in order not to compromise the results of the analysis. The variance is measured by Equation 3 (BRASIL, 2014).
Where is the symbol used for the variance, the measure amounts to square the value of each deviation from the mean and then sum all results (numerator of the equation). Finally, the value of the sum is divided by N-1, which corresponds to the total number minus 1. Rises to the squared to eliminate negative signs of some deviations. Thus the SD of the PMMA is defined as the positive square root of the variance, according of the equation 2 (YOUNG et al., 2006, BRASIL, 2014); the variance being obtained with the Excel software.
2.2. ACR Mammography simulator
For the evaluation of image quality the ACR phantom was positioned exactly in the center of the image detector, near of the chest wall edge, exposed using the AEC with W/Rh target filter combination. In this case we used the combo mode equipment (2D + 3D), which provided data for the image of 2D and 3D. The images were evaluated on a BARCO console monitor with a resolution of 3M Pixel. Regarding the tomosynthesis images, the first reconstructed image was selected, because in this slice, the simulator elements have a maximum resolution and are in fo-cus. All data about the exposure parameters used and results of the evaluation of the images were recorded.
According to the Federal Ordinace 453/98, mammography systems must be able to identify the image of a fiber of 0,75 mm, one microcalcification group of 0,32 mm and a mass of 0,75 mm in the ACR phantom. The reference level for Mean Glandular Dose (MGD) is 3 mGy for ACR phantom (MS, 1998).
In QC tests performed in the mammography equipment with a calibrated detector PTW do-simeter DIADOS E (PTW manufacturer, Freiburg, Germany) with semiconductor T60005-1233, it was found that the MGD provided by the software mammography differ in average 1,5% of that estimated from the measurement of the surface air kerma. Thus, the MGD values presented in this work in 2D mode are values from the measurement of surface air kerma, and in 3D mode refer to the MGD of values obtained directly from the mammography unit dosimeter during the phantom exposure.
3. RESULTS
3.1. CNR
Table 1 presents of CNR results for 2D mode.
Table 1: Results found for CNR in 2D mode CNR 2D PMMA (mm) kVp mAs Target/Filter MGD (mGy) MGD* (mGy) CNR CNR NHSBSP** 20 24 80 W/Rh 0,7 < 1.0 14,6 4,2 / 6,2 30 26 100 W/Rh 0,9 < 1,5 13,7 4,2 / 6,2 40 27 140 W/Rh 1,2 < 2,0 11,2 4,2 / 6,2 45 28 160 W/Rh 1,4 < 2,5 11,4 4,2 / 6,2 50 28 200 W/Rh 1,7 < 3,0 11,5 4,2 / 6,2 60 29 280 W/Rh 2,3 < 4,5 9,6 4,2 / 6,2 70 30 450 W/Rh 3,4 < 6,5 9,9 4,2 / 6,2
*Acceptable values; **CNR of reference values as NHSBSP.
The 3D results can be seen in Table 2. For The 3D values were calculated for the first re-constructed image in DBT.
Table 2: Results found for CNR in 3D mode CNR 3D PMMA (mm) kVp mAs Alvo/Filtro MGD (mGy) MGD* (mGy) CNR CNR NHSBSP** 20 24 80 W/Rh 1,0 < 1.0 14,8 2,87 30 26 100 W/Rh 1,3 < 1,5 13,6 2,40 40 27 140 W/Rh 1,8 < 2,0 11,7 2,06 45 28 160 W/Rh 2,1 < 2,5 9,4 1,87 50 28 200 W/Rh 2,4 < 3,0 8,6 1,72 60 29 280 W/Rh 3,3 < 4,5 7,0 1,46 70 30 450 W/Rh 5,1 < 6,5 5,6 1,36
3.2. ACR simulator
The simulated structures were analyzed in visual recognition function on the 3M pixel monitor of the workstation of the mammography unit console. In Table 3, the exposure parame-ters used for 2D and 3D are presented. The MGD values and the score obtained for both methods as well as the reference values set by Federal Ordinance 453/98. With the images obtained by the simulator exposure was possible to score the fibers groups, masses and calcifications for both systems.
Table 3: Values obtained by the simulator exposures for 2D and 3D modes ACR Simulator
Modo kVp mAs MGD /Ref*
(mGy) Fibers/Ref.* Masses/Ref.* Micro/Ref.*
2D 27 93,8 1,2/3,00 4,5/4 4/3 3,5/3
3D 27 187,5 2,4/3,00 4,5/4 4/3 3/3
* Reference to the 2D mode with the minimum values expected by the Federal Ordinance 453/98.
4. DISCUSSION
4.1. CNR
The CNR is the test indicated as ideal parameter to evaluate the image quality in 2D (YOUNG, 2006). In the case of measurements realized for CNR in focal planes in the DTB re-construction, DBT it is expected that such measurements are highly dependent on the degree of leveling and inherent dimensioning of the reconstruction algorithm. Any interpretation of the absolute values of CNR regarding image quality needs to be interpreted with caution (NHSBSP, 2013).
It is known that the details of an image will be visible if the required CNR is maintained by having a relatively low noise level. Among the factors that influence the CNR are: the radiation spectrum, the pixel size, the dose to the detector and the characteristics of the study object (JAKUBIAK, 2013). However, by comparing the calculated CNR values with the literature (NHSBSP, 2013), which is within the limits, it was identified differences in the results obtained.
This difference may be associated with the factors that influence the CNR, among which are: the type of detector, the test dose pattern and the unit performance.
The values of the CNR are equivalent to the dose received at the detector at the time of expo-sure. Even with values above used as a reference, it is observed that the CNR kept relatively low noise level and the values obtained are consistent with the expected image quality. By comparing with the results of image quality test, using the ACR Breast Simulator, the system was sensitive enough to register filamentary structures, good image definition to show microcalcifications and large capacity to record image of tumor masses, as recommended by Federal Ordinance 453/98, that’s mean that, for the 3D system the score cannot be less than required for the 2D system.
4.2. ACR simulator
As shown in Table 2, it is possible to see that the test result with ACR breast simulator is within the standards recommended by the ACR and Federal Ordinance 453/98.
For the total of identified fibers, both 2D systems as in 3D outweigh the references of Ordi-nance 453/98. These linear low contrast objects with different diameters simulate fibrous tissue extensions, which, when exposed, allow the measurement of the sensitivity of the image produc-tion system to record filamentary structures within the breast (INCA, 2007).
The groups of masses did not occurred significantly differences when the results of 2D and 3D systems are compared, but it is possible to note, though, a result that is higher than the set defined by the Federal Ordinance 453/98. The ability to record the image of the tumor masses is a very realistic measure of the 2D image quality.
As for microcalcifications groups you can see that the 2D system overcomes the 3D, but the latter remains within the standards. This is due the 2D system has better image definition (INCA, 2007). Although the radiologists using for the breasts evaluation monitors of 5M pixel, these results are relevant, since in Core biopsies and vacuum biopsy, the monitors of 3M pixel of mammography workstation console that are used for visualization of lesions during procedures.
As for registered MGD, can be seen that the 3D mode offered twice the dose compared to 2D, but the values are still below the reference values for the measured thickness.
When comparing the CNR values, MGD and image quality can be seen that a well-tuned sys-tem can produce adequate image quality with low dose. What guarantees the patients treated in these devices, the safety of a procedure where the benefit outweighs the risks.
Other tests related to the effectiveness of the clinical dose of DBT system are still in progress and their results are under review.
5. CONCLUSION
The CNR values obtained are compatible with the expected image quality, as to the results with the test breast simulator, the system was sensitive enough to register filamentary structures, excellent image definition to show microcalcifications and large capacity registering image tu-mor masses, that is, the CNR was adequate to keep a relatively low noise level.
When comparing systems, the MGD values for ACR simulator in 2D mode was 1,2 mGy and 2,4 mGy for 3D, which reinforces compliance obtained in CNR values, ensuring image quality and dose compatible in 2D and 3D processes.
The tests were adequate for the purpose of this study, and the results are within the limits es-tablished for those image acquisition parameters. The image quality in 2D and 3D mode meet the limits of conformity. With the results obtained with the ACR simulator and the MGD evaluation for all measured thicknesses, it was demonstrated that when performing tomosynthesis mam-mography in Siemens Mammomat Inspiration, image quality meets the quality requirements without exceeding the dose limits considered acceptable for each breast thickness measured.
Thus, we can say that the equipment provides an acceptable dose with appropriate image quality for diagnosis.
6. ACKNOWLEDGEMENTS
We would like to acknowledge DAPI clinic, in the city of Curitiba, which allowed the reali-zation of the evaluations and the publication of the results.
REFERENCES
1. INCA - Instituto Nacional de Câncer José Alencar Gomes da Silva. Estimativa de Câncer em Mamografia. Brasil. 2012. Avaliable at: <http://www.inca.gov.br/estimativa/2012/>.
Last accessed: 03 Jul. 2014.
2. FACINA, T. Estimativa 2014 – Incidência de Câncer no Brasil. Instituto Nacional de Câncer
José Alencar Gomes da Silva (INCA). Revista Brasileira de Ocologia, vol. 60, p. 63-64, 2014.
3. SVAHN, T.M.; CHAKRABORTY, D.P. ; IKEDA, D.; ZACKISSON, S.; et al., Breast
tomossinthesys and digital mammography:a comparison of diagnostic accuracy, The British
Journal of Radiology, v.85, p. 1074-1082, 2012.
4. SOUZA, R. T. F.; PNA, D. R.; ALVAREZ, M.; VELO, A.F.; et al. Quantificação de tecidos
em imagens por meios de histogramas, Revista Brasileira de Física Médica, vol. 6, n 2, p. 173-177, 2012.
5. URBAN, L. A. B. D.; SCHAEFER, M. B.; DUARTE, D. L.; SANTOS, R. P. ; et al.,
Recomendações do Colégio Brasileiro de Radiologia e Diagnóstico por Imagem, da Sociedade Brasileira de Mastologia e da Federação Brasileira das Associações de Ginecologia e Obstetrícia para rastreamento do câncer de mama por método de imagem.
Revista de Radiologia Brasileira de Engenharia, Vol. 45. n. 6, p. 334-339, 2012.
6. BOUWMAN, R. W.; DIAZ, O.; ENGEN, R.E.V.; YOUNG, K. C.; et al., Phantoms for
quality control procedures in digital breast tomosynthesys: dose assessment, Physics in
7. NHSBSP - National Health Service Breast Screening Programme. Thechnical Evaluation of Siemens Mammomat Inspiration Digital Breast Tomosinthesys System. Equipment Re-port 1306. NHSBSP, 2013 a.
8. EUREF - National Expert and Training Centre for Breast Cancer Screening. Protocol for the Quality Control and Techinical Aspects of Digital Breast Tomosynthesis Systems. Na-tional Expert and Training Centre for Breast Cancer Screening, Radbound University
Nijimegen Medical Centre: EUREF, 2013.
9. YOUNG, K. C.; COOK, J. J. H.; ODUKO, J. M.; BOSMANS, H.; Comparison of software
and human observers in reading images of the CDMAM test object to assess digital mam-mography systems. In Proceedings of SPIE, Medical Imaging, vol. 6142, p. 1-13, 2006.
10. BRASIL. Calculando Amplitude, Variância e Desvio Padrão. 2014. Available at:
<http://www.devmedia.com.br/calculando-amplitude-variancia-e-desvio-padrao-no-oracle>. Last accessed: 03 Jul. 2014.
11. MS - Ministério da Saúde. Secretaria de Vigilância Sanitária, Regulamento técnico. Diretrizes de proteção radiológica em radiodiagnóstico médico e odontológico. Portaria nº 453, Brasília, 1998. 36p.
12. JAKUBIAK, R. R. Qualidade de imagem, limiar de contraste e dose glandular média e
mamografia digital CR, Dissertação, Universidade Tecnológica Federal do Paraná, 2013.
13. INCA, MS. Mamografia da Prática ao Controle, Rio de Janeiro: Ministério da Saúde,