Microbubble moving in blood flow in microchannels: effect
on the cell-free layer and cell local concentration
David Bento1,3&Lúcia Sousa1&Tomoko Yaginuma1&Valdemar Garcia1& Rui Lima2,3&João M. Miranda3
Published online: 16 January 2017
#Springer Science+Business Media New York 2017
Abstract Gas embolisms can hinder blood flow and lead to occlusion of the vessels and ischemia. Bubbles in microvessels circulate as tubular bubbles (Taylor bubbles) and can be trapped, blocking the normal flow of blood. To understand how Taylor bubbles flow in microcirculation, in particular, how bubbles disturb the blood flow at the scale of blood cells, experiments were performed in microchannels at a low Capillary number. Bubbles moving with a stream of
in vitroblood were filmed with the help of a high-speed cam-era. Cell-free layers (CFLs) were observed downstream of the bubble, near the microchannel walls and along the centerline, and their thicknesses were quantified. Upstream to the bubble, the cell concentration is higher and CFLs are less clear. While just upstream of the bubble the maximum RBC concentration happens at positions closest to the wall, downstream the max-imum is in an intermediate region between the centerline and the wall. Bubbles within microchannels promote complex spatio-temporal variations of the CFL thickness along the microchannel with significant relevance for local rheology
and transport processes. The phenomenon is explained by the flow pattern characteristic of low Capillary number flows. Spatio-temporal variations of blood rheology may have an important role in bubble trapping and dislodging.
Keywords Microfluidics . Gas embolism . Cell-free layer . Red blood cells .In vitroblood . Micro bubble
1 Introduction
A gas embolism is the presence of gas in blood circulation (Muth and Shank2000). The formation and transport of bub-bles inside the blood vessels can have exogenous origin, when air is injected in the blood stream, or endogenous origin when gas bubbles form inside the blood stream. Bubbles from exog-enous origin include bubbles resulting from medical proceed-ings such as surgeries (Borger et al.2001, Abu-Omar et al. 2004), hemodialysis (Bischel et al. 1975) and gas embolotherapy (Samuel et al.2012). Bubbles from endogenous origin comprise the formation of bubbles by cavitation in heart valves (Deklunder et al. 1998, Milo et al. 2003) and when pressure decreases abruptly in scuba diving (Papadopoulou et al. 2013), astronaut extra vehicular activities (Karlsson et al.2009) or in high altitude flight (Foster and Butler2009). Bubble formation, detachment, transport, coalescence and entrapment in the blood vessels have been subject of research to understand how bubbles can hinder the blood flow and lead to occlusion of the vessels and ischemia (Papadopoulou et al. 2014). Bubbles in small vessels flow as tubular bubbles (Branger and Eckmann2002, Samuel et al.2012), and they can be trapped on bifurcations or small branches (Samuel et al. 2012). Bubbles in circulation dissolve in the blood at a rate that depends on their size, composition and shape (Papadopoulou et al.2014). Surfactants are known to modify David Bento and Lúcia Sousa contributed equally to the manuscript.
Electronic supplementary materialThe online version of this article
(doi:10.1007/s10544-016-0138-z) contains supplementary material, which is available to authorized users.
* João M. Miranda [email protected]
1
School of Technology and Management (ESTiG), Polytechnic Institute of Bragança (IPB), Campus de Santa Apolónia, 5300-253 Bragança, Portugal
2
MEtRiS, Department of Mechanical Engineering, Minho University, Campus de Azurém, 4800-058 Guimarães, Portugal
3 Transport Phenomena Research Center (CEFT), Department of
Chemical Engineering, Engineering Faculty, University of Porto, Rua Dr. Roberto Frias, 4200-465 Porto, Portugal
the surface tension and contact angles of bubbles (Suzuki et al. 2004, Eckmann et al.2006). Decrease of the surface tension facilitates the breakup of bubbles and increases the interfacial area leading to the dissolution of the bubbles (Branger and Eckmann2002).
Some work has been done to visualize and measure the flow of microbubbles in small vessels. Microbubbles moving in steady state co-current flow in microchannels have been studied numerically (Taha and Cui 2006, Angeli and Gavriilidis 2008, Talimi et al. 2012) and experimentally (Thulasidas et al. 1997, Angeli and Gavriilidis 2008). Bubble flow and lodging in capillaries have been observed
in vivoby Samuel et al. (2012). The authors used vaporized dodecafluoropentane to form bubbles of 34 to 39μm and were able to visualize tubular bubbles, including bubbles lodge in bifurcations. However, most researchers worked within vitro
models, using single-phase blood analog fluids. Calderón et al. (2006) studied the lodging of bubbles in microvessel bifurcations. Oxygen plasma treated Poly(dimethylsiloxane) (PDMS) models of vessel bifurcations were used. The authors found that the pressure to dislodge a bubble from a bifurcation is higher than the pressure to lodge the bubble. This phenom-enon was attributed to contact angle hysteresis. It was also found that when a bubble is trapped in one of the branches it is not possible to remove it by increasing pressure. Eshpuniyani et al. (2005) studied micro bubble transport in networks with 3 generations of vessels, with the main branch of 1 mm and a branching ratio of 0.78. The experimental setup was made of acrylic and the fluid system used was water/air. For these dimensions the authors found a dependence of bubble splitting size ratio on buoyancy. The authors observed sticking of the bubble below a critical capillary number. A similar study was performed by Valassis et al. (2012) for pulsated flow. The authors found no effect of os-cillatory flow on splitting behavior. However, bubble lodging was affected by the flow pulsatility.
No in vivostudy was performed to visualize flow near bubbles at the scale of blood cells, andin vitrostudies have been performed using monophasic blood analogs. However, blood is a multiphase fluid composed by blood cells and plas-ma and several phenomena that have been observed in blood at a microscale level are attributable to blood multiphasic na-ture. Blood cells include red blood cells (RBCs), white cells and platelets. In microfluidic systems and in capillary vessels, the RBCs have a size that is a significant fraction of the size of the channel. Effects due to the discrete size of the cells, such as the formation of a plasma layer (Leble et al.2011, Garcia et al. 2012, Pinho et al.2013), plasma skimming (Faivre et al. 2006), the Zweifach-Fung effect (Svanes and Zweifach 1968, Fung1973, Doyeux et al. 2011), the Fahraeus effect (Fåhraeus1929) and the Fahraeus-Lindqvist effect (Fåhræus and Lindqvist1931) are relevant. A plasma layer or cell-free layer (CFL) is usually formed near the wall of small vessels
due to the migration of red blood cells to the center of the microchannel. A CFL has also been observed in the channel centerline after a confluence (Ishikawa et al.2011, Leble et al. 2011). The size of the CFL can be enhanced by introducing a constriction in the channel, as shown by Faivre et al. (2006). The authors found that the CFL after a constriction is thicker than the CFL before the constriction and attributed the obser-vation to a geometrically enhanced Fahraeus effect. Constrictions were also used by Sollier et al. (2010), Yaginuma et al. (2013) and Pinho et al. (2013) to design microdevices for blood fractionation.
While research on bubble flow in microvessels has focused on lodging and occlusion of the vessels, leading to total block of the flow stream in a certain region of the network, there is need to study how bubbles can affect the distribution of RBCs in the flow and how they interact with the CFL. In this paper, experiments of gas embolisms using in vitroblood are per-formed to analyze the effect of a gas slug on the CFL and on the distribution of cells within the flow.
2 Materials and methods
2.1 Working fluids preparation
Dextran 40 (Dx40) containing about 10% (i.e., hematocrit level of 10%) of ovine RBCs was prepared as working fluid. Briefly, blood was collected from a healthy ovine and 1.8 mg of K2EDTA (commercial tube BD Vacutainer® EDTA) per milliliter of blood was added in order to prevent coagulation. The RBCs were separated from bulk blood by centrifugation (2000 rpm for 15 min at 4 °C) and aspiration of the plasma and buffy coat. The RBCs were then washed twice with a physi-ological saline solution and diluted with Dx40 to make up the required RBC concentration. All blood samples were stored hermetically at 4 °C until the experiments were performed at room temperature of approximately 20 °C.
2.2 Microchannel fabrication
in an oven at 80 °C for 20 min. By using a blade, the microchannels were cut off and the inlet/outlet holes of the fluid were made by using a fluid dispensing tip. Finally, the channels were sealed by the PDMS covered glass slides. To have a strong adhesion of the materials, the device was placed in the oven at 80 °C for 24 h.
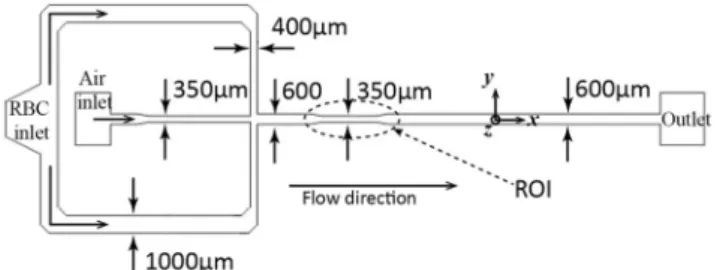
Figure1shows the microchannel geometries and flow di-rections of RBCs and air. As can be seen, Dx 40 containing 10% of RBCs and air are injected from separate inlets and are to be met at the cross section. Flow rate of RBCs was set to 4μL/min and air pressure was set to 25 mbar. These condi-tions were set in order to study the effect of the bubble itself and neglect the effect from former passing bubbles. In this work 20 bubbles flowing with approximately the same condi-tions were analysed. The time interval between the formation of each bubble was about 8.8 s and the bubble average veloc-ity was around 2.3 mm/s (a video showing the bubble frequen-cy can be found in supplementary material– Movie2). The depth along the length of the microchannels is approximately uniform and has a value of about 100μm.
Taylor bubble flow in co-current liquid flow in micro-channels is characterized by the Capillary number, which measures the ratio between viscous and surface tension forces and is defined as:
Ca¼
Ubμ σ
whereUbis the bubble velocity,μa the liquid viscosity andσ the surface tension. Gravity can be neglected for flows in microchannels and inertia can be neglected for realistic liquid velocities. Thus, the bubble velocity normalized by the liquid average velocity, the film thickness and the bubble shape are func-tion of the capillary number. The capillary number for the experiments performed in this work is 1.4 × 10⁻⁴.
The region of interest (ROI) at this study is around the contraction region downstream the cross section (cf. indicated by a dotted circle in Fig.1), where the width of microchannel is narrowed from 600μm to 350μm and then expanded back to 600μm. The contraction facilitates the release of the bubble since the bubble is subjected to a higher liquid velocity. The reason to use a contraction with a minimum width of 350μm was mainly due to limitations of the xurography technique (Bartholomeusz et al.2005, Pinto et al.2015).
2.3 Experimental set-up
A high-speed video microscopy system was used in this study. This system consists of an inverted microscope (IX71, Olympus) combined with a high-speed camera (i-SPEED LT, Olympus). Images were acquired at 60 fps and the time interval between each image was 0.01666 s. The fabricated microfluidic device was placed on the stage of the inverted microscope. A syringe pump (Harvard Apparatus PHD ULTRA) was used to produce a constant flow rate ofin vitro
blood. An additional pressure pump (Elveflow AF1 PG1113) was used to inject air at a constant pressure in the microchannel.
2.4 Image analysis
For CFL measurement, MTrackJ plug-in integrated in ImageJ software was used (Abramoff et al. 2004, Meijering et al. 2012). Before the measurement, recorded images were pre-processed as the following steps. First, RGB video images were converted to 8 bit grey scale images. Then, by replacing each pixel with the median of the neighboring pixel values, noise of the images was reduced. In this way, the distinction between high intensity region (CFL) and low intensity region (RBCs) became smoother and clearer. Using this intensity level gap, the edge of CFL was identified and tracked manu-ally by MTrackJ as well as the wall edge (cf. Fig.2), and then the thickness of CFL was calculated.
3 Results and discussion
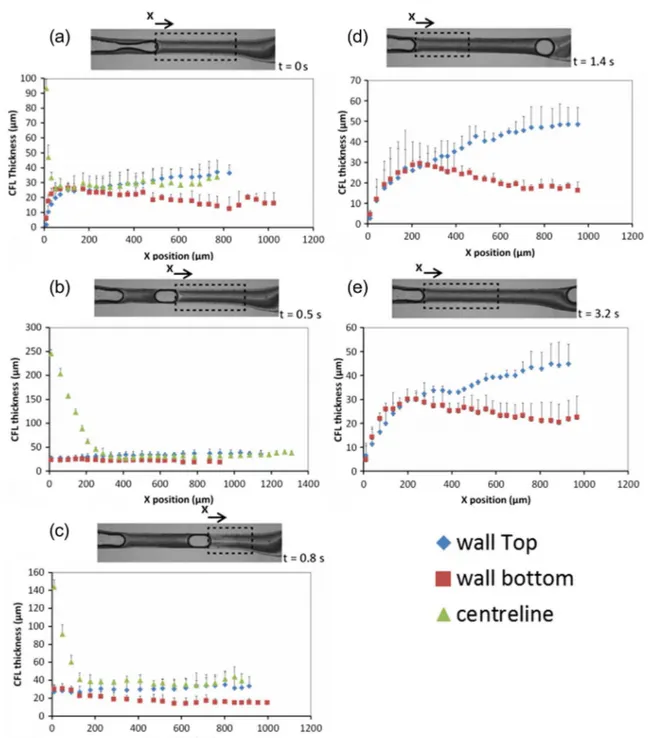
Figure3 shows the sequential images of bubble flow at the contraction region. When the bubble is generated, CFLs are observed downstream both near the wall and at the center of the microchannel, showing brighter color than other regions. As the bubble proceeds in the contraction region, the CFLs down-stream become much clearer and slightly wider. On the other hand, cell depleted regions upstream the bubble are not as clear as downstream, especially at the center. Nevertheless, it is observed that the CFL is on the way to be formed at the center. Immediately upstream to the bubble, the CFL
Fig. 1 Microchannel geometries and flow directions
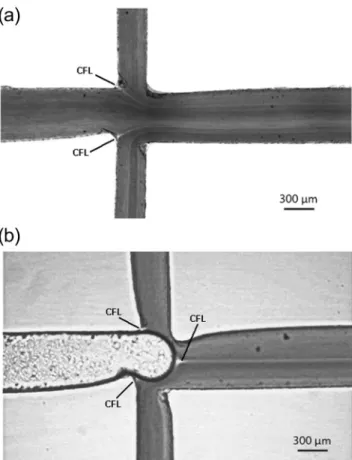
Fig. 2 View of image analysis and measurement of CFLs near the wall,
near the wall is not visible. Only far upstream to the bubble is clearly seen.
Figure4shows the bubble velocity as the bubble moves along the channel. Before the release of the bubble, the bubble tip moves at a velocity of about 0.5 mm/s. When it is released, the bubble accelerates reaching a terminal velocity of about 2.3 mm/s in less than 0.1 s. The bubble velocity remains constant along the contraction region and starts decreasing when the bubble enters the expansion after the contraction, where the liquid velocity is smaller.
Figure5is a view of the cross section where RBCs and air meet. These images are created by adding 5 frames of image sequences in order to visualize the cells flow behavior. Figure5a shows only RBCs flow and no significant CFL is seen. In Fig.5b, where the air is entering the cross section, CFL formation downstream the air inydirection around the center of the microchannel is observed. In both Figs.3and5, it is possible to observe the formation of a CFL in the centreline of the microchannel. This phenomenon is similar to the CFL
formed immediately downstream of the apex of a confluence (Ishikawa et al.2011, Leble et al.2011). The CFL observed in Fig. 5b is originated from the upstream cell depleted layers that are formed around the microchannel walls and the pres-ence of a bubble promotes the convergpres-ence of both layers into the centreline of the microchannel. The size of the observed
Fig. 4 Bubble velocity as a function of time for the reference case. The
bubble accelerates when released taking less than 0.1 s to reach a constant terminal velocity (2.3 mm/s). The velocity remains constant and decreases after the contraction due to the increase of the cross-section area of the channel
Fig. 3 Sequential images of
bubble flow at the contraction region. A reference movie of a microbubble moving in blood flow can be found in
supplementary material (Movie
1). At the contraction region the size of the bubble has a major and minor axis length of about 591μm and 342μm. At the expansion region the bubble has a diameter of about 471μm
Fig. 5 A view of cross section.aOnly RBCs are flowing. The CFL
layer also suggests that the bubble has an additional contribu-tion to the formacontribu-tion of the CFL, acting as a wall and forcing the RBCs to migrate away from the bubble sur-face across the streamlines.
The CFL thicknesses near the walls and at the center were measured and plotted for 5 different time phases as shown in Fig.6. Fort= 1.4 s and 3.2 s, we did not measure the CFL at the centerline as we considered the depletion of the cells were not as complete as downstream.
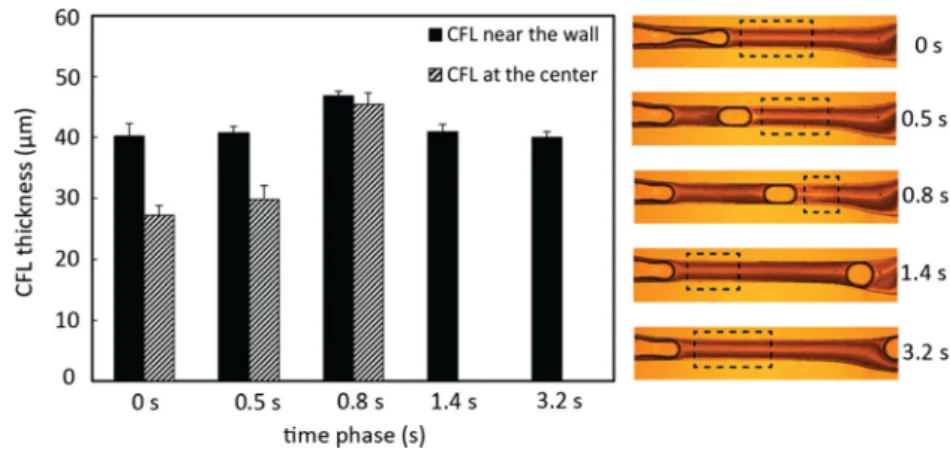
Using results plotted in Fig.6, CFL thickness was averaged to provide the mean CFL thickness for the selected region (cf. Fig.7). The CFL thickness both near the wall and at the center becomes maximum when t = 0.8 s where the bubble is reaching the exit of the contraction region. Except fort= 0.8 s, the CFL thickness near the wall does not show significant difference by time phase.
By analyzing a reference movie (see supplementary material, Movie1) of a microbubble flowing through the con-traction it is possible to observe that, just before the bubble release, the CFL near the wall develops immediately after the bubble (triangular shape in Fig. 8). At this early stage the bubble is being bypassed by a stream with high cell concen-tration. This stream flows through a narrow constriction be-tween the bubble and the walls of the channels. Narrow con-strictions contribute to enhance the CFL, as shown by Faivre et al. (2006). When the bubble is released, the bypassing flow stops because the bubble is moving faster than the liquid av-erage velocity and the fluid velocity, in the bubble frame of reference, in the film is almost zero (according to Taha and Cui (2006)). When the bubble reaches the terminal velocity (Fig.4), the liquid flow, observed from the perspective of the bubble reference frame, can be represented by the streamlines of Fig.9. This streamline representation is based on the work of Taha and Cui (2006) and is valid for low Capillary numbers (Ca < 0.05). Upstream to the bubble the fluid in the centerline moves to the bubble and the fluid near the wall moves away from the bubble. Downstream to the bubble the reverse oc-curs, the fluid in the centerline moves away from the bubble and the fluid near the wall moves to the bubble. Downstream to the bubble, low concentration fluid near the wall moves along the streamlines and away from the wall and from the bubble decreasing the concentration in front of the bubble and increasing the CFL thickness (t= 0.8 s, Fig.7). Immediately upstream to the bubble the reverse phenomenon occurs: high concentration fluid moves to the wall eliminating the CFL near the wall. This region is not analyzed in Fig. 7 but the phenomenon of the disappearance of the CFL immediately upstream of the bubble can be observed in Fig.10and in the reference movie in supplementary material.
The influence of the CFL thickness by physical and rheo-logical factors such as hematocrit, RBC deformability, vessel diameter and flow rate is well documented in the literature (Maeda 1996, Mchedlishvili and Maeda 2001, Lima et al.
2009a, Garcia et al.2012, Bumseok et al.2014), however to the best of our knowledge the effect of a microbubble on the CFL thickness has never been investigated. The results from Figs.6and7show clearly that microbubbles have a signifi-cant influence on the CFL thickness and consequently on the rheological properties of blood flowing in microvessels and biomedical microdevices.
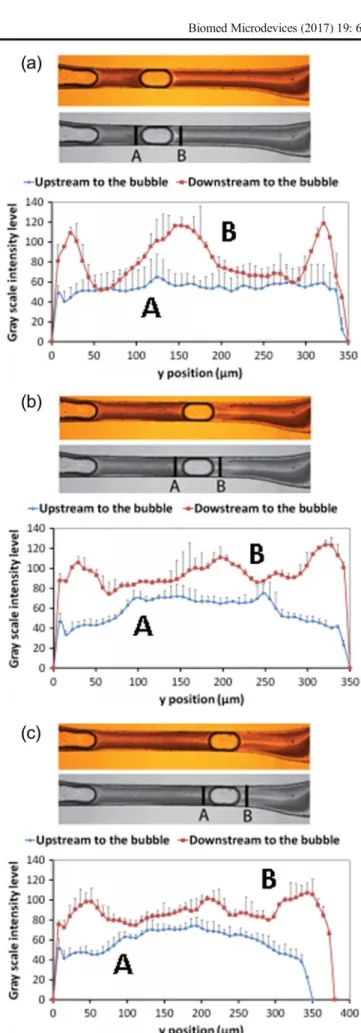
In order to understand the influence of a microbubble on the local RBC concentration, plots of the gray-scale values across the microchannel for different time phase, both up-and downstream of the microbubble, are shown in Fig. 10. By assuming an approximate correspondence between the scale intensity and the RBC number density (high gray-scale values correspond to white regions and low RBC num-ber density), the results indicate that the microbubbles have a strong influence in the number density of RBCs located at both downstream and upstream. Additionally, these results also show evidence that the existence of a microbubble flowing in a microvessel may give rise to a local maximum in the cell number density at positions closest to the wall. Note that this latter phenomenon only happens upstream to the bub-ble. In contrast, for the downstream part the maximum con-centration of cells occurs at positions off the centerline and walls. The flow pattern represented in Fig. 9 explains these phenomena. Upstream to the bubble, high concen-tration fluid is transported to the wall. Downstream to the bubble, low concentration fluid is transported from the wall to the centerline.
In general, the results reported here have revealed that the presence of microbubbles leads to a non-uniform cell concen-tration in both microvessels and biomedical microdevices. Hence, we believe that microbubbles may have a strong im-pact on the transport processes happening in microcirculation, such as nitric oxide scavenging by RBCs and oxygen delivery from the cells to tissues. Previous works on dislodging of microbubbles have neglected the effect of cell concentration. Cell concentration has a direct effect on the local blood vis-cosity, which indirectly affects pressure drop along the flow and, consequently, pressure distribution around the bubble and bubble shape. Further work will be necessary to determine how cell concentration affects local blood viscosity and how it influences bubble trapping and dislodging.
3.1 Limitations and future directions
been made to develop simple, fast and low-cost alternatives techniques for the fabrication of microstructures, avoiding the use of cleanroom facilities. A successful example is the xurography technique that uses a cutting plotter machine and adhesive vinyl films to generate the master moulds to fabricate microfluidic channels (Faustino et al.2016). Recently, Pinto and his colleagues (Pinto et al.2015), by using this technique, have successfully fabricated biomedical microfluidic devices and have observed blood flow phenomena that happens in bothin vivoan
in vitroenvironments. Hence, this latter work has encouraged us
to apply this technique to perform generation of bubbles and to investigate its effect on the blood flow behavior in microchannels bigger than 350μm. Although the geometries are not completely symmetric we have found that for the dimensions tested in this study, such limitation has a negligible effect on the blood flow results and it is reasonable to investigate the CFL phenomenon. For small Capillary numbers (Ca <0.05) the flow of Taylor bubbles is in the surface tension dominated regime. In this regime the flow pattern has the following characteristics (Taha and Cui2006):
Fig. 6 CFL thickness at different time phase. The measured values are expressed as the means ± standard deviation according to at-test analysis at a 95%
& Very thin film.
& Velocity of the bubble slightly above the average fluid velocity.
& Recirculation zones that occupy all the liquid slug (in the bubble frame of reference) upstream and downstream the bubble (Fig.9).
& Bubble has front/back symmetry.
The capillary number in the human circulatory system in ves-sels smaller than 500μm is smaller than 3 × 10⁻³and the present
results are forCa= 1.4 × 10⁻⁴. The flow characteristics of the
present study are therefore similar to the ones found in human circulatory system and the same phenomena are expected to be foundin vivo.
The results obtained in the present paper can be compared with studies on blood flow in microchannels that have been presented in a large body of literature. In these studies, the channels usually have square/rectangular cross sections due to the most common methods to fabricate microchannels, i. e., SU-8 photolithography and xurography are planar tech-niques. Extrapolation of the results to circular microchannels is a common problem. The wall CFL observed are boundary layer phenomena, which are not significantly influenced by the bulk flow and by 3D effects. Our experiment captures the phenomena in the midplan of the channel. Since the cross section is rectangular, with a width/depth ratio of 3.5, the observed midplan is similar to a plan crossing the center of a channel with a circular cross channel. Flow patterns of bub-bles in rectangular channels and in circular microchannels are
similar, as shown in the literature (Taha and Cui2004, Taha and Cui2006). The CFL in the center of the channel forms around the bubble and depends on the 3D shape of the bubble, which is influenced the geometry of the channel.
Although, the flow characteristics investigated in this study are the ones found in human circulatory systems, it is impor-tant to confirm if there are relevant differences between the Capillary number studied and the maximum capillary number observed in human circulation, and for these reason experi-ments at a higher flow rate should be performed in the future. Additionally it would be useful to examine the bubble effect on the CFL at smaller dimensions, for which the ratio between the cell and the vessel characteristic dimension is higher, and complex geometries such as bifurcations and confluences. By using moulds produced by photolithography technique, in the near future, we are planning to obtain more detailed insights about embolisms at smaller dimensions. Further work is also necessary to observe these phenomena in circular cross-section microchannels (Lima et al. 2009b, Fiddes et al. 2010), preferentially using cells cultured on their walls in or-der to provide an environment to mimicin vivomicrovessels. One of main purposes of this work was to investigate the effect of the bubble itself and neglect the effect from former passing bubbles. Hence, for the predefined conditions the high speed camera used in this study was suitable to record both the bubble generation and the CFL phenomenon (see supplemen-tary movies). However, for higher bubble frequencies and higher flow velocities a high speed camera able to record 10,000 frames per second is mandatory.
Fig. 7 Mean CFL thickness near
the wall and at the center by different time phase
Fig. 8 A view of the CFL
4 Conclusions
In this paper, we reported experiments on the influence of a microbubble on the flow of RBCs in microchannels. We showed that the presence of bubbles within microchannels promotes complex spatio-temporal variations of the CFL thick-ness along the microchannel. Ourin vitroblood experiment suggests that the microbubbles lead to heterogeneous distribu-tion of blood cells around it. Our results have shown that for positions just upstream of the bubble the maximum number of RBC concentration happens at positions closest to the wall. However, for locations close to the downstream part of the bubble, the maximum concentration of cells occurs at posi-tions off the centerline and walls. We linked these observa-tions to the recirculaobserva-tions present in the liquid slug character-istic of low Capillary number flows.
It is well known that blood flows in the microcircu-latory system is characterized by a narrow CFL adjacent to the walls and its width is affected by physical and rheological factors such as hematocrit, RBC deformability and aggregability, microvessel diameter (Faivre et al. 2006, Bumseok et al. 2014). In this study, we have identified a new physical factor that strongly influences the CFL thickness in bothin vivo andin vitro
environments. The CFL plays an important role in balancing NO production by the endothelium and NO scavenging by RBCs. Cell distribution influences hemo-dynamics around a trapped bubble, implying that the observed phenomena may have an important role in bubble trapping and dislodging. Hence, we believe that the results shown here may contribute for new insights into how microbubbles may influence on the transport processes happening in microcirculation.
Fig. 9 Schematic representation based on the work of Taha and Cui
(2006) of the flow streamlines in the bubble reference frame when the bubble reaches the terminal velocity in the contraction region
Fig. 10 Value of the intensity of the gray scale (0 = black; 255 = white)
versus the displacement y across the microchannel before (A) and after (B) the microbubble for different time phase:at= 0.5 s;bt= 0.8 s andc
Acknowledgements The authors acknowledge the financial support provided by PTDC/SAU-BEB/105650/2008, PTDC/SAU-ENB/ 116929/2010, EXPL/EMS-SIS/2215/2013 and PTDC/QEQ-FTT/4287/ 2014 from FCT (Science and Technology Foundation), COMPETE, QREN and European Union (FEDER).
References
M. D. Abramoff, P. J. Magalhaes, S. J. Ram, Image processing with ImageJ. Biophoton. Int.11(7), 36–42 (2004)
Y. Abu-Omar, L. Balacumaraswami, D. W. Pigott, P. M. Matthews, D. P. Taggart, Solid and gaseous cerebral microembolization during off-pump, on-off-pump, and open cardiac surgery procedures. J. Thorac. Cardiovasc. Surg.127(6), 1759–1765 (2004)
P. Angeli, A. Gavriilidis, Hydrodynamics of Taylor flow in small chan-nels: a review. Proc. Inst. Mech. Eng. C J. Mech. Eng. Sci.222(5), 737–751 (2008)
D. A. Bartholomeusz, R. W. Boutte, J. D. Andrade, Xurography: rapid prototyping of microstructures using a cutting plotter. J. Microelectromech. Syst.14(6), 1364–1374 (2005)
M. D. Bischel, B. G. Scoles, J. G. Mohler, Evidence for pulmonary microembolization during hemodialysis. CHEST Journal67(3), 335–337 (1975)
M. A. Borger, C. M. Peniston, R. D. Weisel, M. Vasiliou, R. E. A. Green, C. M. Feindel, Neuropsychologic impairment after coronary bypass surgery: effect of gaseous microemboli during perfusionist interven-tions. J. Thorac. Cardiovasc. Surg.121(4), 743–749 (2001) A. B. Branger, D. M. Eckmann, Accelerated arteriolar gas embolism
reabsorption by an exogenous surfactant. Anesthesiology96(4), 971–979 (2002)
N. Bumseok, H. L. Leo K. Sangho, Physiological significance of cell-free layer and experimental determination of its width in mi-crocirculatory vessels, inVisualization and simulation of complex flows in biomedical engineering, ed. byR. lima, T. Ishikawa, Y. Imai, M. S. N. Oliveira (Springer, Dordrecht, 2014), pp. 75–87 A. J. Calderón, Y. S. Heo, D. Huh, N. Futai, S. Takayama, J. B. Fowlkes,
J. L. Bull, Microfluidic model of bubble lodging in microvessel bifurcations, Appl. Phys. Lett.89(24), 244103–3 (2006)
G. Deklunder, M. Roussel, J.-L. Lecroart, A. Prat, C. Gautier, Microemboli in cerebral circulation and alteration of cognitive abil-ities in patients with mechanical prosthetic heart valves. Stroke 29(9), 1821–1826 (1998)
V. Doyeux, T. Podgorski, S. Peponas, M. Ismail, G. Coupier, Spheres in the vicinity of a bifurcation: elucidating the Zweifach–Fung effect. J. Fluid Mech.674, 359–388 (2011)
D. C. Duffy, J. C. McDonald, O. J. Schueller, G. M. Whitesides, Rapid prototyping of microfluidic systems in poly (dimethylsiloxane), Anal. Chem.70(23), 4974–4984 (1998)
D. M. Eckmann, J. I. E. Zhang, J. Lampe, P. S. Ayyaswamy, Gas embo-lism and surfactant-based intervention. Ann. N. Y. Acad. Sci. 1077(1), 256–269 (2006)
B. Eshpuniyani, J. B. Fowlkes, J. L. Bull, A bench top experimental model of bubble transport in multiple arteriole bifurcations. Int. J. Heat Fluid Flow26(6), 865–872 (2005)
R. Fåhraeus, The suspension stability of the blood. Physiol. Rev.9(2), 241–274 (1929)
R. Fåhræus, T. Lindqvist, The viscosity of the blood in narrow capillary tubes. Am. J. Phys.96(3), 562–568 (1931)
M. Faivre, M. Abkarian, K. Bickraj, H. A. Stone, Geometrical focusing of cells in a microfluidic device: an approach to separate blood plasma. Biorheology43(2), 147–159 (2006)
V. Faustino, S. O. Catarino, R. Lima, G. Minas, Biomedical microfluidic devices by using low-cost fabrication techniques: a review. J. Biomech.49(11), 2280–2292 (2016)
L. K. Fiddes, N. Raz, S. Srigunapalan, E. Tumarkan, C. A. Simmons, A. R. Wheeler, E. Kumacheva, A circular cross-section PDMS microfluidics system for replication of cardiovascular flow condi-tions. Biomaterials31(13), 3459–3464 (2010)
P. P. Foster, B. D. Butler, Decompression to altitude: assumptions, exper-imental evidence, and future directions. J. Appl. Physiol.106(2), 678–690 (2009)
Y.-C. Fung, Stochastic flow in capillary blood vessels. Microvasc. Res. 5(1), 34–48 (1973)
V. Garcia, R. Dias, R. Lima, In vitro blood flow behaviour in microchannels with simple and complex geometries, in Applied Biological Engineering–Principles and Practice, ed. by G. R. Naik (InTech, Rijeka, 2012), pp. 393–416
T. Ishikawa, H. Fujiwara, N. Matsuki, T. Yoshimoto, Y. Imai, H. Ueno, T. Yamaguchi, Asymmetry of blood flow and cancer cell adhesion in a microchannel with symmetric bifurcation and confluence. Biomed. Microdevices13(1), 159–167 (2011)
L. L. Karlsson, S. L. Blogg, P. Lindholm, M. Gennser, T. Hemmingsson, D. Linnarsson, Venous gas emboli and exhaled nitric oxide with simulated and actual extravehicular activity. Respir. Physiol. Neurobiol.169, 315–322 (2009)
V. Leble, R. Lima, R. Dias, C. Fernandes, T. Ishikawa, Y. Imai, T. Yamaguchi, Asymmetry of red blood cell motions in a microchannel with a diverging and converging bifurcation, Biomicrofluidics5(4), 044120–15 (2011)
R. Lima, M. Nakamura, T. Omori, T. Ishikawa, S. Wada, T. Yamaguchi, Microscale flow dynamics of red blood cells in microchannels: an experimental and numerical analysis, inAdvances in Computational Vision and Medical Image Processing: Methods and Applications, ed. by T. a. Jorge (Springer, Dordrecht, 2009a), pp. 203–220 R. Lima, M. S. Oliveira, T. Ishikawa, H. Kaji, S. Tanaka, M. Nishizawa,
T. Yamaguchi, Axisymmetric polydimethysiloxane microchannels for in vitro hemodynamic studies, Biofabrication 1(3), 035005 (2009b)
N. Maeda, Erythrocyte rheology in microcirculation. The Japanese Journal of Physiology46(1), 1–14 (1996)
G. Mchedlishvili, N. Maeda, Blood flow structure related to red cell flow: determinant of blood fluidity in narrow microvessels. The Japanese Journal of Physiology51(1), 19–30 (2001)
E. Meijering, O. Dzyubachyk, I. Smal, Methods for cell and particle tracking. Methods Enzymol.504(9), 183–200 (2012)
S. Milo, E. Rambod, C. Gutfinger, M. Gharib, Mitral mechanical heart valves:in vitrostudies of their closure, vortex and microbubble formation with possible medical implications. Eur. J. Cardiothorac. Surg.24(3), 364–370 (2003)
C. M. Muth, E. S. Shank, Gas embolism. N. Engl. J. Med.342,‘(2000) V. Papadopoulou, R. J. Eckersley, C. Balestra, T. D. Karapantsios, M.-X. Tang, A critical review of physiological bubble formation in hyper-baric decompression. Adv. Colloid Interf. Sci.191–192, 22–30 (2013)
V. Papadopoulou, M. X. Tang, C. Balestra, R. J. Eckersley, T. D. Karapantsios, Circulatory bubble dynamics: from physical to bio-logical aspects. Adv. Colloid Interf. Sci.206, 239–249 (2014) D. Pinho, T. Yaginuma, R. Lima, A microfluidic device for partial cell
separation and deformability assessment. Biochip Journal7(4), 367–374 (2013)
E. Pinto, V. Faustino, R. Rodrigues, D. Pinho, V. Garcia, J. Miranda, R. Lima, A rapid and low-cost Nonlithographic method to fabricate biomedical microdevices for blood flow analysis. Micromachines 6(1), 121–135 (2015)
E. Sollier, M. Cubizolles, Y. Fouillet, J.-L. Achard, Fast and continuous plasma extraction from whole human blood based on expanding cell-free layer devices. Biomed. Microdevices12(3), 485–497 (2010)
A. Suzuki, S. C. Armstead, D. M. Eckmann, Surfactant reduction in e m b o l i s m b u b b l e a d h e s i o n a n d e n d o t h e l i a l d a m a g e . Anesthesiology101(1), 97–103 (2004)
K. Svanes, B. W. Zweifach, Variations in small blood vessel hematocrits produced in hypothermic rats by micro-occlusion. Microvasc. Res. 1(2), 210–220 (1968)
T. Taha, Z. Cui, Hydrodynamics of slug flow inside capillaries. Chem. Eng. Sci.59(6), 1181–1190 (2004)
T. Taha, Z. F. Cui, CFD modelling of slug flow inside square capillaries. Chem. Eng. Sci.61(2), 665–675 (2006)
V. Talimi, Y. Muzychka, S. Kocabiyik, A review on numerical studies of slug flow hydrodynamics and heat transfer in microtubes and microchannels. Int. J. Multiphase Flow39, 88–104 (2012) T. Thulasidas, M. Abraham, R. Cerro, Flow patterns in liquid slugs during
bubble-train flow inside capillaries. Chem. Eng. Sci.52(17), 2947– 2962 (1997)
D. Valassis, R. Dodde, B. Esphuniyani, J. B. Fowlkes, J. Bull, Microbubble transport through a bifurcating vessel network with pulsatile flow. Biomed. Microdevices14(1), 131–143 (2012) T. Yaginuma, M. S. Oliveira, R. Lima, T. Ishikawa, T. Yamaguchi,