Full Terms & Conditions of access and use can be found at
https://www.tandfonline.com/action/journalInformation?journalCode=urqe20
Research Quarterly for Exercise and Sport
ISSN: 0270-1367 (Print) 2168-3824 (Online) Journal homepage: https://www.tandfonline.com/loi/urqe20
How Does the Adjustment of Training Task
Difficulty Level Influence Tactical Behavior in
Soccer?
João Cláudio Machado, Daniel Barreira, Israel Teoldo, Bruno Travassos, João
Bosco Júnior, João Otacílio Libardoni Dos Santos & Alcides José Scaglia
To cite this article: João Cláudio Machado, Daniel Barreira, Israel Teoldo, Bruno Travassos, João
Bosco Júnior, João Otacílio Libardoni Dos Santos & Alcides José Scaglia (2019) How Does the Adjustment of Training Task Difficulty Level Influence Tactical Behavior in Soccer?, Research Quarterly for Exercise and Sport, 90:3, 403-416, DOI: 10.1080/02701367.2019.1612511
To link to this article: https://doi.org/10.1080/02701367.2019.1612511
Published online: 03 Jun 2019.
Submit your article to this journal
Article views: 158
View Crossmark data
How Does the Adjustment of Training Task Difficulty Level Influence Tactical
Behavior in Soccer?
João Cláudio Machado a,b, Daniel Barreira c, Israel Teoldo d, Bruno Travassos e,f, João Bosco Júniora, João Otacílio Libardoni Dos Santosa, and Alcides José Scaglia b
aFederal University of Amazonas;bState University of Campinas;cUniversity of Porto;dUniversidade Federal de Viçosa;eUniversidade da Beira Interior;fResearch Center in Sports Sciences, Health Sciences and Human Development (CIDESD)
ABSTRACT
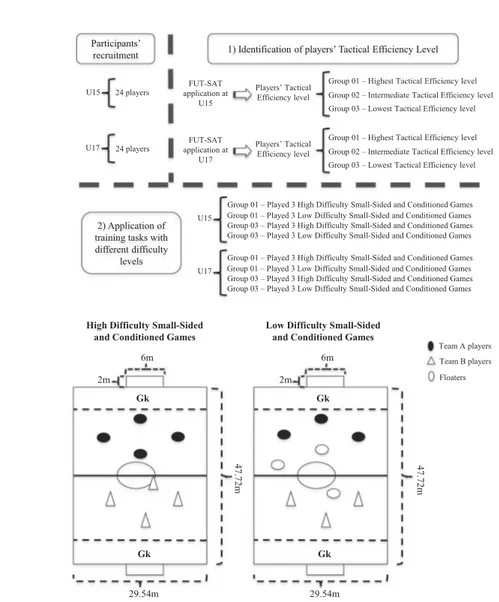
Purpose: This study aimed to investigate if player tactical skill level and age category influence team performance and player exploratory behavior in tasks with different difficulty levels. Method: In total, 48 youth male soccer players participated in the study (U15, n = 24, mean age = 13.06 ± 1.53 years; U17, n = 24, mean age = 16.89 ± 0.11 years). Player tactical skills were evaluated through the System of Tactical Assessment in Soccer (FUT-SAT), allowing them to be organized into three groups according to tactical efficiency: Higher tactical skill level (Group 01), Intermediate tactical skill level (Group 02), and Lower tactical skill level (Group 03). Next, Group 01 and Group 03 of both categories performed six Small-Sided and Conditioned Games (SSCG) each, namely three High difficulty SSCGs and three Low difficulty SSCGs. Team performance and players’ exploratory behavior were analyzed through the Offensive Sequences Characterization System and Lag Sequential Analysis, respectively. Results: We found that team performance and players’ exploratory behavior were influenced both by the age and tactical skill level of the players, as well as by task difficulty level. Conclusion: Therefore, in an attempt to improve player performance, practitioners must carefully manipulate key task constraints to adapt training task difficulty levels to player age and tactical skill level.
ARTICLE HISTORY Received 6 November 2018 Accepted 23 April 2019 KEYWORDS
Nonlinear pedagogy; task design; skills level; tactical behavior
In recent years, Nonlinear Pedagogy (NP) has emerged as an important pedagogical approach for learning in sports settings, since it explores the non-linear nature of behavior and the adaptive process to competitive environments (Chow, Davids, Button, & Renshaw, 2016; Chow et al., 2007; Chow, Davids, Hristovski, Araújo, & Passos, 2011). In NP, adaptive behaviors emerge from interacting of individual, environment and task constraints, highlighting the importance of an individualized practice (player-centered), even in team sports settings (Chow et al.,
2016). Therefore, NP supports practitioners with principles to design structured and individualized practices through representative training tasks (i.e., exercises that seek to intentionally simulate competi-tive contexts that enable players to become attuned to key sources of information that guide their deci-sions and actions in training contexts) in an attempt to enhance learning in the context of soccer (Chow et al., 2016; Travassos, Duarte, Vilar, Davids, & Araújo,2012)
In soccer, Small-Sided and Conditioned Games (SSCG) are considered representative training tasks, since they are modified versions of the formal match, maintaining the key sources of information that sup-port player decision-making and promoting similar collective behaviors to the formal match (Ometto et al., 2018; Pinder, Davids, Renshaw, & Araújo, 2011; Travassos, Duarte, et al., 2012). Evidence obtained in SSCG studies provides important information regard-ing how player and team performance is affected by the manipulation of key task constraints (Ometto et al.,
2018; Serra-Olivares & Garcia-Rubio, 2017). However, player age and skill level also affect team performance in SSCGs. Regarding the influence of player age, pre-vious research has revealed that teams composed of older players demonstrated better use of game space, presenting higher team dispersion, and offered greater regularity in their collective tactical behavior (Folgado, Lemmink, Frencken, & Sampaio, 2014; Olthof, Frencken, & Lemmink, 2015; Travassos, Coutinho, Gonçalves, Pedroso, & Sampaio, 2018). Moreover,
CONTACTJoão Cláudio Machado [email protected] Human Performance Laboratory (LEDEHU), Faculty of Physical Education and
Physiotherapy, Federal University of Amazonas, General Rodrigo Otávio Jordão Ramos Avenue, n.6.200 - Campus Universitário - SETOR SUL, 69.080-900, Manaus, Amazonas, Brazil.
2019, VOL. 90, NO. 3, 403–416
https://doi.org/10.1080/02701367.2019.1612511
there is also important evidence that highlights how players with different skill levels tend to behave differ-ently when the same key task constraints are manipu-lated in SSCGs (Almeida, Ferreira, & Volossovitch,
2013; Dellal, Hill-Haas, Lago-Peñas, & Chamari,2011; Silva et al.,2014).
In this perspective, a player’s capacity to explore key informational constraints and adjust their behavior to each game setting is individualized according to the individual player’s capabilities. Players perceive the game environment in terms of possibilities of actions (affordances) in an attempt to achieve specific task goals (e.g., recover ball possession and create/close spaces, etc.; see Fajen, Riley, & Turvey, 2009). That is, the identification of affordances over the game is highly constrained by player’s perceptual attunement to key informational constraints (i.e., capability to identify the most informative variables that support goals’ achieve-ment) and to calibration to perform (i.e., capability to adjust the actions to the requirements of environment according to the purpose goals; see Fajen et al., 2009). Therefore, a possibility of action for a given individual may not be the same for another (Travassos, Araújo, et al., 2012). This has important implications for the design of practice tasks that ensure good transfer to the competitive context. Therefore, in an attempt to improve players learning, as well as maintain key sources of information in practice scenarios that ensure the func-tional coupling between perception and action processes, practitioners must have knowledge and respect the intrinsic dynamics of players (i.e., current predisposition to achieve a task), which is shaped by age, experience, and skill level (Renshaw & Chow, 2019; Travassos, Araújo, et al.,2012).
Therefore, it is crucial that task difficulty and com-plexity levels are appropriate for player skill level. Travassos (2014) supports that the task difficulty level (d = (number of opponents in the task/number of action possibilities of player with ball possession) x 100) refers to the amount of free possibilities for action that each player can explore during tasks (e.g., in a 1v1 plus one small goal the ball carrier can dribble the opponent or shoot at goal). Thus, in this case, there is one free option (shoot, dribble) in relation to the number of opponents (1) (i.e., d = (1/2*100) = 50%). In comparison with the previous example, in a 2v1 plus one small goal, the difficulty of the task decreases due to the increase in the number of possibilities that the ball carrier can explore (shoot, dribble, or pass to the teammate) in relation to the number of opponents (1) (i.e., d = (1/3*100) = 33%). Regarding task complexity level, this can be better understood from the volume of information that players need to pick up from the
environment to support their actions and decisions, which can be generated by the number of players, number of goals, or number of rules of practice tasks (e.g., the level of complexity of the exercise increases with an increase in the number of players or an increase in the number of target goals or even with the definition of corridors or sectors on the field; see Garganta, Guilherme, Barreira, Brito, & Rebelo, 2013; Travassos, 2014). It is important to state that the increase in complexity does not necessarily correspond to an increase in the level of difficulty and vice-versa (Travassos,2014).
However, there is still a lack of information that highlights how practitioners should better manage task difficulty and complexity levels, considering player age and skill level, as well as information related to which pedagogical strategies can be used to effectively apply a player-centered and game-based teaching and training approach (i.e., which respect the differences related to the intrinsic dynamics of players and that allow them to experience a representative and mean-ingful learning environment). In this perspective, this study aimed to investigate if players‘ tactical skills level and age category influence team performance and players exploratory behavior in tasks with different difficulty levels. With this information, we can provide pedagogical strategies that might guide the design pro-cess of representative training tasks in soccer, in an attempt to enhance tactical learning.
Methods
Participants
Forty-eight non-elite youth male soccer players (U15, n = 24, mean age = 13.06 ± 1.53 years; U17, n = 24, mean age = 16.89 ± 0.11 years) were included. Participants were recruited from a sports initiation program and had never previously participated in a systematic training process. A brief explanation of the study procedures was provided, and only the players whose parents signed the free and informed consent, previously approved by the Ethics Committee
in Research with Human Beings (N.
73222617.0.0000.5404), participated. All the procedures of this research were in accordance with the Resolution of the National Health Council (466/2012) and the Declaration of Helsinki (2013).
Experimental design
The research experimental design comprises two sequential stages: (a) identification of players skills
level; and (b) evaluation of team performance and players exploratory behavior in SSCGs with different difficulty levels.
Identification of player tactical skill level
The System of Tactical Assessment in Soccer (FUT-SAT), validated by Costa, Garganta, Greco, Mesquita, and Maia (2011), was used to identify players tactical skill level. The 24 players in both categories played Gk +3vs3+ Gk Small-Sided Games, on a pitch 36 m in length by 27 m in width, for 4 min. This system allows the assessment of player tactical actions with and with-out ball possession, based on 10 core tactical principles: (a) offensive: penetration, offensive cover, depth mobi-lity, width and length, and offensive unity; (b) defen-sive: delay, defensive cover, balance, concentration, and defensive unity (Costa, Garganta, Greco, & Mesquita,
2009). The games were conducted in accordance with Fédération Internationale de Football Association (FIFA) official rules, with the exception of the offside rule. Players wore vests and shorts with distinctive colors and numbers in order to facilitate their subse-quent identification in the video analysis. The test was preceded by a 10-min standardized warm-up.
FUT-SAT comprises three important procedures: (a) observation unit identification, i.e., when a player made at least three consecutive contacts with the ball, or made a positive pass (enables the team to keep ball possession), or when the player shoots to the oppo-nents’ goalpost; (b) next, we evaluated and classified the actions of each player in relation to the core tactical principle performed, the place, and the outcome of the action; (c) the calculation of FUT-SAT variables, such as Tactical efficiency level (TEL), was performed in an Excel for Windows® spreadsheet created specifically for these reasons (for more details, please see Costa et al.,
2011). In this perspective, TEL was used as an indicator of player tactical skill level, calculated by the ratio between the percentage of success and the total number of tactical actions performed by each player, expressed in the following equation:
After completion of these procedures, the 24 players in each category were ranked according to their tactical efficiency level: Group 01 – Higher tactical skill level: composed of the eight players with the best results in the test; Group 02 – Intermediate tactical skill level: composed of the players ranked from the ninth to sixteenth position; and Group 03– Lower tactical skill level: composed of the last eight players who presented the lowest results. In an attempt to confirm the differ-ences between the groups regarding their TELs, a one-way ANOVA test was applied. The results showed that
all groups presented statistically significant differences regarding their tactical efficiency level (p < .05).
The FUT-SAT analysis was performed by trained evaluators and the test–retest design was used to observe the reliability of the analysis, respecting a 3-week interval between evaluations in an attempt to avoid task familiarity issues. The analysis of 11% of the overall sample (369 actions) was used for reliability issues, a greater value than the percentage (10%) sug-gested by Tabachnick and Fidell (2012). Cohen’s Kappa
test was used to calculate the coefficient of reliability (Robinson & O’Donoghue, 2007). The intra-observer reliability presented values between 0.846 and 0.900, and the inter-observer reliability presented values between 0.810 and 0.876.
Small-sided and conditioned games with different difficulty levels
Two different training tasks (Small-Sided and Conditioned Games (SSCG)) were performed in Groups 01 and 03, for both age categories: (a) High difficulty Small-Sided and Conditioned Games (HD-SSCG); and (b) Low difficulty Small-Sided and Conditioned Games (LD-SSCG). To calculate the task difficulty level, the index proposed by Travassos (2014) was used, which considers the relation between the number of opponents in the task and the number of action possibilities of the player with ball possession (i.e., keep the ball, shot at each opponents’ goal, and pass the ball to each teammate):
Teams of both groups (Group 01 and Group 03), in both age categories (U15 and U17), played six SSCGs each, namely three HD-SSCGs and three LD-SSCGs. To minimize the influence of player tactical skill level on team performance, the teams were composed of the same players in all games, grouped within the same group. The HD-SSCGs were performed in a Gk+4vs4 + Gk configuration, which presented an 83.33% diffi-culty level (the ball carrier could pass the ball to three teammates + the goalkeeper, dribble or shoot at goal/ four field opponents + the opponent goalkeeper; see Travassos, 2014). Regarding the LD-SSCGs, a Gk +3vs3+ Gk+3 floaters (players who support both teams in the offensive phase) configuration was used, present-ing a 50% difficulty level (the ball carrier could pass the ball to two teammates + the goalkeeper + 3 floaters, dribble or shoot at goal/three field opponents + the opponent goalkeeper). In the LD-SSCGs, players grouped in Group 02 (i.e., who presented an intermedi-ate result in the FUT-SAT analysis) were selected to play as inside floaters (inside playing area). To mini-mize the effect of floaters on team performance of both groups (Group 01 and Group 03), the top three ranked
players in Group 2 were selected as inside floaters (i.e., 9th, 10th, and 11th positions) and these players parti-cipated in both the LD-SSCGs played by Group 01 and those played by Group 03.
Both training tasks (HD-SSCG and LD-SSCG) were performed on the same pitch dimensions (47.72 m x 29.54 m; see Figure 1). The order of games in each training session was randomized and all games had a 10-min duration interspersed by a 10-min interval between them (activity/recovery ratio of 1:1). All offi-cial soccer rules, stated by FIFA, were used in both games, with the exception of the offside rule. A 10-min standardized warm-up was performed at the beginning of each training session.
Analysis of team tactical performance and players’ exploratory behavior
Tactical performance and exploratory behavior were analyzed through the Offensive Sequences
Characterization System (OSCS; see Almeida et al.,
2013; Almeida, Ferreira, & Volossovitch, 2012) and Lag Sequential Analysis technique (LSA; see McComas et al.,2009), respectively. All analyses were conducted by two trained evaluators and reliability data are shown below.
Offensive sequences characterization system (OSCS)
Proposed by Almeida et al. (2013); (2012), the OSCS was used to characterize the offensive sequences performed by teams during the proposed games, namely HD-SSCG and LD-SSCG. The OSCS method is composed of the following simple and composite performance indicators: duration of ball possession; number of players involved (i.e., players who effectively participated in the offensive sequence through ball touches); number of ball touches (i.e., the overall of ball touches made by all the players involved in the offensive sequence); number of passes (i.e., the overall of positive passes performed by all the players in the offensive sequence); number of shots (i.e.,
Participants’ recruitment
U15 24 players
U17 24 players
1) Identification of players’ Tactical Efficiency Level
FUT-SAT application at
U15
Players’ Tactical Efficiency level
Group 01 – Highest Tactical Efficiency level Group 02 – Intermediate Tactical Efficiency level Group 03 – Lowest Tactical Efficiency level
FUT-SAT application at
U17
Players’ Tactical Efficiency level
Group 01 – Highest Tactical Efficiency level Group 02 – Intermediate Tactical Efficiency level Group 03 – Lowest Tactical Efficiency level
2) Application of training tasks with different difficulty
levels
U15
Group 01 – Played 3 High Difficulty Small-Sided and Conditioned Games Group 01 – Played 3 Low Difficulty Small-Sided and Conditioned Games Group 03 – Played 3 High Difficulty Small-Sided and Conditioned Games Group 03 – Played 3 Low Difficulty Small-Sided and Conditioned Games
U17
Group 01 – Played 3 High Difficulty Small-Sided and Conditioned Games Group 01 – Played 3 Low Difficulty Small-Sided and Conditioned Games Group 03 – Played 3 High Difficulty Small-Sided and Conditioned Games Group 03 – Played 3 Low Difficulty Small-Sided and Conditioned Games
High Difficulty Small-Sided and Conditioned Games
Low Difficulty Small-Sided and Conditioned Games
Gk Gk 47.72m 6m 2m 29.54m Gk Gk 47.72m 6m 2m 29.54m Team A players Team B players Floaters
the overall shooting to opponent’s goalpost performed in the offensive sequence); players involved/duration of ball possession; ball touches/duration of ball possession; passes/duration of ball possession; ball touches/players involved; passes/players involved; passes/ball touches; and goal/shots.
Regarding the performance indicators of OSCS, we used the Spearman’s Correlation Coefficient to evaluate data reliability. Subsequently, 68 offensive sequences (10% of overall sequences analyzed) were analyzed. The intra-observer reliability presented values between 0.83 and 0.89, and the inter-observer reliability pre-sented values between 0.78 and 0.85.
Finding team offensive patterns of play using lag sequential analysis (LSA)
LSA was used to identify the offensive patterns of play performed by teams and players throughout the matches (Anguera, 1997). In this study, LSA was applied to establish the degree of action variability that emerges in the game, taking into consideration the completed pass criterion (i.e., passes that enable the team to maintain ball possession), such as: (a) Criteria 02: Positive short passing (DTpsp) and Positive long passing (DTplp); and (b) Criteria 03: Positive short passing (DPpsp) and Positive long pas-sing (DPplp). Since exploratory behavior might be defined as the subsequent realization of a higher num-ber of movement configurations under specific perfor-mer-environment system constraints (Torrents et al.,
2016), LSA was used to observe the players’ capacity
to demonstrate different degrees of variability through passing sequences (namely before and after passing), thus exploring available behavioral modes.
Player action criteria of the SoccerEye observational instrument (Barreira, Garganta, Prudente, & Anguera,
2012) were used to analyze passing offensive patterns, combining field formats with a system of categories (Table 1), namely: (1) Start of the offensive phase/ball recovery (BR); (2) Development of defense/attack tran-sition-state (DT); (3) Progress of Ball Possession (DP); (4) End of the Offensive Phase (F).
For reliability issues, both evaluators analyzed the first 45 min of the 2010 FIFA World Cup final (Spain vs Netherlands) at two different moments, with a 3-week interval. The training of the evaluators was performed using this specific game in an attempt to compare their analysis with a gold standard (analysis performed by SoccerEye’s developer). Thus, the Cohen’s Kappa Index (Cohen,1960) was used to eval-uate the intra and inter-observers reliability of SoccerEye categories. The following values were found: (a) intra-observers: 0.90 < k < 0.95; (b)
inter-observers: 0.87 < k < 0.92. SDIS-GSEQ (version 5.1, 2011) software was used to analyze data reliability.
Statistical analysis
The Kolmogorov–Smirnov and Box’s M tests were used to verify data normality and the homogeneity of covar-iance matrices, respectively, of the simple and compo-site performance indicators included in OSCS. Mean and standard deviation were used for all simple and composite performance indicators. Since normality assumption was rejected, we opted to analyze each independent variable independently, disregarding the interactions between them. Therefore, Mann–Whitney test was used to identify the main differences between age categories (U15 vs U17), groups of players with different tactical skill level (Group 01 vs Group 03) and games with different difficulty levels (HD-SSCG vs LD-SSCG). Also, we used Cohen’s d to identify the effect size (ES), reported as: negligible effect (≥ −0.15 and <.15); small effect (≥.15 and <.40); medium effect (≥.40 and <.75); large effect (≥.75 and <1.10); very large effect (≥1.10 and <1.45); and huge effect (>1.45; see Thalheimer & Cook, 2002). Statistical analysis was performed with the SPSS 20.0 software.
To analyze team passing offensive patterns, we assumed as a given conduct each of the SoccerEye categories of passing (i.e., DTpsp, DTplp, DPpsp, and DPplp; see Table 1). Through LSA, we counted the times that a certain conduct (i.e., target conduct) suc-ceeded and preceded passing actions. Thus, retrospec-tive (Lag −1) and prospective (Lag +1 and Lag +2) analysis were applied to determine the diachronic asso-ciations between the pass and the other conducts, in which a higher z-value means stronger associations between the events (z = 2.58; p < .01). SDIS-GSEQ (version 5.1, 2011; see Bakeman & Quera, 1995) soft-ware was used to perform Lag Sequential Analysis.
Results
Differences between groups of players with different tactical skill levels
InTable 2it is possible to observe all p values regarding the comparisons of performance indicators between groups of players with different tactical skill levels. We found that U15 Group 01 presented better offensive efficacy (Goal/Shots) than Group 03 in the LD-SSCGs (p = .036 and ES = 0.32– small effect). Moreover, U17 Group 01 showed higher attacking dynamics (Passes/Ball touches) than Group 03 in the HD-SSCGs (p = .010 and ES = 1.13 – very large effect). However, U17 Group 03
presented a higher rhythm of intervention on the ball (Ball touches/Duration– p = .041 and ES = 0.20 – small effect) and of individual intervention on the ball (p = .033 and ES = 0.26 – small effect), probably related to the higher difficulty level of the proposed task.
Differences between age categories
In Table 3, all p values regarding the comparisons of performance indicators between age categories are shown. In the LD-SSCGs, U17 players of Group 01 presented more individual intervention on the ball (Ball touches/Players involved) than U15 players (p = .015 and ES = 0.40– medium effect), while U15 teams presented higher offensive dynamics in comparison to U17 teams (p = .032 and ES = 0.29 – small effect). Moreover, U17 Group 03 presented more shots per-formed than U15 (p = .002 and ES = 0.50 – medium effect). In turn, in the HD-SSCGs, U17 Group 01 pre-sented a higher number of players involved (p < .001 and ES = 0.57– medium effect), ball touches (p = .006 and ES = 0.39– small effect), and passes performed (p = .002 and ES = 0.45– medium effect) than U15. It was also possible to observe that U17 Group 01 presented a higher rhythm of intervention on the ball (p = .042 and ES = 0.31 – small effect) and rhythm of passes performed (p = .035 and ES = 0.16– small effect) than U15. We also found that U17 Group 03 performed more ball touches (p = .024 and ES = 0.20– small effect) and shots (p = .014 and ES = 0.40 – medium effect) in relation to U15 players, as well as a higher rhythm of
intervention on the ball (p < .001 and ES = 56– medium effect) and individual intervention on the ball (p = .020 and ES = 0.30 – small effect). However, U15 Group 03 presented higher offensive dynamics than U17 (p = .012 and ES = 0.34– small effect).
Differences between small-sided and conditioned games
In Table 4, all p values regarding the comparisons of performance indicators between SSCGs are shown. It was possible to observe that the LD-SSCG, the game that includes three floaters, enabled a greater number of players involved in the attacks in all categories and groups (Group 01 of U15– p < .001 and ES = 0.84 – large effect; Group 03 of U15 – p = .001 and ES = 0.57 – medium effect; Group 01 of U17 – p = .039 and ES = 0.41 – medium effect; and Group 03 of U17– p < .001 and ES = 0.68– medium effect). U15 Group 01 teams presented more ball touches in offensive sequences in the LD-SSCG (p = .003 and ES = 0.40– medium effect), as well as more passes (p = .002 and ES = 0.52– medium effect) and shots performed (p = .001 and ES = 0.54– medium effect). It was also possible to observe that U15 Group 01 showed a higher rhythm of intervention on the ball (p = .013 and ES = 0.38– small effect) and passes completed (p = .011 and ES = 0.35– small effect) in the LD-SSCG, as well as superior offensive efficacy (p = .042 and ES = 0.27– small effect). We also observed that U15 Group 03 presented more ball touches in the LD-SSCG (p = .050 and ES = 0.23– small effect), as well as a higher rhythm of
Table 1.Players actions categories of SoccerEye observational instrument (Barreira et al.,2012).
Criteria Sub-criteria
N°
categories Categories
1. Start of offensive phase/ball recovery (BR)
1.1 Direct/ Dynamic ball recovery
4 BRi: Interception; BRt: Tackle; BRgk: Intervention of the goalkeeper in the defensive
phase; BRp: Defensive behavior followed by a pass; 1.2 Indirect/Static
ball recovery
6 BRst: Start/restart of the offensive phase; BRv: Opponent’s violation of the laws of the
game; BRc: Corner kick; BRgki: Goal kick; BRdb: Dropped ball; BRti: Throw-in 2. Development of defence/
attack transition-state (DT)
14 DTpsp: Positive short passing; DTnsp: Negative short passing; DTplp: Positive long
passing; DTnlp: Negative Long Passing; DTpcr: Positive Crossing; DTncr: Negative Crossing; DTrb: Running with the ball; DTd: Dribbling (1x1); DTbc: Ball control; DTdu:
Duel; DTs: Shooting; DTns: Opponent’s intervention with no Success; DTogk:
Intervention of the goalkeeper in the offensive phase; DTdgk: Intervention of the goalkeeper in the defensive phase
3. Progress of Ball Possession (DP)
19 DPpsp: Positive Short passing; DPnsp: Negative short passing; DPplp: Positive Long
Passing; DPnlp: Negative Long Passing; DPpcr: Positive Crossing; DPncr: Negative Crossing; DPrb: Running with the ball; DPd: Dribbling (1x1); DPbc: Ball control: DPdu:
Duel; DPs: Shooting; DPns: Opponent’s intervention with no success; DPogk:
Intervention of the goalkeeper in the offensive phase; DPdgk: Intervention of the goalkeeper in the defensive phase; DPi: Violation of the laws of the game; DPc: Corner kick; DPgki: Goal kick; DPdb: Dropped Ball; DPti: Throw-in
4. End of Offensive Phase (F) 4.1
With Efficacy
4 Fws: Wide shot; Fst: Shot on target; Fso: Shot stopped, with no continuation of ball
possession; Fgl: Goal 4.2 With no
Efficacy
4 Fled: Loss of ball possession by error of the ball carrier/defender’s intervention; Fgk:
Loss of ball possession by intervention of the opponent’s goalkeeper; Fo: Throwing the
Table 2. Differences between group of players with Higher tactical skill level (Group 01) and Lower tactical skill level (Group 03) in High difficulty Small-Sided and Conditioned Games (HD-SSCG) and in Low difficulty Small-Sided and Conditioned Games (LD-SSCG). U15 U17 HD-SSCG LD-SSCG HD-SSCG LD-SSCG Performance Indicators Group 01 Group 03 p ES Group 01 Group 03 p ES Group 01 Group 03 p ES Group 01 Group 03 p ES Duration of Ball Possession (s) 14.58(12.05) 16.60(13.23) .229 .17 b 16.36(12.44) 16.29(10.11) .476 .01 a 16.38(13.07) 15.32(10.17) .981 .09 a 19.27(15.35) 19.42(14.30) .678 .01 a Players Involved 2.34(1.10) 2.68(1.08) .066 .31 b 3.40(1.43) 3.34(1.25) .956 .05 a 2.98(1.14) 2.90(1.16) .666 .07 a 3.54(1.65) 3.80(1.53) .268 .16 b Ball Touches 7.34(5.73) 8.54(6.34) .193 .20 b 9.95(7.34) 9.83(5.14) .443 .02 a 9.74(6.82) 10.15(8.82) .484 .05 a 12.02(8.59) 12.09(7.77) .704 .01 a Passes 2.39(1.91) 3.04(2.41) .076 .30 b 3.56(2.64) 3.59(2.33) .570 .01 a 3.37(2.39) 3.09(2.09) .425 .13 a 3.86(2.87) 4.18(2.93) .514 .11 a Shots 0.30(0.53) 0.27(0.47) .829 .06 a 0.64(0.73) 0.47(0.67) .095 .24 b 0.45(0.61) 0.51(0.67) .589 .09 a 0.68(0.80) 0.86(0.89) .156 .21 b Players Involved/Duration 0.23(0.14) 0.23(0.15) .857 .00 a 0.27(0.16) 0.24(0.10) .393 .23 b 0.25(0.15) 0.22(0.90) .602 .05 a 0.26(0.33) 0.25(0.14) .336 .04 a Ball Touches/Duration 0.58(0.25) 0.58(0.25) .933 .00 a 0.67(0.23) 0.65(0.20) .865 .09 a 0.66(0.27) 0.71(0.22) .041* .20 b 0.79(1.70) 0.68(0.22) .703 .09 a Passes/Duration 0.20(0.15) 0.19(0.10) .781 .08 a 0.25(0.14) 0.23(0.10) .775 .17 b 0.22(0.10) 0.21(0.10) .327 .01 a 0.24(0.33) 0.24(0.13) .115 .00 a Ball Touches/Players Involved 3.02(1.53) 3.06(1.62) .960 .03 a 2.83(1.27) 2.98(1.26) .465 .12 a 3.14(1.65) 3.53(1.54) .033* .25 b 3.36(1.41) 3.05(1.18) .270 .24 b Passes/Players Involved 0.95(0.54) 1.02(0.56) .498 .13 a 0.98(0.39) 1.02(0.49) .698 .09 a 1.03(0.52) 0.99(0.47) .509 .08 a 0.97(0.43) 1.00(0.41) .736 .07 a Passes/Ball Touches 0.38(0.26) 0.39(0.25) .600 .04 a 0.38(0.17) 0.37(0.17) .809 .06 a 0.37(0.19) 0.32(0.17) .010* 1.13 e 0.33(0.18) 0.36(0.17) .192 .17 b Goal/Shots 0.10(0.30) 0.11(0.32) .848 .03 a 0.19(0.38) 0.10(0.27) .036* .28 b 0.14(0.35) 0.11(0.30) .711 .09 a 0.15(0.35) 0.12(0.32) .485 .09 a Offensive Sequences (Total) 86 70 -74 78 -99 108 -79 81 -* Significant effects (p ≤ 0.05); aNegligible effect; bSmall effect; eVery large effect. Table 3. Differences between age categories in the High difficulty Small-Sided and Conditioned Games (HD-SSCG) and in the Low difficulty Small-Sided and Conditioned Games (LD-SSCG). Higher tactical skill level Lower tactical skill level HD-SSCG LD-SSCG HD-SSCG LD-SSCG Performance Indicators U15 U17 p ES U15 U17 p ES U15 U17 p ES U15 U17 p ES Duration of Ball Possession (s) 14.58(12.05) 16.38(13.07) .165 .14 a 16.36(12.44) 19.27(15.35) .383 .21 b 16.60(13.23) 15.32(10.17) .950 .11 a 16.29(10.11) 19.42(14.30) .412 .25 b Players Involved 2.34(1.10) 2.98(1.14) .000* .57 c 3.40(1.43) 3.54(1.65) .745 .09 a 2.68(1.08) 2.90(1.16) .234 .20 b 3.34(1.25) 3.80(1.53) .090 .33 b Ball Touches 7.34(5.73) 9.74(6.82) .006* .38 b 9.95(7.34) 12.02(8.59) .148 .26 b 8.54(6.34) 10.15(8.82) .024* .20 b 9.83(5.14) 12.09(7.77) .206 .34 b Passes 2.39(1.91) 3.37(2.39) .002* .45 c 3.56(2.64) 3.86(2.87) .536 .11 a 3.04(2.41) 3.09(2.09) .671 .02 a 3.59(2.33) 4.18(2.93) .379 .22 b Shots 0.30(0.53) 0.45(0.61) .059 .26 b 0.64(0.73) 0.68(0.80) .916 .05 a 0.27(0.47) 0.51(0.67) .014* .40 c 0.47(0.67) 0.86(0.89) .002* .50 c Players Involved/Duration 0.23(0.14) 0.25(0.15) .425 .14 a 0.27(0.16) 0.26(0.33) .056 .04 a 0.23(0.15) 0.22(0.90) .465 .01 a 0.24(0.10) 0.25(0.14) .988 .08 a Ball Touches/Duration 0.58(0.25) 0.66(0.27) .042* .31 b 0.67(0.23) 0.79(1.70) .544 .10 a 0.58(0.25) 0.71(0.22) .000* .56 c 0.65(0.20) 0.68(0.22) .191 .14 a Passes/Duration 0.20(0.15) 0.22(0.10) .035* .16 b 0.25(0.14) 0.24(0.33) .088 .04 a 0.19(0.10) 0.21(0.10) .316 .20 b 0.23(0.10) 0.24(0.13) .885 .09 a Ball Touches/Players Involved 3.02(1.53) 3.14(1.65) .736 .08 a 2.83(1.27) 3.36(1.41) .015* .40 c 3.06(1.62) 3.53(1.54) .020* .30 b 2.98(1.26) 3.05(1.18) .435 .06 a Passes/Players Involved 0.95(0.54) 1.03(0.52) .321 .15 b 0.98(0.39) 0.97(0.43) .865 .02 a 1.02(0.56) 0.99(0.47) .691 .06 a 1.02(0.49) 1.00(0.41) .888 .04 a Passes/Ball Touches 0.38(0.26) 0.37(0.19) .490 .04 a 0.38(0.17) 0.33(0.18) .032* .29 b 0.39(0.25) 0.32(0.17) .012* .34 b 0.37(0.17) 0.36(0.17) .799 .06 a Goal/Shots 0.10(0.30) 0.14(0.35) .357 .12 a 0.19(0.38) 0.15(0.35) .431 .11 a 0.11(0.32) 0.11(0.30) .709 .00 a 0.10(0.27) 0.12(0.32) .508 .07 a Offensive Sequences (Total) 86 99 -74 79 -70 108 -78 81 -* Significant effects (p ≤ 0.05); aNegligible effect; bSmall effect; cMedium effect.
intervention on the ball (p = .009 and ES = 0.31– small effect), and of passes completed (p = .045 and ES = 0.40– medium effect). U17 Group 01 presented higher offensive dynamics in the HD-SSCG (p = .036 and ES = 0.22– small effect), and U17 Group 03 performed more passes (p = .016 and ES = 0.44– medium effect) and shots (p = .004 and ES = 0.46– medium effect) in the LD-SSCG.
Analysis of players’ exploratory behavior
In order to analyze exploratory behavior (i.e., player capacity to explore different movement configurations), LSA was applied to identify the variability of player actions related to passes completed (Table 5). In the lag −1 column, i.e., actions that occurred before the pass, we can observe the conducts (target conduct col-umn) that induce the emergence of passing actions, while the Lag +1 and Lag+2 columns identify the actions that succeed completed passes. Using this tech-nique, it is possible to highlight the Small-Sided and Conditioned Games (HD-SSCG and LD-SSCG) that stimulate the emergence of a higher variability of actions in different groups (Group 01 and Group 03) and age categories (U17 and U15).
Regarding the differences between groups of players with different tactical skill levels (Group 01 and Group 03), we found that the HD-SSCG stimu-lated the emergence of a higher number of actions performed by U15 Group 01 at Lag +2. After ball control actions (Lag +1 in both Groups), we also found a high probability of the occurrence of crossing (DPpcr: z = 4.14 and p < .001), running with the ball (DTrb: z = 3.61 and p < .001), and shot (DPs: z = 2.78 and p < .001) actions in teams composed of players with higher tactical skill levels in the HD-SSCG. In games with lower difficulty levels, U15 Group 01 presented a higher number of actions per-formed than U15 Group 03, mainly at Lag −1 (beha-viors that precede passes completed) and Lag +1 (behaviors that succeed passes completed). In the U17 age category, players with a higher tactical skill levels demonstrated a higher capacity to solve game problems in the LD-SSCG, since this task stimulated the emergence of a higher number of actions.
We also observed interesting differences between age categories. In general, U17 players explored a higher number of action possibilities through passing sequences in both tasks (HD-SSCG and LD-SSCG). In addition, U17 players of both groups seemed to adapt better to tactical constraints promoted by tasks with higher difficulty level (HD-SSCG), since we observed at Lag +1 that those players were able to perform first-pass exchanges more frequently (Group 01: z = .278
Table 4. Differences between team performance in the High difficulty Small-Sided and Conditioned Games (HD-SSCG) and in the Low difficulty Small-Sided and Conditioned Games (LD-SSCG). Performance Indicators U15 U17 Higher tactical skill level Lower tactical skill level Higher tactical skill level Lower tactical skill level HD-SSCG LD-SSCG p ES HD-SSCG LD-SSCG p ES HD-SSCG LD-SSCG p ES HD-SSCG LD-SSCG p ES Duration of Ball Possession (s) 14.58(12.05) 16.36(12.44) .135 .15 a 16.60(13.23) 16.29(10.11) .630 .03 a 16.38(13.07) 19.27(15.35) .265 .21 a 15.32(10.17) 19.42(14.30) .089 .34 b Players Involved 2.34(1.10) 3.40(1.43) .000* .84 d 2.68(1.08) 3.34(1.25) .001* .57 c 2.98(1.14) 3.54(1.65) .039* .41 c 2.90(1.16) 3.80(1.53) .000* .68 c Ball Touches 7.34(5.73) 9.95(7.34) .003* .40 c 8.54(6.34) 9.83(5.14) .050* .23 b 9.74(6.82) 12.02(8.59) .114 .30 b 10.15(8.82) 12.09(7.77) .188 .23 b Passes 2.39(1.91) 3.56(2.64) .002* .52 c 3.04(2.41) 3.59(2.33) .088 .23 b 3.37(2.39) 3.86(2.87) .399 .19 b 3.09(2.09) 4.18(2.93) .016* .44 c Shots 0.30(0.53) 0.64(0.73) .001* .54 c 0.27(0.47) 0.47(0.67) .069 .34 b 0.45(0.61) 0.68(0.80) .056 .33 b 0.51(0.67) 0.86(0.89) .004* .46 c Players Involved/Duration 0.23(0.14) 0.27(0.16) .073 .27 b 0.23(0.15) 0.24(0.10) .136 .08 a 0.25(0.15) 0.26(0.33) .631 .04 a 0.22(0.90) 0.25(0.14) .353 .04 a Ball Touches/Duration 0.58(0.25) 0.67(0.23) .013* .38 b 0.58(0.25) 0.65(0.20) .009* .31 b 0.66(0.27) 0.79(1.70) .235 .11 a 0.71(0.22) 0.68(0.22) .658 .14 a Passes/Duration 0.20(0.15) 0.25(0.14) .011* .35 b 0.19(0.10) 0.23(0.10) .045* .40 c 0.22(0.10) 0.24(0.33) .210 .09 a 0.21(0.10) 0.24(0.13) .206 .27 b Ball Touches/Players Involved 3.02(1.53) 2.83(1.27) .539 .14 a 3.06(1.62) 2.98(1.26) .942 .06 a 3.14(1.65) 3.36(1.41) .190 .14 a 3.53(1.54) 3.05(1.18) .081 .35 b Passes/Players Involved 0.95(0.54) 0.98(0.39) .811 .06 a 1.02(0.56) 1.02(0.49) .785 .00 a 1.03(0.52) 0.97(0.43) .511 .13 a 0.99(0.47) 1.00(0.41) .729 .02 a Passes/Ball Touches 0.38(0.26) 0.38(0.17) .433 .00 a 0.39(0.25) 0.37(0.17) .881 .01 a 0.37(0.19) 0.33(0.18) .036* .22 b 0.32(0.17) 0.36(0.17) .070 .24 b Goal/Shots 0.10(0.30) 0.19(0.38) .042* .27 b 0.11(0.32) 0.10(0.27) .775 .03 a 0.14(0.35) 0.15(0.35) .699 .03 a 0.11(0.30) 0.12(0.32) .996 .03 a Offensive Sequences (Total) 86 74 -70 78 -99 79 -108 81 -* Significant effects (p ≤ 0.05); aNegligible effect; bSmall effect; cMedium effect; dlarge effect.
Table 5. Teams passing offensive patterns performed by U15 and U17 categories in tasks with different difficulty levels. Higher tactical skill level Lower tactical skill level Categories Tasks with different difficulty levels Lag − 1 Lag 0 Lag +1 Lag +2 Lag − 1 Lag 0 Lag +1 Lag +2 U15 High difficulty Small-Sided and Conditioned Games DTd (z = 4.93) DTbc (z = 3.30) DPbc (z = 3.14) DTpsp DTplp DPpsp DPplp DTbc (z = 5.13) DPbc (z = 3.21) DTnsp (z = 3.21) DTrb (z = 3.61) DTns (z = 2.76) DPpcr (z = 4.15) DPs (z = 2.78) DTpsp (z = 2.98) DTrb (z = 3.27) DTbc (z = 3.36) DPbc (z = 3.60) DTpsp DTplp DPpsp DPplp DTbc (z = 6.49) DPbc (z = 4.33) DTrb (z = 3.40) DPns (2.97) Fgl (z = 2.60) Low difficulty Small-Sided and Conditioned Games DTpsp (z = 3.52) DTrb (z = 4.24) DTbc (z = 4.25) DPrb (z = 4.64) DPbc (z = 3.57) DTpsp DTplp DPpsp DPplp DTpsp (z = 3.52) DTnsp (z = 3.52) DTrb (z = 2.71) DTbc (z = 7.04) DPpsp (z = 2.44) DPbc (z = 5.19) DTpcr (z = 5.81) DTrb (z = 3.44) DTbc (z = 2.65) DPd (z = 2.67) Fws (z = 5.81) DTrb (z = 4.77) DTbc (z = 5.00) DPrb (z = 2.78) DPbc (z = 3.76) DTpsp DTplp DPpsp DPplp DTrb (z = 4.05) DTbc (z = 8.65) DTs (z = 5.67) DPpsp (z = 3.06) DPbc (z = 3.75) DTpsp (z = 4.04) DTnsp (z = 3.48) DTrb (z = 3.82) DTdgk (z = 5.57) DPplp (z = 3.82) DPd (z = 3.02) DPs (z = 2.73) DPns (z = 3.02) U17 High difficulty Small-Sided and Conditioned Games DTpsp (z = 3.84) DTrb (z = 6.5) DTd (z = 2.96) DTns (z = 2.96) DPrb (z = 2.91) DPbc (z = 4.17) DTpsp DTplp DPpsp DPplp DTpsp (z = 3.27) DTrb (z = 2.96) DTbc (z = 8.15) DTogk (z = 2.84) DPpsp (z = 2.99) DPbc (z = 4.98) DTrb (z = 3.29) DTbc (z = 3.03) DPbc (z = 2.80) DPdgk (z = 4.02) Fst (z = 3.58) Fgl (z = 2.82) DTrb (z = 5.58) DTbc (z = 4.17) DPpsp (z = 3.34) DPrb (z = 5.95) DPbc (z = 4.96) DTpsp DTplp DPpsp DPplp DTpsp (z = 2.98) DTrb (z = 3.80) DTbc (z = 8.59) DPpsp (z = 3.34) DPd (z = 6.65) DPbc (z = 7.75) DTpsp (z = 2.67) DTrb (z = 4.07) DTr (z = 4.51) DPnsp (z = 2.83) DPncr (z = 4.51) Low difficulty Small-Sided and Conditioned Games DTpsp (z = 2.78) DTrb (z = 9.18) DTogk (z = 2.78) DPrb (z = 3.04) DPd (z = 4.53) DPbc (z = 3.16) DTpsp DTplp DPpsp DPplp DTpsp (z = 2.78) DTnsp (z = 2.78) DTpcr (z = 2.78) DTrb (z = 5.31) DTbc (z = 7.69) DPncr (z = 4.53) DPbc (z = 5.44) Fgl (3.63) DTnsp (z = 4.94) DTplp (z = 2.84) DTbc (z = 2.84) DTdgk (z = 2.84) DPnsp (z = 2.03) DPncr (z = 3.03) DPns (z = 3.58) Fst (z = 3.15) Fgk (z = 3.58) DTpsp (z = 3.66) DTrb (z = 10.62) DTbc (z = 7.16) DPbc (z = 6.03) DTpsp DTplp DPpsp DPplp DTpsp (z = 3.66) DTrb (z = 5.22) DTbc (z = 6.36) DPpcr (z = 3.44) DPd (z = 3.44) DPbc (z = 5.45) DTpsp (z = 3.76) DTrb (z = 7.05) Fo (z = 4.95) Note. Lag − 1 = Time-event that precede passing actions; Lag +1 and Lag +2 = Time-events that succeed passing actions; DTpsp: Positive short passing; DTnsp: Negative short passing; DTplp: Positive long passing; DTpcr: Positive Crossing; DTrb: Running with the ball; DTd: Dribbling (1x1); DTbc: Ball control; DTs: Shooting; DTns: Opponent ’s intervention with no Success; DTogk: Intervention of the goalkeeper in the offensive phase; DTdgk: Intervention of the goalkeeper in the defensive phase; DPpsp: Positive Short passing; DPnsp: Negative short passing; DPplp: Positive Long Pa ssing; DPpcr: Positive Crossing; DPncr: Negative Crossing; DPrb: Running with the ball; DPd: Dribbling (1x1); DPbc: Ball control: DPs: Shooting; DPns: Opponent ’s intervention with no success; DPdgk: Intervention of the goalkeeper in the defensive phase.
and p < .001; Group 03: z = 3.66 and p < .001), and also presented a higher probability of scoring goals (Group 01: z = 2.82 and p < .001).
Regarding information about tasks with different difficulty levels, it was possible to note that the LD-SSCG stimulated higher variability of actions in U15 players (both Group 01 and Group 03). In Group 01, higher movement configurations that indicate both individual (e.g., running with the ball category – DTrb/DPrb: z = 4.24 and z = 4.64, respectively) and collective actions (e.g., passing– DTpsp: z = 3.52; and ball control – DTbc/DPbc: z = 4.25 and z = 3.57, respectively) were found at Lag −1 in the LD-SSCG. The presence of conducts such as ball control (DTbc/ DPbc) and running with the ball (DTrb/DPrb) at both Lag+1 and Lag-1, as well as the absence of behaviors that indicate passing actions (DTpsp/DTplp or DP/ psp/DPplp), might also indicate that these players presented greater difficulty in adopting a more collec-tive game in these conditions.“Positive short passing” conducts were also found at Lag +1 in both Groups (Group 01 and Group 03) in the LD-SSCG (Group 01: DTpsp/DPpsp– z = 3.52 and 2.44, respectively; Group 03: DPpsp– z = 3.06), indicating that teams were able to exchange first-passes more frequently than in the HD-SSCG. Regarding the U17 age category, it was possible to note that tasks with a high difficulty level do not seem to inhibit player exploratory behavior, since players presented a higher number of emerging actions.
Discussion
The present research aimed to investigate if player tac-tical skill levels and age influence team tactac-tical perfor-mance and player exploratory behavior in tasks with different difficulty levels. Through the results obtained in the present study, we highlight that practitioners must consider age category, player tactical skill level, and task difficulty level for representative training task design, in an attempt to promote a player-centered and game-based approach. Thus, in order to better understand the practical implications of this research, namely related to the design of representative training tasks and training session organization based on the differences between player tactical skill levels and age, we have organized the discussion into two main topics: (a) Differences between age categories and groups composed of players with different tactical skill levels; (b) Differences between training tasks with different difficulty levels.
Differences between age categories and groups composed of players with different tactical skill levels
U15 Group 01 presented a superior attacking efficacy in comparison to Group 03 in the LD-SSCG, showing that teams composed of players with a higher tactical skill level achieved task goals more frequently. Moreover, U17 Group 01 presented higher offensive dynamics than Group 03 in the HD-SSCG, indicating that teams composed of players with a higher tactical skill level were able to present faster passes exchange, better deal-ing with the high task difficulty level. It was also pos-sible to observe that U17 players with a lower tactical skill level demonstrated a higher rhythm of interven-tion on the ball in the HD-SSCG, as well as higher player participation, indicating that these players pre-sented greater difficulty in dealing with task demands with a higher difficulty level. Importantly, we also found that Group 01 in both categories showed a higher variability of player actions in both tasks (HD-SSCG and LD-(HD-SSCG). Thus, players with higher tactical skill levels demonstrated a greater capacity to vary their actions throughout the different tasks, that is, higher calibration to different game contexts.
Several researchers have also found an influence of players‘ skills levels on team performance. In a recent systematic review, Aquino, Puggina, Alves, and Garganta (2017) highlighted several studies that observed the influence of competitive level on player and team performance. Thus, the results of this study corroborate with those findings, since we also found an influence of player skill level on team performance and player exploratory behavior in tasks with different dif-ficulty levels. In this perspective, Almeida et al. (2013) found that teams composed of players with more time engaged in deliberate practice demonstrated longer offensive sequences, a higher number of players involved and ball touches during the attack, as well as more passes completed, while teams composed of players with no deliberate practice experience presented faster offensive sequences and used predominantly individual actions to unbalance the opponent defensive organization. Dellal et al. (2011) observed that player competitive level influences performance in different SSCGs, both physical and technical activities, as well as physiological responses. The authors found that amateur players (playing in the fourth French division) presented a lower percentage of passes completed and a higher amount of ball possession lost than interna-tional players (professional).
Our results also corroborate the findings of Silva et al. (2014), since the authors observed that skillful players demonstrated better exploratory performance in overloaded situations, in an attempt to pressure the opponent team and create scoring opportunities. Thus, our findings are in line with previous research, since it was possible to observe that Group 01, both U15 and U17 age categories, better managed the task difficulty level presented by the HD-SSCG, since they presented higher offensive efficacy (U15 Group 01), as well as a higher rhythm of ball intervention, offensive dynamics, and more individual contribution in ball intervention (U17 Group 01). These results support the need for practitioners to carefully manipulate key task constraints in order to better adapt them to their players‘ skill levels.
Moreover, team performance and player exploratory behavior in different SSCGs were also affected by player age. In the LD-SSCG, U17 players of Group 01 inter-vened more on the ball than U15 players of Group 01 and that U17 Group 03 presented a higher number of shots performed than U15 Group 03. This information might indicate that U17 players participated actively more frequently and created more scoring opportu-nities than U15 players. In addition, U15 Group 01 presented higher offensive dynamics than U17, corro-borating the findings of Folgado et al. (2014), who observed that the youngest players presented a faster approach to the opponent’s target through length dis-persion on the field. In high difficulty tasks (HD-SSCG) , we found that the U17 Group 01 also presented a higher number of players involved, ball touches, and passes completed in offensive sequences, as well as a higher rhythm of ball circulation and ball interven-tion. Moreover, U17 Group 03 performed more shots and had greater intervention on the ball (Ball touches/ Players involved). Therefore, in general, U17 groups presented better performance than U15.
With regard to player exploratory behaviors, U17 groups presented a greater number of actions that tend to precede and succeed the passes completed, showing greater variability of actions, both individual (e.g., dribbling– DTd/DPd and running with the ball – DTrb/DPrb, etc.) and collective actions (e.g., passing– DTpsp/DPpsp, passing to team’s goalkeeper – Dtogk, etc.). In addition, it was also interesting to observe that U17 players of both groups exchanged first-passes more frequently than U15 (i.e., DTpsp/DPpsp found at Lag −1 and Lag +1) in tasks with a higher difficulty level, showing that they could better manage task difficulty level.
Several studies have also highlighted the influence of age on team and player tactical behavior. In this sense,
Folgado et al. (2014) found a significant effect for individual (age) and task constraints (number of players). The authors observed a higher distance between the teams’ centroid at Gk+3vs3+ Gk SSCGs for the oldest group, probably as a result of a more balanced distribution through the field. In addition, Olthof et al. (2015) found that the older group (U19) presented a wider dispersion through the field in order to create space and unbalance the opponent’s defensive organization.
The present study seems important to support prac-titioners to better design representative training tasks, attending to player age and skill levels. Moreover, this study aimed to investigate how player’s constraint (age and skill level) and task constraint affect team tactical performance and player exploratory behavior. However, it is also important to highlight that we sought to investigate player skill level by grouping players according to their tactical skill level, since other studies sought to determine player skill level according to the time engaged in deliberate practice (Almeida et al.,2013), or their competitive performance level (i.e., if they competed in national level or in regional level; see Silva et al., 2014), or even if they were professional or amateurs (Dellal et al., 2011).
Nevertheless, we argue that, to promote effective training session organization and task design, the iden-tification of player skill levels needs to be more precise, possibly through tactical assessment tools validated in the literature, such as FUT-SAT, GPET, or others (González-Víllora, Serra-Olivares, Pastor-Vicedo, & Costa, 2015). If practitioners have no access to these assessment tools, they can use other proposals. For example, Garganta et al. (2013) suggest that player skill level can be assessed through specific indicators, such as player relation with the ball, player identifica-tion with the goal of the game, posiidentifica-tional organizaidentifica-tion in different phases of the game, and collective dynamics. Thus, four skill levels were proposed: basic, elementary, intermediate, and specialization levels. Importantly, practitioners must consider player skill level for representative training task design, besides age, and for this they must be able to identify these levels, even through the use of a more subjective assess-ment tool.
Differences between the training tasks with different difficulty levels
In this research, we found that the index proposed by Travassos (2014) to manipulate task difficulty level seems to be effective, since we observed major differ-ences between tasks with different difficulty levels,
regardless of age category and player tactical skill levels. Thus, this could be an extremely useful tool, especially for beginner practitioners, to design representative training tasks appropriate to player age and skill level.
Thus, we found that tasks with a lower difficulty level (LD-SSCG) presented, in general, a higher number of players involved and ball touches in offensive sequences, as well as more passes and shots performed. In addition, U15 teams performed more ball touch passes and shots in the LD-SSCG, as well as a higher rhythm of intervention on the ball. They also presented a higher rhythm of ball circulation and better offensive efficacy in the LD-SSCG. Players with a lower tactical skill level (Group 03) also performed more ball touches in the LD-SSCG, as well as presenting a higher rhythm of ball intervention and circulation. We also observed that U17 Group 03 showed more passes and shots performed in the LD-SSCG.
However, it was also interesting to note that U17 Group 01 presented higher offensive dynamics in the HD-SSCG. Therefore, it is probable these players already have the capacity to deal more effectively with game problems that emerge in tasks with a higher difficulty level. Another interesting finding was that U17 Group 01 only presented significant differences for two perfor-mance indicators, also indicating that this group prob-ably better managed the task difficulty level in the HD-SSCG. As well as presenting a higher number of players involved, which was already expected due to the pre-sence of floaters, they were able to present higher offen-sive dynamics in the HD-SSCG.
In general, these results were already expected, since we decreased task difficulty level by introducing three floaters in the game. Through specific performance indicators used in the present study, such as Passes and Ball touches, we observed that the LD-SSCG sti-mulates teams to keep ball possession, since these games enabled a greater number of passes and ball touches, corroborating with Padilha, Guilherme, Serra-Olivares, Roca, and Teoldo (2017). Other research has also found that the presence of inside or outside floaters stimulates teams to keep ball possession (Castellano, Silva, Usabiaga, & Barreira, 2016). Travassos, Vilar, Araújo, and McGarry (2014) observed that SSCGs with numerical offensive superiority stimulate a higher distance between the geometric center of the attacking-defending teams. This happens because players in the defense phase and at a numerical disad-vantage tend to move back in the direction of their own goalpost, in an attempt to protect important areas of the pitch that represent more danger to their team
(Travassos et al., 2014). Thus, this greater distance between players of both teams provided the ball carrier with more time and space to perform their actions. Moreover, the higher number of possibilities of action in the LD-SSCG, due to the presence of floaters, could have contributed to the enhancement in team performance.
Regarding the differences between team and players’ exploratory behaviors in both tasks, we found that, in general, tasks with a lower difficulty level stimulate more variability in player actions, enhancing the emer-gence of exploratory behavior. Also investigating players’ exploratory behavior in SSCGs with numerical imbalance, Torrents et al. (2016) found that players presented more exploratory behavior in underloaded game scenarios, when compared to overloaded situa-tions, indicating that tasks with a higher difficulty level stimulate players to explore more tactical/technical actions. However, the authors argue that extremely difficult game situations might also lead players to per-form less variety of actions, inhibiting exploratory behavior, and this assumption is in line with our find-ings, since we observed that LD-SSCGs stimulate more exploratory behavior. It is also important to highlight that in the LD-SSCG we analyze teams and players in the offensive phase, that is, only at a numerical advan-tage, where they were able to perform a large variety of behaviors, exploring both individual and collective tac-tical/technical actions.
Therefore, through these results, we can highlight that the strategy used by Travassos (2014) to measure task difficulty levels can easily be adopted by practi-tioners in order to design representative tasks with appropriate levels of difficulty according to player skill levels. However, an important issue must be high-lighted here: there is no reference value to classify a task in relation to its difficulty level. Through our results it was possible to note, for example, that the U17 players were able to better handle the difficulty level in the HD-SSCG, indicating that this task might present an appropriate difficulty level for these players. Therefore, considering that greater exploratory beha-vior may contribute to the improvement in player performance and the development of their ability to find different movement solutions to the game pro-blems, an exploratory behavior analysis could be used to measure the level of appropriateness of the task to player skill level and age. In this perspective, more research is needed to identify which variable can accu-rately identify the degree of adaptation of the task difficulty level to player skill level and age.
Conclusion
We conclude that team performance and players’ exploratory behaviors are affected by player’s age and tactical skill level, as well as by task difficulty level. In general, teams composed of players with a higher tac-tical skill level presented better performance and more exploratory behavior than teams composed of players with a lower tactical skill level. We also observed that the oldest players presented better performance and more exploratory behavior. Regarding tasks with differ-ent difficulty levels, we conclude that tasks with a lower difficulty level stimulate teams and players to give bet-ter performance, as well as presenting a betbet-ter explora-tory behavior.
Therefore, these results provide practitioners with important insights on how they can better organize their training sessions, as well as how to design appropriate training tasks with an appropri-ate level of difficulty to player age and skill level. In addition, the pedagogical strategy used in this research, regarding the creation of subgroups of players according to their skill levels to design appropriate training tasks for both of them, can be used to provide an effective learning environ-ment through a player-centered and game-based approach.
What does this article add?
Understanding the need to provide players with representative learning environments, this research offers important information to practitioners in order to assist them in the implementation of a player-centered and game-based process. This study demonstrated the need for practitioners to accurately identify their players’ skill level and to carefully manage the task difficulty levels in an attempt to adapt them to players’ needs and capaci-ties. The present study also showed that considering only age as an assumption to design representative tasks can be a mistake, since within the same age category, practitioners may have players with differ-ent skill levels. Thus, pedagogical strategies are neces-sary so that practitioners can better plan training sessions and design representative tasks with appro-priate difficulty and complexity levels for the differ-ent groups of players. Using the tools presdiffer-ented and tested in this work, practitioners will be able to organize their players within groups with different skill levels and provide representative training tasks with appropriate difficulty levels, in order to improve players’ performance. In addition, we support
exploratory behavior analysis to measure how train-ing task difficulty level is appropriate to a player’s intrinsic dynamics. For this, the present study was the first to use Lag Sequential Analysis to investigate player exploratory behavior, indicating that this tech-nique can be used to measure the appropriateness of task level to player skill levels.
Funding
This work was supported by the Fundação de Amparo à Pesquisa do Estado de São Paulo [2017/12142-5].
ORCID
João Cláudio Machado
http://orcid.org/0000-0001-9827-5296
Daniel Barreira http://orcid.org/0000-0003-2701-2303
Israel Teoldo http://orcid.org/0000-0001-9780-3456
Bruno Travassos http://orcid.org/0000-0002-2165-2687
Alcides José Scaglia http://orcid.org/0000-0003-1462-1783
References
Almeida, C. H., Ferreira, A., & Volossovitch, A. (2013).
Offensive sequences in youth soccer: Effects of experience and small-sided games. Journal of Human Kinetics, 36(1),
97–106. doi:10.2478/hukin-2013-0010
Almeida, C. H., Ferreira, A. P., & Volossovitch, A. (2012).
Manipulating task constraints in small-sided soccer games: Performance analysis and practical implications. The Open
Sports Sciences Journal, 5, 174–180. doi:10.2174/
1875399X01205010174
Anguera, M. T. (1997). Metodología de la Observación en las
ciencias Humanas. Madrid, Spain: Cátedra.
Aquino, R., Puggina, E. F., Alves, I., & Garganta, J. (2017).
Skill-related performance in soccer: A Systematic Review.
Human Movement, 18(5), 3–24. doi:
10.1515/humo-2017-0042
Bakeman, R., & Quera, V. (1995). Analyzing interaction:
Sequential analysis with SDIS and GSEQ. Cambridge, UK: Cambridge University Press.
Barreira, D., Garganta, J., Prudente, J., & Anguera, M. T.
(2012). Desenvolvimento e validação de um sistema de
observação aplicado à fase ofensiva em Futebol:
SoccerEye. Revista Portuguesa de Ciências do Desporto, 12
(3). doi:10.5628/rpcd.12.03.32
Castellano, J., Silva, P., Usabiaga, O., & Barreira, D. (2016).
The influence of scoring targets and outer-floaters on attacking and defending team dispersion, shape and crea-tion of space during small-sided soccer games. Journal of
Human Kinetics, 50, 153–163. doi:
10.1515/hukin-2015-0178
Chow, J. Y., Davids, K., Button, C., & Renshaw, I. (2016).
Nonlinear pedagogy in skill acquisition: An introduction. London, UK: Routledge.
Chow, J. Y., Davids, K., Button, C., Shuttleworth, R.,
pedagogy in physical education. Review of Educational
Research, 77(3), 251–278. doi:10.3102/003465430305615
Chow, J. Y., Davids, K., Hristovski, R., Araújo, D., &
Passos, P. (2011). Nonlinear pedagogy: Learning design
for self-organizing neurobiological systems. New Ideas in
Psychology, 29(2), 189–200. doi:10.1016/j.
newideapsych.2010.10.001
Cohen, J. (1960). A coefficient of agreement for nominal
scales. Educational and Psychological Measurement, 20(1),
37–46. doi:10.1177/001316446002000104
Costa, I. T., Garganta, J., Greco, P. J., & Mesquita, I. (2009).
Princípios Táticos do Jogo de Futebol: Conceitos e aplicação. Motriz: Revista de Educação Física (Online),
15(3), 657–668.
Costa, I. T., Garganta, J., Greco, P. J., Mesquita, I., & Maia, J.
(2011). Sistema de avaliação táctica no Futebol (FUT-SAT)
: Desenvolvimento e validação preliminar. Motricidade, 7
(1), 69–84. doi:10.6063/motricidade.7(1).121
Dellal, A., Hill-Haas, S. V., Lago-Peñas, C., & Chamari, K. (2011).
Small-sided games in soccer: Amateur vs. professional players’
physiological responses, physical, and technical activities. The Journal of Strength & Conditioning Research, 25(9),
2371–2381. doi:10.1519/JSC.0b013e3181fb4296
Fajen, B. R., Riley, M. A., & Turvey, M. T. (2009).
Information, affordances, and the control of action in sport. International Journal of Sport Psychology, 40(1), 79. Folgado, H., Lemmink, K. A., Frencken, W., & Sampaio, J.
(2014). Length, width and centroid distance as measures of
teams tactical performance in youth football. European
Journal of Sport Science, 14(Suppl.), S487–S492.
doi:10.1080/17461391.2011.643924
Garganta, J., Guilherme, J., Barreira, D., Brito, J., & Rebelo, A.
(2013). Fundamentos e práticas para o ensino e treino do
futebol. In F. Tavares (Ed.), Jogos Desportivos Coletivos: Ensinar a jogar (pp. 199–263). Porto, Portugal: Editora FADEUP.
González-Víllora, S., Serra-Olivares, J., Pastor-Vicedo, J. C., &
Costa, I. T. (2015). Review of the tactical evaluation tools for
youth players, assessing the tactics in team sports: Football.
SpringerPlus, 4(1), 1. doi:10.1186/s40064-015-1462-0
McComas, J., Moore, T., Dahl, N., Hartman, E., Hoch, J., &
Symons, F. (2009). Calculating contingencies in natural
environments: Issues in the application of sequential analysis. Journal of Applied Behavior Analysis, 42(2),
413–423. doi:10.1901/jaba.2009.42-413
Olthof, S. B. H., Frencken, W. G. P., & Lemmink, K. A. P. M.
(2015). The older, the wider: On-field tactical behavior of
elite-standard youth soccer players in small-sided games.
Human Movement Science, 41, 92–102. doi:10.1016/j.
humov.2015.02.004
Ometto, L., Vasconcellos, F., Cunha, F., Teoldo, I.,
Souza, C. R. B., Dutra, M. B., & Davids, K. (2018). How
manipulating task constraints in small-sided and condi-tioned games shapes emergence of individual and collec-tive tactical behaviours in football: A systematic review. International Journal of Sports Science & Coaching, 13(6), 1–15.
Padilha, M., Guilherme, J., Serra-Olivares, J., Roca, A., &
Teoldo, I. (2017). The influence of floaters on players’ tactical
behaviour in small-sided and conditioned soccer games. International Journal of Performance Analysis in Sport, 17 (5), 1–16.
Pinder, R. A., Davids, K., Renshaw, I., & Araújo, D. (2011).
Representative learning design and functionality of research and practice in sport. Journal of Sport & Exercise Psychology, 33(1), 146–155.
Renshaw, I., & Chow, J. Y. (2019). A constraint-led approach
to sport and physical education pedagogy. Physical
Education and Sports Pedagogy, 24(2), 103–116.
doi:10.1080/17408989.2018.1552676
Robinson, G., & O’Donoghue, P. G. (2007). A weighted
kappa statistic for reliability testing in performance analy-sis of sport. International. Journal of Performance Analyanaly-sis
in Sport, 7, 12–19.
Serra-Olivares, J., & Garcia-Rubio, J. (2017). Tactical
pro-blems, key within the representative task design under the non-linear approach for games teaching. Retos, 32, 270–278.
Silva, P., Travassos, B., Vilar, L., Aguiar, P., Davids, K.,
Araújo, D., & Garganta, J. (2014). Numerical relations
and skill level constrain co-adaptive behaviors of agents
in sports teams. PloS one, 9(9), e107112. doi:
10.1371/jour-nal.pone.0107112
Tabachnick, B., & Fidell, L. (2012). Using multivariate
statis-tics: International edition (Vol. 6). Boston, MA: Allyn & Bacon/Pearson Education.
Thalheimer, W., & Cook, S. (2002). How to calculate effect
sizes from published research: A simplified methodology.
Retrieved fromhttp://work-learning.com/effect_sizes.htm
Torrents, C., Ric, A., Robert, H., Torres-Ronda, L.,
Vicente, E., & Sampaio, J. (2016). Emergence of
explora-tory, technical and tactical behavior in small-sided soccer games when manipulating the number of teammates and
opponents. PloS one, 11(12), 1–15. doi:10.1371/journal.
pone.0168866
Travassos, B. (2014). A tomada de decisão no futsal. Lisboa,
Portugal: Prime Book.
Travassos, B., Araújo, D., Davids, K., Vilar, L., Esteves, P., &
Vanda, C. (2012). Informational constraints shape
emer-gent functional behaviours during performance of inter-ceptive actions in team sports. Psychology of Sport and
Exercise, 13(2), 216–223. doi:10.1016/j.
psychsport.2011.11.009
Travassos, B., Coutinho, D., Gonçalves, B., Pedroso, P., &
Sampaio, J. (2018). Effects of manipulating the number of
targets in U9, U11, U15 and U17 futsal players’ tactical
behaviour. Human Movement Science, 61, 19–26.
doi:10.1016/j.humov.2018.06.017
Travassos, B., Duarte, R., Vilar, L., Davids, K., & Araújo, D.
(2012). Practice task design in team sports:
Representativeness enhanced by increasing opportunities
for action. Journal of Sports Sciences, 30(13), 1447–1454.
doi:10.1080/02640414.2012.712716
Travassos, B., Vilar, L., Araújo, D., & McGarry, T. (2014).
Tactical performance changes with equal vs unequal num-bers of players in small-sided football games. International
Journal of Performance Analysis in Sport, 14(2), 594–605.