Gamito, S.; Furtado, R. 2009. Feeding diversity in macroinvertebrate communities: A contribution to estimate the ecological status in shallow waters. Ecological Indicators 2009, 9, 1009-1019.
Feeding diversity in macroinvertebrate communities: a contribution to estimate the ecological status in shallow waters
Gamito, Sofia a,* and Furtado, Ramilab
a
IMAR, Faculdade de Ciências do Mar e Ambiente, Universidade do Algarve. Campus de Gambelas, 8005-139 Faro, Portugal.
b
Faculdade de Ciências e Tecnologia, Universidade do Algarve.
* Corresponding author
Tel.: +351 289 800900; fax: +351 289 800069. E-mail address: [email protected] (S. Gamito).
Abstract
The feeding diversity of subtidal samples of macroinvertebrates from Ria Formosa was estimated with Shannon Wiener information index and complementary evenness. The results were compared with other commonly used methodologies under the European water framework directive, such as diversity indices, AMBI and ITI.
Assuming that in a healthy environment all feeding groups are present, and that no group clearly dominates, the feeding diversity is expected to be maximal and the evenness feeding diversity will be close to 1. In degraded environments some feeding groups might be absent or having low relative abundance, and generally with one or two groups dominating the community. In this way the evenness feeding diversity index would measure deviations from expected values due to a degradation of the environment. Although confirmation of this approach needs to be tested in other shallow waters, the results obtained show interesting features.
To each of the 297 species belonging to the Ria Formosa data matrix a feeding group was assigned, among six groups: surface deposit feeders, sub surface deposit feeders, herbivores, suspension feeders and suspension/deposit feeders (species which have the two feeding modes depending on food availability). The carnivorous, parasites, omnivorous and scavengers were all grouped together, forming the sixth group. Most of the stations of Ria Formosa showed high feeding diversity, which could correspond to a good or high ecological status (ES) except at one location, that occasionally showed low feeding diversity. This poor condition was essentially due to low water renewal and extreme environmental variation of some parameters, such as salinity. At some locations an intermediate feeding diversity was observed mainly due to natural accumulation of organic matter. Other commonly used indices also point out to the same tendencies.
We propose the evenness feeding diversity estimate approach as a practical and apparently robust method to estimate the ES of shallow waters, which can be used together with other common indicators. This approach has also the advantage of showing low sensibility to small samples and to low taxonomic identification effort.
Keywords:
Ecological Status, Water Framework Directive, Trophic groups, Feeding diversity, Biotic indices, Macrobenthic invertebrates
1. Introduction
The scientific community together with the competent authorities of the Member States of European Union is developing methodologies for defining the reference conditions and the ecological status of the major water bodies in Europe. Several biotic indices are being tested, modified and discussed for different coastal or transitional waters, based on one or more of the ES compartments of the ecosystem. The results obtained are at times contradictory (Gamito, 2008a), with indices showing different discriminating power (Chainho et al. 2007; Dauvin et al. 2007; Pranovi et al. 2007; Munari and Mistri, 2008).
Most of the biotic indexes are based on the Pearson and Rosenberg (1978) model. According to this model, with increasing organic input there is an increase of abundance, biomass and species richness in the first step. This is followed by progressive declination of species richness and biomass when eutrophication increases, while abundance (mainly of type r opportunistic species) continues to rise. But the problem is that the tolerant species, which endure these high organic concentrations, may also be tolerant to natural stressors (Dauvin, 2007; Elliott and Quintino, 2007) such as physical stress due to low water hydrodynamics found in some areas of estuaries and coastal lagoons (Gamito, 2006).
In the benthic invertebrates group it is usual to find organisms that feed essentially on detritus or on the bacteria benthic layer in the sediments, and other organisms that filter water to retain the plankton and small detritic suspended particles. Additionally, other organisms can also be found, such as herbivorous or grazers, feeding either on the macroalgae or on the epiphyte layer of the seagrasses, or carnivorous, feeding in other living organisms. Many of these carnivorous may also be necrophagous or scavengers, feeding on dead tissues. They can also be detritus feeders, feeding on small detritus of different origins that tend to accumulate on the sediments, in places with low hydrodynamic activity (Pearson and Rosenberg, 1987; Rosenberg, 2001). It is expected that several feeding groups coexist in the same place, but in different proportions, according to hydrodynamic conditions, which in turn determines the sediment characteristics.
In fact, suspension-feeding animals mostly dominate sandy sediments, deposit feeders dominate muddy sediments, while carnivores and other feeding types occur in both types of sediments. Small
sedimentary particles are indicative of a quiet water environment and it is here that fine-grained organic matter tends to settle from the water column. Suspension feeders function poorly in muddy sediments due to the clogging effect of resuspended particles and the destabilizing effect of deposit feeders on the sediment (Rhoads and Young, 1970; Levinton, 2001).
In estuaries and coastal lagoons muddy sediments are characteristic of places with low water currents or with low water renewal, colonized by detritivores of opportunistic r type. These areas may be subjected to high physical stress, such as daily high temperature and salinity variation, combined with large fortnightly and seasonal variation (Gamito, 2006). The sediment may therefore be dominated by r opportunistic detritivores and their abundant presence may be the result of physical stress and not of organic stress. Thus such harsh conditions prevent the development of other species, usually strong competitors of the K type. Furthermore, some of these strong competitors are top predators that may act as keystone species, regulating the community in a top-down way.
In stressed environments subjected either to anthropogenic action or natural physical stress, it is expected that the diversity of feeding groups decreases. This decrease is perhaps attributable to changes in dominance of the feeding groups, with the presence of all types or the absence of some types. In communities from locations with good ecological conditions presumably all the feeding groups will occur. In sandy sediments the community will be dominated by suspension-feeders, and in muddy sediments by detritus feeders. In seagrasses beds, which are very common in healthy estuarine or lagoonal locations (Kemp, 2000), the species richness is usually high and the community might be dominated by detritus feeders, as these locals act as sediment traps, accumulating fine sediments and organic matter.
Having this in mind, the Shannon-Wiener information index (Shannon and Weaver, 1963) and evenness index (Pielou, 1969) were used as a pathway to estimate the feeding diversity of benthic invertebrate communities. The feeding diversity results were then compared with the Infaunal Trophic Index (Word, 1978) and with AMBI index (Borja et al, 2000, 2003), and also with other diversity indices commonly proposed for the ecological status evaluation.
2. Materials and Methods
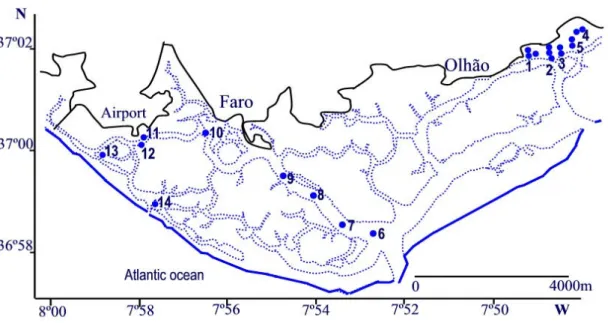
The data set resulted from the compilation of several sampling projects, carried out from 1985 to 1997 in Ria Formosa. This is a shallow coastal lagoon in South Portugal, classified as a Coastal Water body by the Portuguese WFD intercalibration group (Bettencourt, et al, 2004). The sampling projects covered different sediment types and different stressed conditions. The data set analysed and discussed in detail in Gamito (2008b) was used to test the feeding diversity index and its applicability under the scope of WFD. In this work, only the subtidal softbottom stations were considered (Fig. 1).
Figure 1. Approximate location of subtidal sampling stations. Stations 1-5 Gamito (2006) sites A-E, Stations 6-10: Faro channel stations (Calvário, 1995), station 11: Zostera bed; station 12: muddy sand bottom; station 13: sandy mud bottom and station 14: sand bottom (Calvário, 1995).
Gamito (1997, 2006) sampled five water reservoirs of three salinas, one tidal mill and a fish farm. All the 5 reservoirs received the same incoming water from a tidal channel from one of the main inlets of Ria Formosa. At each reservoir four to six corers of 0.011 m2 each were sampled (stations 1 to 4), depending on their size and shape. Macrofauna was sampled for 2 years, every second month, in 1985 and 1986. Station 5 was sampled from March 1996 to June 1997 every month, where 8 corers of 0.011 m2 each were taken at every sampling occasion. The water reservoirs were about 0.4 to 1 m deep, with deeper zones near the tidal gates. The fifth water reservoir was approximately 2 m deep.
Calvário (1995) sampled five stations of the Faro channel (stations 5 to 10), from the inlet waters coming to the city of Faro, in spring, summer, autumn and winter 1989. At each station six samples were taken using a Van Veen grab, covering a total area of 0.3 m2. The depth of these stations varied from -15 m (stations 6 and 7) to -10m (stations 8 and 9) and -7m (station 10). From January 1990 to January 1991, Calvário (1995) also sampled, every month, four common biotopes, in the Ria Formosa, near the spring low water level (MLWS), sand, sandy mud, muddy sand and Zostera bed, taking at each station, 15 corers, covering a total area of 0.3 m2 (stations 11 to 14). These last stations were considered to belong to the subtidal group of stations.
The sediment was sieved with 1 mm mesh sieves, in both data sets. In the data set only invertebrates were included, and the same taxonomic resolution adopted. Data identified to family level, for example Oligochaete families in one team data set but not in the other, than all Oligochaets were assemble at the Oligochaete level.
The trophic groups were the same considered in Gamito (2008b) divided into 5 groups: suspension feeders (plankton and detritus); deposit feeders (detritus and microphytobenthos); suspension/deposit feeders (species which have the two feeding modes depending on food availability) and herbivorous or grazers (macroalgae and macrophytes). The carnivorous, parasites, omnivorous and scavengers were all grouped together, following Valentine et al. (2002) and Dauvin et al. (2007). The deposit feeders from Gamito (2008) were further separated into surface and subsurface deposit feeders. In this way, two data sets were tested, first with only five trophic groups and second with six.
The Shannon-Wiener information index (Shannon and Weaver, 1963) was applied to estimate the feeding diversity in different locals of Ria Formosa, as it had already been done in Gamito (2008). The feeding diversity was calculated as:
) log ( ' 2 1 i n i i FD p p H
∑
= − = where∑
= n i i i i fg fgp is the relative abundance of the ith feeding group and n is the total number of feeding
groups considered. This index is expected to vary between 0 and H’FD maximum (H’FD max): n
H'FDmax=log2
In this exercise 5 or 6 feeding groups were tested, so the index is expected to vary between 0 and 2.3 to 2.58, depending on n, the number of feeding groups considered.
The evenness index (Pielou, 1969) was also adapted to estimate the distribution of the several feeding types at the different Ria Formosa locations.
max ' ' FD FD FD H H j =
This index varies between 0 and 1. When the index exhibit values close to 1 this means that all feeding groups are present and that no single one dominates. If the index exhibit values close to 0 this means that few or only one feeding group is present or that only one feeding group clearly dominates the community.
In diversity studies using the species taxonomic resolution level the total number of species present in a community usually is unspecified. The maximum diversity is therefore obtained with the estimated number of species, that is, the total number of species found in each sampling station and sampling occasion. To calculate the feeding diversity in the present study it is assumed that all the feeding groups are present in a healthy environment. The maximum value is attained when all the feeding groups are present in the same relative proportions. The probability of this combination is very low, but if none of the feeding groups clearly dominates evenness values might be higher than 0.8 or 0.9. In degraded environments some groups might be absent or their relative abundance may decrease, and one or two groups will dominate the community. In such situations the evenness diversity index measures deviations from expected values due to a degradation of the environment.
The results of the application of the two feeding indices were compared with the Infaunal Trophic Index (ITI) (Word, 1978):
4 , 3 , 2 , 1 4 3 2 2 3 3 . 33 100 TG TG TG TG ITI = − × + +
where TGi is the number of individuals in trophic group i, TG1 is the suspension feeders, TG2 is the carrion
feeders (carnivorous, omnivorous and necrophagous), TG3 is the surface deposit feeders and those species
that are both suspension feeders and surface deposit feeders, TG4 is the subsurface deposit feeders that feed
on sedimentary detritus and bacteria and TG1,2,3,4 is the total number of individuals in all trophic groups
ITI values near 100 means that suspension feeders are dominant and that the environment is not disturbed. At values near 0, subsurface deposit feeders dominate, meaning that the environment is strongly disturbed, probably due to human activities (Salas et al. 2006). The ITI was developed for ecologists surveying the benthos on large areas of the continental shelves (Word, 1978).
The feeding diversity results were also compared with AMBI (Borja et al. 2000, 2003):
where EG are the ecological groups, in %, according to their sensitivity to increasing pollution gradients: EGI comprises very sensitive species, EGII corresponds to the indifferent species, EGIII to the tolerant
species, EGIV to the second-order opportunistic species and EGV to the first-order opportunistic species.
Information about the sensitivity of more than 4100 taxa from European and Mediterranean soft-bottom sediments is available in: http://www.azti.es/. Borja et al. (2000) proposed a site pollution classification as a function of AMBI. Unpolluted sites would be dominated by ecological group I, and heavy polluted sites would be dominated by the ecological group V. Subsequently, in 2003, Borja et al. adapted this scale to WFD, stipulating a correspondence among the AMBI values and the Ecological Status.
The effect of a reduction of the taxonomic information was also studied. When analysing large data sets with multivariate techniques it is common to reduce the data by considering only the most abundant species and rejecting the rare species, represented by few individuals. This reduces the noise of the matrix and greatly facilitates the extraction of ecological patterns. Usually no differences are found when using the global data set or a reduced data set (Gamito 1997, 2006). The effect of reduction of information was then tested, by comparing the results from the global data matrix with the results from a matrix with only the 100 or the 40 most abundant species, and also by comparing these results with a matrix where the most abundant species, corresponding to 95 % of all individuals at each sampling station, were considered. The reason for using the last matrix is due to the fact that in some stations the total abundance of individuals is much lower than in other stations. For these stations with few individuals the majority of their species might be ignored when considering only the first 100 or 40 most abundant species.
In this paper, general comparisons with some diversity indices were also performed. 100 6 5 . 4 3 5 . 1 0 EGI EGII EGIII EGIV EGV AMBI = × + × + × + × + ×
Shannon-Wiener diversity (in bits); Margalef (1968); Simpson (1949) in the form (1-Simpson dominance index); Hurlbert ES50 (Hurlbert, 1971); and also with M-AMBI (Muxica et al, 2007). Since no reference conditions were yet defined for Ria Formosa, for M-AMBI calculations the reference conditions defined by the software (AZTI-Tecnalia, www.azti.es) were used.
The correlation among the different indices was estimated with Spearman rank correlation coefficient, as some of the indices did not have a normal distribution. Since the AMBI index varies in the opposite direction when put along side with the other indices, it decreases with increasing environmental quality, the maximum AMBI value minus the AMBI values, for each sampling occasion, was previously determined.
The original data matrix had 297 species, distributed along 133 stations and sampling occasions. All the diversity indices were calculated with this main data matrix. To avoid problems of erroneous identifications by the different teams, and since the feeding types did not vary with genera, the data was assembled at this taxonomic level. This practice resulted in a matrix of 216 genera. All feeding diversities estimated were obtained with this data matrix.
Although each sampling program had a specific sampling periodicity, no detailed discussion is done on the seasonal variation of the different indices. The aim of the paper was to discuss variation among the different indices but not the seasonal variation among sampling stations.
3. Results
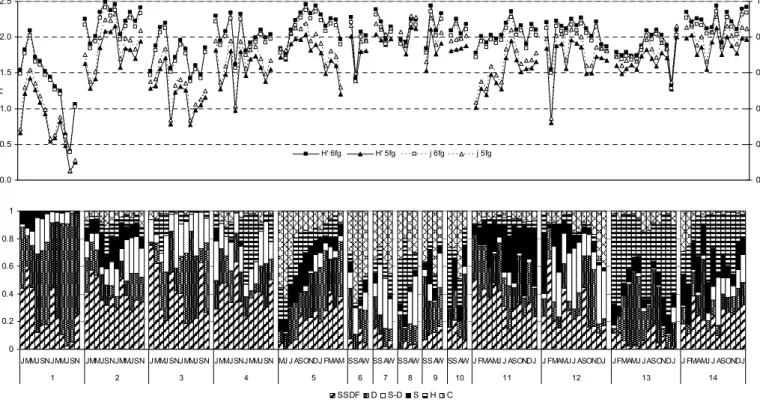
As expected, when only five feeding groups were considered, the feeding diversity was lower than when six trophic groups were considered (Fig. 2). This difference was larger in stations with an important presence of the detritivorous group. Evenness varied in a similar manner to feeding diversity.
In station 1 the deposit feeders dominate. Their relative importance is also high in stations covered by macrophytes, such as stations 2-4, and 11. In the stations of the large circulation channel (Faro channel) (stations 6-10), there is no dominance of a specific trophic group. Station 5, from a deep water reservoir of a fish farm, presented a high diversity of feeding groups, with a dominance of the carnivorous group during the first sampling months. In the sandy and sandy muds (stations 13 and 14) the herbivorous play an important role (Figure 3). In the muddy station (station 12) the subsurface deposit feeders together with the group of suspension/deposit feeders dominate. Nevertheless, the other groups are also present, and the feeding diversity is high. Stations where there is a dominance of one or two trophic groups show lower feeding diversity values than stations where all groups are present (compare the two graphs of Fig. 2).
0 0.2 0.4 0.6 0.8 1
JMMJSNJMMJSN JMMJSNJMMJSN J MMJ SNJ MMJSN JMMJSNJMMJSN MJ J ASONDJ FMAM SSAW SS AW SSAW SS AW SS AW J FMAMJ J ASONDJ J FMAMJJ ASONDJ JFMAMJ J ASONDJ J FMAMJ J ASONDJ
1 2 3 4 5 6 7 8 9 10 11 12 13 14
SSDF D S-D S H C
Fig. 2. (a) Variation of the feeding diversity measured by Shannon-Wiener information index or by evenness when six or five feeding groups were considered, in the different stations sampled. (b)
Variation of the six feeding groups relative abundance in the different stations sampled. SSDF, Subsurface deposit-feeders; SDF, surface deposit feeders; S-D, suspension/deposit feeders; S, suspensivorous; H, herbivorous; C, carnivorous /scavengers group.
All values of AMBI were below five, signifying that none of the stations analysed were in bad ecological status. The first two stations had similar values. The first station varied between 3 and 3.8 and the second station between 2.2 and 3.3 (Fig. 3). However, species diversity was higher in the second station (Fig. 3), and so was the feeding diversity (Fig. 2). Interestingly, ITI presented sharp variations. ITI values may be used to classify areas of seabed into either "normal" (ITI values 100-60), "changed" (60-30) or "degraded" (30-0) (Bascom et al., 1978). Using these intervals the majority of the stations of Ria Formosa are classified as “changed”, some as “degraded” and a few as “normal”.
The Margalef index is extremely dependent on species richness (S) (Fig.4) presenting an almost linear relation with it. Shannon-Wiener index is also sensitive to species richness but tends towards a trend when species richness is high. Simpson index is the less sensitive.
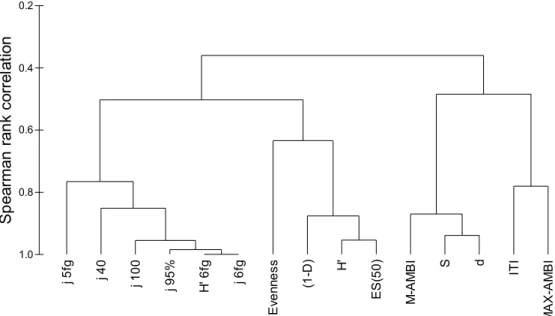
Our results indicate a high correlation among evenness feeding diversity indices, considering the different matrices, although with decreasing correlations when a strong reduction of number of taxa is performed or when only five feeding groups are taken into account. The feeding diversity is correlated with the species diversity indices (Shannon-Wiener, Simpson, and Hurlbert index (ES50)). A high correlation between Margalef and S was found, and of these two indices and M-AMBI (Fig.5).
0.0 0.5 1.0 1.5 2.0 2.5 H ' 0.0 0.2 0.4 0.6 0.8 1.0 j H' 6fg H' 5fg j 6fg j 5fg
0 20 40 60 IT I 0 1 2 3 4 5 A M B I ITI AMBI 0 1 2 3 4 5
JMMJSNJMMJSN JMMJSNJMMJSN JMMJSNJMMJSN JMMJSNJMMJSN MJ JASONDJFMAM SSAW SSAW SSAW SSAW SSAW J FMAMJ JASONDJ J FMAMJ JASONDJ J FMAMJ JASONDJ J FMAMJ JASONDJ
1 2 3 4 5 6 7 8 9 10 11 12 13 14 H ' 0 2 4 6 8 10 d H' d
Fig. 3. Variation of ITI, AMBI, Shannon-Wiener and Margalef indices, calculated with the species abundances data set in the different stations sampled.
0 3 6 9 12 d 0 1 2 3 4 5 H ' 0 0.2 0.4 0.6 0.8 1 0 20 40 S 60 80 100 1 -D
Fig. 4. Relation between species richness (S) and three diversity indices: Margalef (d), Shannon-Wiener (H’) and Simpson (1-D).
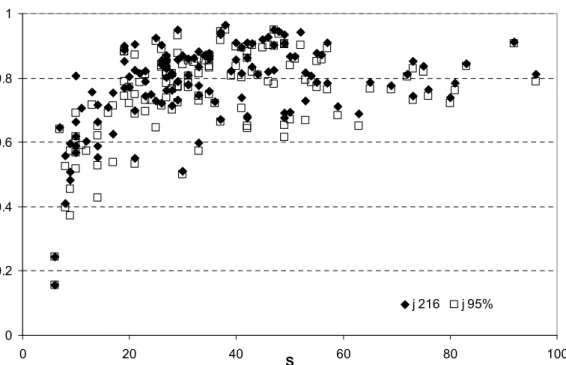
The feeding evenness index calculated when only the most abundant species in each station are considered, corresponding to 95 % of all individuals, did not differ considerably from the estimates with the global data matrix (Figs. 5 and 6). The 95% matrix represented a reduction of 56-72% of the number of genera in each station without loosing information. When the reduction of the taxa was done directly in the global data matrix there were some differences between the results, which were more accentuated in the stations with higher species richness. The first 100 most abundant taxa corresponded to 99.1 % of the total average densities, and the first 40 most abundant species corresponded to 91% of the total average densities. However, in some stations with low density and high species diversity dominant taxa were not included in the matrices of 40 or 100 taxa, which changed the results of the feeding diversity indices. Evenness feeding increased with S but tends to stabilize (Fig.7). The dispersion of values might reflect the functional differences among stations and sampling occasions.
j 5 fg j 4 0 j 1 0 0 j 9 5 % H ' 6 fg j 6 fg E v e n n e s s (1 -D ) H ' E S (5 0 ) M -A M B I S d IT I M A X -A M B I 1.0 0.8 0.6 0.4 0.2 S p e a rm a n r a n k c o rr e la ti o n
Fig. 5 – Dendrogram showing the similarities among the different indices (Spearman rank correlations, unweighed group average clustering technique). Indices codes: d, Margalef diversity; ES(50), Hurlbert diversity; evenness calculated with species abundances; H’, Shannon–Wiener calculated with species abundances; H’6fd, Shannon–Wiener calculated with six feeding groups; ITI, Infaunal Trophic Index; j, evenness calculated with feeding groups (j5fg or j6fg, five or six feeding groups with 216 taxa considered; j40 or j100, only the first 40 or 100 most abundant taxa considered; j95%, the most abundant taxa in each station considered).
0.0 0.2 0.4 0.6 0.8 1.0
JMMJSN JMMJSN JMMJSN JMMJSN JMMJSN JMMJSN JMMJSN JMMJSN MJ JASONDJ FMAM SSAW SSAW SSAW SSAW SSAW J FMAMJ JASONDJ J FMAMJ JASONDJ J FMAMJ JASONDJ J FMAMJ JASONDJ
1 2 3 4 5 6 7 8 9 10 11 12 13 14
j
j 216 j 95% j 100 j 40
Fig. 6. Variation of the feeding diversity measured by evenness when a global matrix of 216 taxa (j6 216) or the most abundant species in each station (j95%); the first 100 most abundant taxa (j 100) or the 40 (j40) most abundant taxa of the global data matrix are considered.
0 0.2 0.4 0.6 0.8 1 0 20 40 60 80 100 S j j 216 j 95%
Fig. 7. Relation between species richness (S) and feeding diversity—evenness index considering the global data matrix or the 95% most abundant taxa in each sampling station.
4. Discussion
4.1. Feeding diversity index, ecological status and ecological quality ratio
Although Shannon-Wiener information index is sensitive to rare species addition (Krebs, 1998) this index is very robust when it is used as a feeding group diversity estimator. No large differences were detected when using the 297 species /216 genera matrix or the 95% more abundant taxa in each station, which represents a reduction of the number of genera from 56 to 72%. This means that it is not necessary such a large sampling nor so much taxonomic identification effort.
The feeding diversiy, either calculated with Shannon-Wiener information index or with Pielou evenness, is perfectly correlated (r=1). This is due to the fact that, for evenness calculations, the total number of possible feeding classes were always known and included. On the contrary, when working with species data, the total number of species is seldom known. In this case the maximum evenness diversity is obtained when all the known species have an equal number of individuals, even if only two species are present.
Since the maximum number of feeding classes is previously defined, the Evenness and the Shannom-Wiener indices behave in a similar way. The evenness feeding index is equivalent to recalculate the Shannon-Wiener information index in a scale between 0 and 1. Moreover, as it has already a fixed interval of variation between 0 and 1, the evenness index is an appropriate index to be used under the WFD. Even though reference conditions are yet to be defined for Ria Formosa with pretested, discussed and debated methodologies, and also since this approach needs to be made certain by testing it in other transitional and coastal waters, still the results obtained show very interesting features, which cannot be neglected
Equivalence can be drawn between evenness feeding values (six feeding groups considered), the ecological quality ratio (EQR) and the ecological status (ES). A high ES would correspond to an EQR or evenness values above 0.8. Values between 0.8 and 0.6 correspond to good ES, 0.4 and 0.6 to moderate ES, 0.2 and 0.4 to poor ES and below 0.2 to bad ES. If a low number of feeding groups are considered, the boundaries of these intervals must be lowered.
With the above proposed intervals, we can conclude that most of the sampling stations of Ria Formosa are in good or high ecological status except station 1 that occasionally is in poor and even bad ecological status. Species diversity indices and M-AMBI also pointed out to the same tendencies. This poor condition at station 1 is due to low water renewal and extreme environmental variation of some parameters, such as salinity that varied between 13 and 84 psu (Gamito, 2008), and it is not due to organic pollution. Station 3 occasionally presented a moderate ES that was mainly due to natural accumulation of organic matter resulting from extensive production (Gamito, 2006, 2008b). If the data collected by Austen et al (1989) near Ria Formosa effluent outflows stations were considered in this data set, the evenness feeding index would be very low, as the only fauna present were oligochaetes (Gamito, 2008b), generally considered to be subsurface deposit feeders (Giere, 2006).
4.2. Applying the Infauna Trophic Index
Using ITI proposed intervals almost all stations of Ria Formosa are classified as “changed” and some as “degraded” or “normal”. However, this index should not be applied in shallow areas (Maurer et al. 1999) where, in healthy places, the seagrasses proliferate, indicating an excellent water quality. In fact, it was beneath this habitat that the highest species richness was found (Gamito, 2008). However, the fine sediments are trapped by the seagrass leaves and accumulate, together with organic matter and detritus, enhancing the detritus-feeders species. Seagrass contribute to the food web either directly through grazing on seagrass leaves or indirectly through grazing on the attached epiphytic algae (Heck and Valentine, 2006 and references therein).
The ITI has been applied to systems such as bays (Donath-Hernandez and Loya-Salinas, 1989, Dauvin et al., 2007) with reasonably satisfactory results, but has a limited sensitivity to changes in abiotic and biotic components and it is not a good descriptor of system health (Maurer et al., 1999; Pinto et al., 2009).
The ITI attains its maximum value when the entire community is composed by suspension-feeders. In this hypothetical community the feeding diversity will be minimal, and perhaps also the species diversity, as the community would be composed only by suspension-feeders, although by several species. When all the four trophic groups of ITI are present in equal proportions (25%) ITI is equal to 50, indicating a changed environment, but the feeding diversity would be high. In healthy locations a community is never entirely dominated by one trophic group and consequently the ITI should not be used as an index to measure the ecological status of an ecosystem.
4.3. Difficulties in assessing species to feeding groups
There are some difficulties in assigning species to particular feeding group such as frequent absence of species-specific information on feeding strategies and the potential for error in family-level generalizations, as well as inconsistencies in the literature on feeding modes due to methodological differences or inter-population variability (Weston, 1990) and also behavioral modification in feeding mode depending upon environmental conditions (Fauchald and Jumars, 1979), food availability and stages of development. Moreover, due to geographical restrictions, the feeding behaviour of certain species can be largely influenced by their habitat conditions.
However, when assigning species to the different organic pollution tolerance groups there are also difficulties, such as the species tolerance list proposed by Borja et al (2000, 2003) when developing the AMBI index. For example, Carvalho et al (2006) suggest assigning new site specific ecological groups especially in the lagoon system of Ria Formosa. Furthermore, the AMBI index implies that most benthic organisms be identified at the species level. Specifically, the high species richness of Ria Formosa when compared with other coastal lagoons (Gamito, 2008b) implies highly time consuming and very specialized taxonomic identification work.
4.4. Feeding groups approach in ecological modelling and in functional ecology
Whenever a trophic food web is built the modelers carefully include all trophic levels, starting with the primary producers (which can be in the water column as phytoplankton or in the bottom as seagrass, macroalgae and also as microphytobenthos), primary consumers, secondary consumers, top predators, and detritivorous. Most secondary consumers and top predators are not invertebrates, in a natural ecosystem. In a marine ecosystem these will correspond to certain fish, marine mammals and birds. But in the macroinvertebrate compartment also some invertebrates are secondary consumers, such as carnivorous gastropods and polychaets and many decapod crustaceans.
Till date, not many marine or estuarine invertebrate detailed food webs have been published. Menge et al. (1996) presented a macroinvertebrate food chain composed by mobile herbivorous feeding in benthic plants, filter feeders feeding in phytoplankton and, as predators, small and large carnivorous (carnivorous gastropods and a sea star) for two rocky exposed sites. Detrivores were not present, since in sites with strong hydrodynamic action detritus cannot accumulate. Baird and Ulanowicz (1993) compared the trophic structure of four tidal estuaries. They included the benthic suspension feeders and the invertebrate deposit feeders in all trophic food webs and occasionally the benthic invertebrate carnivorous. For a seagrass food web in Florida, Luczkovich et al. (2003) considered five macroinvertebrates groups: predatory gastropods, herbivores, detritivores, omnivorous and suspension-feeders. Some ECOPATH (Christensen and Pauly,
1992; Christensen and Walters, 2004) based models include a differentiation of benthic invertebrate groups
such as the models developed for the Seine estuary (Rybarczyk and Elkaim, 2003) and the Bay of Somme
(Rybarczyk et al., 2003) where three macroinvertebrate groups: suspension feeders, deposit feeders and
omnivorous together with benthic predators were considered. However, even if ECOPATH models do not clearly separate the invertebrate feeding groups, these are included in the diet composition matrix (see for example, Gamito and Erzini, 2005).
Nevertheless, the functional feeding group approach seems to be generalized, and five to seven or eight groups are usually included in relation to benthic invertebrates. In marine and estuarine environments, the benthic macroinvertebrates are usually divided into the following five feeding categories: deposit feeders (detritivores), suspension feeders, carnivores, herbivores (or grazers), and omnivores (Pearson, 2001). Occasionally, the deposit feeders are divided into subsurface and surface deposit feeders. A combination of some of the previous feeding groups is also possible, such as the organisms that feed either on detritus or on suspended material, according to food availability, or the carnivores that can also feed on dead tissues or on detritus (Fauchald and Jumars, 1979; Gaston, 1987; Gaudêncio and Cabral, 2007). In streams and rivers ecology the groups are similar, although the functional feeding groups are based on their mechanisms for obtaining food and the particle size of the food and not on what they eat per se (Hershey and Lamberti, 2001).
4.5. Ria Formosa feeding diversity and eutrophication
In the Ria Formosa, the influence of freshwater is minimal but the tidal influence and geomorphology are determinant for the physical, chemical and sediment spatial characteristics. The benthic communities reflect the different spatial environments but they can also influence them. In the deep channels, the strong tidal currents and reduced light prevent macrophytes to develop. Nevertheless all feeding groups are expected to occur. The detritivores will benefit from the transport of detritus by the tides. Also the suspension-feeders will benefit from the currents, and the herbivores, such as small amphipods, will find macroalgae portions to feed on. In shallow sandy banks, the suspension feeders will increase in abundance. In the muddy sediments, which are formed where the current speed decreases, the detritivores proliferate. Herbivorous may be present in case macroalgae develop or accumulate. The carnivores / omnivores will be present in all habitats. The seagrass grounds (stations 2 and 11), as well as the epibenthic fauna, form a special three dimensional above ground habitat allowing for a rich community to settle down and develop (Gamito, 2008b). All the feeding groups are expected to be present, with healthy dominance of detritivores feeders, due to the accumulation of fine particles.
But what happens when there is an increase of nutrient load due to anthropogenic activity? In locations with high water residence time, during the eutrophication process there is a progressive replacement of seagrasses and slow growing macroalgae by fast-growing macroalgae and phytoplankton, with a final dominance of phytoplankton at high nutrient loads (Cloern, 2001). Changes in the primary producer’s structure affect the trophic web structure. After an initial increase of species richness, abundance and biomass, there is a progressive decline in species richness and biomass when eutrophication increases. Abundance (mainly due to a reduced number of opportunistic species, specially detrivorous) continues to rise and the sediment thickness occupied by the fauna decreases (Pearson and Rosenberg, 1978; Weston, 1990).
As foreseen in the results section, in stressed environments subjected either to eutrophication (station 3) or to natural physical stress (station 1), the diversity of feeding groups decreased. This decrease was mainly due to changes in dominance of the feeding groups, and also to the absence of some of the groups. In locations with good ecological conditions all the feeding groups occurred. In sandy sediments, the community was dominated by suspension-feeders and in muddy sediments by detritus feeders. In seagrass beds, the species richness and feeding diversity was high but the community was dominated by detritus feeders.
4.6. Advantages and limitations of feeding diversity index
The evenness feeding diversity index is insufficient to separate eutrophicated locations from physically stressed environments. Likewise other methodologies do not allow to distinguish the two stressors (see the interesting discussion about the ”Estuarine quality paradox” in Elliott and Quintino, 2007) and perhaps taxonomic indicators are required to be used for locations with moderate or poor ecological
status. Gamito (2008b) concluded that both structural (species richness and diversity indices) and functional indicators (trophic composition) indicate the same trend for eutrophicated and for physically stressed areas: low species richness, low diversity indices and a community dominated by small opportunistic detritivores species. Nevertheless, the physically stressed areas were dominated by chironomid larvae and hydrobiid gastropods and the most polluted areas were dominated by oligochaetes, mainly tubificids.
Fano et al. (2003) used Shannon-Wiener index to evaluate the trophic complexity expressed in what they have called “functional diversity”, which was based on the abundance data of the following functional groups: grazers, scrapers, suspension-feeders, surface deposit feeders, subsurface deposit feeders and predators. They integrate this index with other seven attributes derived from macroinvertebrate data and primary productivity, to define the ecofunctional quality index. Other teams have proposed more complex integration of functional attributes to estimate the functional diversity (see Bremner et al. 2003; Mason et al. 2005; Mouillot et al. 2005, 2006 and references there in).
We propose a practical and apparently robust method to estimate the Ecological Quality Status of shallow waters, based on the macroinvertebrates compartment, which can be used together with other commonly used indicators, such as species diversity or multimetric indices. However, these commonly used indicators demand a high degree of specialization for taxonomic identification and a large sampling effort, while the feeding diversity approach is robust enough to small samples and low taxonomic identification effort, since only the most abundant species need to be identified and their feeding habits known.
Acknowledgments:
We thank the Erasmus Mundus Programme for funding R. Furtado MSc thesis at the University of Algarve Portugal and the comments and suggestions of the two anonymous referees.
References
Austen, M.C., Warwick, R.M., Rosado, M.C. 1989. Meiobenthic and macrobenthic community structure along a putative pollution gradient in Southern Portugal. Marine Pollution Bulletin 20, 398-405.
Baird, D., Ulanowicz, R.E., 1993. Comparative study on the trophic structure, cycling and ecosystem properties of four tidal estuaries. Marine Ecology Progress Series 99, 221–237.
Bascom, W., Mearns, A.J., Word, J. 1978. Establishing boundaries between normal, changed and degraded areas. In W. Bascom Southern California Coastal Water Research Project Report, pp. 81-94, California.
Bettencourt, A.M., Bricker, S. B., Ferreira, J. G., Franco, A., Marques, J. C., Melo, J. J., Nobre, A., Ramos, L., Reis, C. S., Salas, F., Silva, M. C., Simas, T., Wolff, W. J. 2004. Typology and reference conditions for Portuguese transitional and coastal waters, INAG and IMAR, Lisbon.
Borja, A., Franco, J. , Muxika, I. 2000, A Marine Biotic Index to establish the ecological quality of soft-bottom benthos within European estuarine and coastal environments. Marine Pollution Bulletin 40, 1100-1114.
Borja, A., Muxika, I., Franco, J. 2003. The application of a Marine Biotic Index to different impact sources affecting soft-bottom benthic communities along European coasts. Marine Pollution Bulletin 46, 835-845.
Bremner, J., Rogers, S.L., Frid, C.L.J. 2003. Assessing functional diversity in marine benthic ecosystems: a comaprison of approaches. Marine Ecology Progress Series 254, 11-25.
Calvário, J. 1995. Estrutura e dinâmica das comunidades macrobênticas da Ria Formosa. Ph D Thesis, Universidade do Algarve, Faro.
Carvalho, S., Barata, M., Pereira, F., Gaspar, M.B., Fonseca, L.C., Pousão-Ferreira, P. 2006. Distribution patterns of macrobenthic species in relation to organic enrichment within aquaculture earthen ponds. Marine Pollution Bulletin 52, 1573-1584.
Chainho, P., Costa, J.L., Chaves, D.M., Dauer, D.M., Costa, M.J. 2007. Influence of seasonal variability in benthic invertebrate community structure on the use of biotic indices to assess the ecological status of a Portuguese estuary. Marine Pollution Bulletin 54, 1586–1597.
Christensen, V., Pauly, D., 1992. ECOPATH II—a software for balancing steady-state ecosystem models and calculating network characteristics. Ecological Modelling 61, 169–185.
Christensen, V., Walters, C.J., 2004. ECOPATH with ECOSIM: methods, capabilities and limitations. Ecological Modelling 172, 109–139.
Cloern, J.E. 2001. Our evolving conceptual model of the coastal eutrophication problem. Marine Ecology Progress Series 210, 223-253.
Dauvin, J.C. 2007. Paradox of estuarine quality: Benthic indicators and indices, consensus or debate for the future. Marine Pollution Bulletin 55, 271-281.
Dauvin, J.C., Ruellet, T., Desroy, N., Janson, A.-L. 2007. The ecological quality status of the Bay of Seine and Seine estuary: use of biotic indices. Marine Pollution Bulletin 55, 241-257.
Donath-Hernández, F.E., Loya-Salinas, D.H. 1989. Contribution to the study of organic marine pollution in Bahia de Todos Santos, Baja California. Ciencas Marinas 15, 73–88.
Elliott, M., Quintino, V. 2007. The estuarine quality paradox, environmental homeostasis and the difficulty of detecting anthropogenic stress in naturally stressed areas. Marine Pollution Bulletin 54, 640-645. Fano, E. A., Mistri, M., Rossi, R. 2003. The ecofunctional quality index (EQI): a new tool for assessing
lagoonal ecosystem impairment. Estuarine, Coastal and Shelf Science 56, 709-716.
Fauchald, K., Jumars, P.A. 1979. The diet of worms: a study guide of polychaete feeding guilds. Oceanography and Marine Biology, Annual Review 17, 193-284.
Gamito, S. 1997. Application of canonical correspondence analysis to environmental and benthic macrofauna data of four sites in the Ria Formosa (Portugal). Publicaciones especiales del Instituto Español de Oceanografia 23, 41-52.
Gamito, S. 2006. Benthic ecology of semi-natural coastal lagoons, in the Ria Formosa (Southern Portugal), exposed to different water renewal regimes. Hydrobiologia 555, 75-87.
Gamito, S. 2008a. Water Framework Directive: Defining the Ecological Quality Status in Transitional and Coastal Waters. In I.E. Gonenç, A. Vadineanu, J.P., Wolflin, R.C. Russo, Sustainable use and development of watersheds, Springer,
Gamito, S. 2008b. Three main stressors acting on the Ria Formosa lagoonal system (Southern Portugal): Physical stress, organic matter pollution and the land-ocean gradient. Estuarine, Coastal and Shelf Science 77, 710-720.
Gamito, S., Erzini, K., 2005. Trophic food web and ecosystem attributes of a water reservoir of the Ria Formosa (south Portugal). Ecological Modelling 181, 509–520.
Gaston, G.R. 1987. Benthic polychaeta of the Middle Atlantic Bight: feeding and distribution. Marine Ecology Progress Series 36, 251-262.
Gaudêncio, M.J., Cabral, H.N. 2007. Trophic structure of macrobenthos in the Tagus estuary and adjacent coastal shelf. Hybrobiologia 587, 241-251.
Giere, O. 2006. Ecology and biology of marine oligochaeta - an inventory rather than another review. Hydrobiologia 564, 103-116
Heck, K.L.J., Valentine, J.F. 2006. Plant-herbivore interactions in seagrass meadows. Journal of Experimental Marine Biology and Ecology 330, 420-436.
Hershey, A.E., Lamberti, G.A. 2001. Stream macroinvertebrate community. In Naiman, R.J. & R.E. Bilby River ecology and management. Lessons from the Pacific coastal region, pp. 705. Springer.
Hurlbert, S.H. 1971. The nonconcept of species diversity: a critique and alternative parameters. Ecology 52, 577-586.
Kemp, W.M. 2000. Seagrass ecology and management: an introduction. In Bortone, S.A. Seagrasses. Monitoring, Ecology, Physiology and Management, pp. 1-6. CRC Press, Boca-Raton.
Levinton, J.S. 2001. Marine Biology. Function, biodiversity, ecology, 2/Ed. Oxford University Press, New York.
Luczkovich, J.J., Ward, G.P., Johnson, J.C., Christian, R.R., Baird, D., Neckles, H., & Rizzo, W.M. 2003. Determining the trophic guilds of fishes and macroinvertebrates in a seagrass food web. Estuaries 25, 1143-1163.
Margalef, R. 1968. “Perspectives in Ecological Theory.,” University of Chicago Press, Illinois.
Mason, N.W.H., Mouillot, W.G.L., Wilson, J.B. 2005. Functional richness, functional evenness and functional divergence: the primary components of functional diversity. Oikos 111, 112-118.
Maurer, D., Nguyen, H., Robertson, G., Gerlinger, T. 1999. The Infaunal Trophic Index (ITI): Its suitability for marine environmental monitoring. Ecological Applications 9, 699-713.
Menge, B.A., Daley, B., Wheeler, P.A. 1996. Control of interaction strength in marine benthic communities. In G.A.Polis, G:A., K.O. Winemiller Food webs. Integration of patterns and dynamics, pp. 258-274. Chapman & Hall, New York.
Mouillot, D., Mason, W.H.N., Dumay, O., Wilson, J.B. 2005. Functional regularity: a negleted aspect of functional diversity. Oecologia 142, 353-359.
Mouillot, D., Spatharis, S., Reizopoulou, S., Laugler, T., Sabetta, L., Basset, A., Chi, T.D. 2006. Alternatives to taxonomic-based approaches to assess changes in transitional water communities. Aquatic conservation - Marine and Freshwater ecosystems 16, 469-482.
Munari, C., Mistri, M. 2008. The performance of benthic indicators of ecological change in Adriatic coastal lagoons: Throwing the baby with the water? Marine Pollution Bulletin 56, 95-105.
Muxika, I., Borja, A., Bald, J. 2007. Using historical data, expert judgement and multivariate analysis in assessing reference conditions and benthic ecological status, according to the European Water Framework Directive. Marine Pollution Bulletin 55, 16-29.
Pearson, T.H., Rosenberg, R. 1978. Macrobenthic succession in relation to organic enrichment and pollution of the marine environment. Oceanography Marine Biology Annual Review 16, 229-311.
Pearson, T.H. 2001. Functional group ecology in the soft sediment marine benthos: the role of bioturbation. Oceanography and Marine Biology. An Annual Review. 39, 233-267.
Pearson, T.H., Rosenberg, R. 1987. Feast and famine: structuring factors in marine benthic communities. In J.H.R. Gee, P.S. Giller, Organization of Communities, pp. 373–395. Blackwell Scientific Publications, Oxford.
Pielou, E. C. 1969. An introduction to mathematical Ecology, Wiley, New York.
Pinto, R., Patricio, J., Baeta, A., Fath, B., Neto, J.M., Marques, J.C., 2009. Review and evaluation of estuarine biotic indices to assess benthic condition. Ecological Indicators 9, 1–25.
Pranovi, F., Da Ponte, F., Torricelli, P. 2007. Application of biotic indices and relationship with structural and functional features of macrobenthic community in the lagoon of Venice: an example over a long time series of data. Marine Pollution Bulletin 54, 1607–1618.
Rhoads, D.C., Young, D.K. 1970. The influence of deposit-feeding organisms on sediment stability and community trophic struture. Journal of Marine Research 28, 150-178.
Rosenberg, R. 2001. Marine benthic faunal successional stages and related sedimentary activity. Scientia Marina 65, 107-119.
Rybarczyk, H., Elkaim, B., 2003. An analysis of the trophic network of a macrotidal estuary: the Seine estuary (Eastern Channel, Normandy, France). Estuarine, Coastal and Shelf Science 58, 775–791. Rybarczyk, H., Elkaim, B., Ochs, L., Loquet, N., 2003. An analysis of the trophic network of a macrotidal
ecosystem: the Bay of Somme (Eastern channel). Estuarine, Coastal and Shelf Science 58, 405–421. Salas, F., Patricio, J., Marques, J.C. 2006. Ecological indicators in coastal and estuarine environmental
assessment. A user friendly guide for partitioners, Coimbra University Press, Coimbra.
Sanders, H.L., 1958. Benthic studies in buzzards bay. I. Animal sediment relationships. Limnology and Oceanography 3, 245–258.
Shannon, C. E., Weaver, W. 1963. The Mathematical Theory of Communication., The University of Illinois Press, Illinois.
Simpson, E. H. 1949. Measurement of diversity. Nature 163, 688.
Valentine, J.W., Roy, K., Jablonski, D. 2002. Carnivore/non-carnivore ratios in northeastern Pacific marine gastropods. Marine Ecology Progress Series 228, 153–163.
Weston, D.P. 1990. Qualitative examination of macrobenthic community changes along an organic enrichment gradient. Marine Ecology Progress Series 61, 233-244.
Word, J. 1978. The infaunal Trophic Index. pp. 19-39. Edited by W. Bascom: Southern California Coastal Water Research Project.