Instituto Politécnico de Leiria
Escola Superior de Turismo e Tecnologia do Mar
Is it possible to detect Betanodavirus with non-lethal
sampling methods in experimentally infected
Dicentrarchus labrax (Linnaeus, 1758)?
Inês de Almeida Ferreira
Instituto Politécnico de Leiria
Escola Superior de Turismo e Tecnologia do Mar
Is it possible to detect Betanodavirus with non-lethal
sampling methods in experimentally infected
Dicentrarchus labrax (Linnaeus, 1758)?
Inês de Almeida Ferreira
Master Degree in Aquaculture
2018
A thesis submitted to the School of Tourism and Maritime Technology, Polytechnic Institute of Leiria as partial fulfilment for the requirements for the Master’s Degree in Aquaculture, held under the scientific supervision of Doctor Kimberly Thompson (Moredun Research Institute), Doctor Janina Costa (Moredun Research Institute) and specialist Teresa Baptista (School of Tourism and Maritime Technology, Polytechnic Institute of Leiria).
V Is it possible to detect Betanodavirus with non-lethal sampling methods in experimentally infected Dicentrarchus labrax (Linnaeus, 1758)?
Copyright © Inês de Almeida Ferreira
Escola Superior de Turismo e Tecnologia do Mar – Peniche, Instituto Politécnico de Leiria, 2018
The School of Tourism and Maritime Technology and the Polytechnic Institute of Leiria are entitled, perpetually and without geographical boundaries, to archive and publish this work through printed copies reproduced on paper or digital form or by any other known means or to be invented, and to disseminate through scientific repositories and admit copying and distributing to educational purposes or research, non-commercial, as long as credit is given to the author and publisher.
VII
Acknowledgements
Esta é uma excelente oportunidade para agradecer a todos aqueles que me apoiaram/orientaram ao longo de todo o meu percurso académico. Este é o culminar de uma etapa académica, que se iniciou há alguns anos, e como tal sinto a necessidade de agradecer a todos os professores que contribuíram para a minha formação, não só enquanto aluna, mas como indivíduo também, ao longo do meu percurso escolar. Obrigada!
Gostaria de agradecer ao Diretor da Escola Superior de Turismo e Tecnologia do Mar (Instituto Politécnico de Leiria), à Doutora Ana Pombo (coordenadora do Mestrado de Aquacultura), ao gabinete de estágios da Escola Superior de Turismo e Tecnologia do Mar (em especial ao João Assis), e principalmente a cada uma das minhas coordenadoras de mestrado que me auxiliaram ao longo deste percurso. Um grande agradecimento à Doutora Kimberly Thompson e à Doutora Janina Costa por me terem recebido com tanto carinho no Moredun Research Institute, e por terem possibilitado que aprendesse tanto! Obrigada por terem disponibilizado todos os meios de que dispunham para este projeto, por me terem ouvido, por me terem aconselhado, e por me terem auxiliado sempre (tão prontamente)! Um enorme obrigada à minha orientadora Teresa Baptista por me ter dado a oportunidade de desenvolver o meu trabalho no estrangeiro, e por me ter aconselhado tanto e auxiliado durante esta etapa! Este trabalho permitiu-me desenvolver as minhas capacidades, alargar os meus horizontes, e foi consigo que eu consegui tal feito! Muito obrigada à professora Susana Mendes, pela sua disponibilidade (constante) e por toda a ajuda/conselhos que me deu!
À Catarina Miranda que me auxiliou durante o ensaio, e que me ouviu e acalmou nos momentos de maior stress, muito obrigada também! Um agradecimento especial à Valeria Macchia por toda a sua disponibilidade e boa disposição durante a minha estadia na Escócia (e pela tua amizade e carinho)!
Obrigada a todos os meus amigos, em especial à Ana Ruas, ao Fábio Miranda, ao Ricardo Passos, ao Eduardo Lopes, ao Mauro Paias, ao Pedro Albano, ao Guilherme Ferreira, ao Pedro Moreira, ao Rodolfo Ramos, à Maria José e a tantos outros que me permitiram dar tantas gargalhadas, e que me apoiaram tanto! Obrigada Ana pelo teu apoio constante ao longo destes cinco anos, por cada abraço partilhado, por cada palavra, por teres sempre acreditado em mim… em muitos dos bons momentos que guardo na memória, tu estás presente… Obrigada “Moon man” por me teres ouvido
VIII tantas vezes, por todos os diálogos filosóficos, por me teres feito sorrir tantas vezes e amainado o meu espírito… Aos meus irmãos que ao longo da minha vida sempre me apoiaram em todas as decisões e demonstraram interesse constante no meu trabalho!
Aos meus pais… esta tese é dedicada a vós. Tantas são as palavras que eu poderia escrever… obrigada por me terem dado liberdade para tomar todas as minhas decisões, obrigada por me terem ouvido com tanta atenção, obrigada por todos os sábios conselhos, obrigada por terem tido sempre uma palavra positiva para mim, obrigada por todas as oportunidades que me têm dado, obrigada por serem um exemplo do que eu pretendo ser e de todos os bons valores que me têm transmitido ao longo da minha vida. Jamais me esquecerei de tudo o que fizeram e ainda fazem por mim… Este trabalho, é vosso também. Obrigada!
IX
Resumo
Atualmente, uma das principais preocupações com a indústria aquícola está relacionada com os surtos de Encefalopatia e Retinopatia Viral (ERV), uma vez que esta doença está associada a níveis elevados de mortalidade (até 90-100% de mortalidade), especialmente em peixes juvenis. Mais de 120 espécies cultivadas e selvagens são suscetíveis a esta patologia. O agente etiológico desta patologia é designado por Betanodavirus, um vírus constituído por duas cadeias simples de RNA sem envelope (ssRNA).
Recentemente, a técnica de RT-PCR em tempo real tem vindo a adquirir mais importância, como método confiável para deteção de Betanodavirus. O órgão preferencial para detetar Betanodavirus é o cérebro, porém, para analisar reprodutores, este método de amostragem letal não é adequado. Os métodos de amostragem não-letal, como utilização de barbatanas, brânquias ou serologia, têm sido investigados numa sociedade cada vez mais preocupada com o bem-estar animal. O objetivo deste estudo consistiu em avaliar a viabilidade destes tecidos para a deteção de uma infeção de Betanodavirus em robalo legítimo (Dicentrarchus labrax).
Foram analisados quatro tecidos distintos, o cérebro (órgão preferencial para deteção de Betanodavirus), brânquias, barbatana caudal e sangue como tecidos provenientes de amostragem não-letal para avaliar a sua adequabilidade ao método de deteção RT-PCR em tempo real. Juvenis de robalo foram infetados com o vírus por injeção intramuscular ou imersão, e amostras de tecido, sangue e serum foram recolhidas nos dias 7, 15 e 30 após infeção experimental.
O método ELISA permitiu a deteção de anticorpos específicos para Betanodavirus aos 7 dias após a infeção experimental. Concentrações mais elevadas de anticorpos foram detetadas nos dias 15 e 30 após infeção experimental, para ambos os métodos de infeção. A presença de anticorpos indica que este é um método adequado para avaliar o estado serológico dos peixes em estágios de infeção precoces até pelo menos um mês após infeção.
Foi possível detetar o RNA viral em todos os tecidos analisados com RT-PCR em tempo real. A carga viral presente nos tecidos provenientes de amostragem não letal foi sempre mais reduzida do que a apresentada pelo cérebro em todos os dias de amostragem. Vírus foi detetado nos tecidos de amostragem não letal a partir do dia 7
X após infeção experimental. A carga viral na barbatana caudal apresentou diferenças estatisticamente significativas entre dias de amostragem, enquanto que as brânquias apresentaram diferenças entre tratamentos e dias de amostragem. Como esperado, o cérebro foi o único tecido que registou a presença do vírus independentemente do método de infeção ou do dia de amostragem.
A presença de vírus ao longo do período de amostragem não foi constante nos tecidos de amostragem não letal (brânquias, barbatana caudal e sangue) e a carga viral foi sempre mais reduzida dos que a registada para o cérebro. Cargas virais elevadas foram detetadas no sangue de peixes infetados por injeção intramuscular desde dia 15 até ao final do ensaio.
A presença do vírus detetada em todos os dias de amostragem e em quantidade mais elevada, e o reconhecido tropismo deste vírus para tecidos do sistema nervoso, permitem aconselhar que o cérebro permaneça como órgão preferencial para o diagnóstico e triagem de peixes infetados com Betanodavirus. Porém, os resultados apontam para o facto de que são necessários mais estudos sobre o uso destes tecidos de amostragem não letal de forma aceitar ou rejeitar, sem dúvidas, a possibilidade de utilizar estes tecidos no diagnóstico de uma infeção em peixes por Betanodavirus.
Palavras-chave: Encefalopatia e Retinopatia Viral (ERV), Betanodavirus, amostragem não letal, deteção, ELISA, RT-PCR em tempo real.
XI
Abstract
Currently, one of the major concerns to the industry in the Mediterranean is related with Viral Encephalopathy and Retinopathy (VER) outbreaks, since this disease is associated with high levels of mortality (up to 90-100% mortality), especially in juvenile fish. More than 120 farmed and wild species are susceptible to this disease. The etiological agent of VER is Betanodavirus, a non-enveloped two single-stranded RNA virus (ssRNA).
In recent years, the real time RT-PCR has been gaining importance as a reliable method of detection for Betanodavirus. The preferred organ for Betanodavirus detection is the brain, however, this method of screening is unsuitable for valuable broodstock. Non-lethal sampling methods, such as the use of fin or gill clips or serology, are being investigated as society becomes more concerned about animal welfare. The aim of this study was to evaluate the suitability of using these non-lethally sampled tissues as a method to detect Betanodavirus infection in European sea bass (Dicentrarchus labrax).
Four different tissues were analysed, the brain (standard organ for detection of Betanodavirus) and gills, caudal fin and blood as non-lethal tissues to access their suitability for detecting Betanodavirus infection using real time RT-PCR. European sea bass juveniles were infected with the virus, by either intramuscular injection or immersion, and tissue samples, blood and serum were collected on 7, 15 and 30 days post infection (dpi).
The ELISA allowed the detection of antibodies against Betanodavirus as early as 7 dpi. However, higher mean antibody titres were detected at 15 and 30 dpi for both infection route. The presence of Betanodavirus specific antibodies indicates that this is a suitable method to evaluate the serological status of the fish from early stages of infection and up to at least one-month post-infection.
It was possible to detect virus RNA in all tissues analysed with the real time RT-PCR. The viral load present in the non-lethal tissues was always lower than that measured in the brain tissue at all sampling points. Virus was detected in the non-lethal tissues from 7 dpi. The viral load detected in the caudal fin presented statistical significant differences between sampling days, while the gills presented differences between treatments and sampling days. As expected, the brain was the only tissue that
XII showed the presence of the virus, independent of the route of infection or the sampling day.
Presence of virus in non-lethal tissues (gills, fin clips and blood) was inconsistent and always at lower values of viral load than in the brain. Nevertheless, higher viral loads were detected in the blood of fish infected by intramuscular injection at 15 dpi until the end of the challenge.
Due to the constantly higher viral load displayed in the brain at all sampling points, reflecting the virus’ tropism for nervous tissue, it is suggested that the brain should remain as the target organ for screening fish for the detection of Betanodavirus. However, the results reveal the necessity to perform further studies regarding the use of non-lethal tissues, before undoubtedly confirming or rejecting the possibility of using them to determine a Betanodavirus infection in fish.
Key-words: Viral Encephalopathy and Retinopathy (VER), Betanodavirus, non-lethal sampling, detection, ELISA, Real Time RT-PCR.
XIII
Table of contents
1. Introduction ... 1
1.1. Production of the species Dicentrarchus labrax in aquaculture ... 1
1.2. Biology, life cycle and distribution of Dicentrarchus labrax (Linnaeus, 1758) ... 2
1.3. Betanodavirus ... 4
1.3.1. Biology and epidemiology of Betanodavirus ... 4
1.3.2. Clinical signs... 9
1.3.3. Transmission of Betanodavirus ... 9
1.3.4. Diagnosis/detection methods ... 10
1.3.5. Treatment and prevention of VER ... 11
1.4. Aim and objectives ... 12
2. Materials and Methods ... 13
2.1. Fish husbandry ... 13
2.2. Pathogen ... 13
2.3. Experimental design and virus challenge ... 13
2.4. Sampling of fish ... 15
2.5. Isolation of Betanodavirus by cell culture ... 16
2.6. ELISA (enzyme-linked immunosorbent assay) ... 16
2.7. RNA Extractions... 17
2.8. Reverse Transcriptase Polymerase Chain Reaction (RT-PCR) ... 18
2.9. Real Time RT-PCR ... 19
2.10. Statistical analysis ... 20
3. Results ... 21
3.1. Challenge in vivo ... 21
3.2. Study 1 - mortality study ... 21
3.3. Study 2 - non-lethal sampling study ... 26
4. Discussion ... 33
5. Conclusion ... 43
6. References ... 45
XV
List of figures
Figure 1.1: Aquaculture total production of Dicentrarchus labrax (Linnaeus, 1758) (Adapted from: FAO, 2016) ... 2 Figure 1.2: Dicentrarchus labrax (Linnaeus, 1758) global geographic distribution (Adapted from: FAO, http://www.fao.org/fishery/species/2291/en) ... 3 Figure 3.1: Cumulative mortality (%) observed during challenge with Betanodavirus for Study 1 after experimental infection (n=30 per group). ... 22 Figure 3.2: Endpoint antibody titres (−Log2+1) at 30 dpi for the different infection
methods. The results are presented as mean±SD (t-student, p-value>0.05). ... 22 Figure 3.3: Individual endpoint antibody titre (−Log2+1) at 30 dpi for the different infection
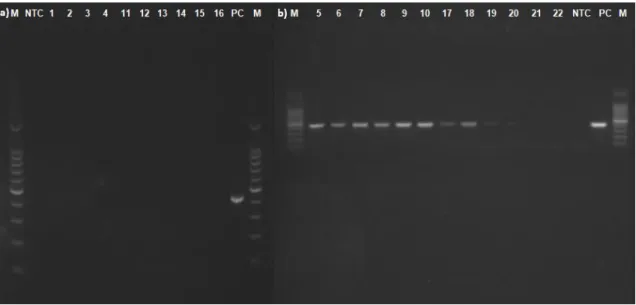
methods used in Study 1 (n=4) ... 23 Figure 3.4: Cytopathic effects (CPE) were seen in cell line in cell line SSN-1 after it was inoculated with tissue from Betanodavirus from infected and non-infected fish. a), b) and c) Infected fish showing signs of early CPE (amplification of 100x, 200x and 400x, respectively); d), e) and f) cells inoculated with infected individual at 14 days after incubation and total destruction of the cell line can be observed (40x, 100x and 100x, respectively); g) corresponds to infected cells at day 7 post inoculation (amplification of 400x); h) cells inoculated with non-infected individual at 14 days after incubation (100x) ... 25 Figure 3.5: Results obtained for the RT-PCR for the cell culture samples using a standard PCR with the F2-R3 primer pair (Nishizawa et al. 1994): a) the non-infected samples (1, 2, 3, 4 – stock; 11,12, 13 – immersion Control; and IM Control – 14, 15, 16) and b) infected samples with Betanodavirus (5, 6, 7, 8,9,10 – IM Infected moribunds; 17,18,19 – immersion Infected; 20, 21, 22 – IM Infected). NTC – no template control; PC – positive control; M = molecular size marker (100 bp ladder)... 26 Figure 3.6: Cumulative mortality (%) observed during challenge with Betanodavirus for Study 2 after experimental infection (n=30 per group). ... 27 Figure 3.7: Mean endpoint antibody titres (−Log2+1) for 7, 15 and 30 days post infection
for the different infection methods, IM and immersion, for Study 2 (n= 4 per immersion group and n=5 per IM group). The results are presented as mean±SD. Different letters/symbols represent statistical differences between treatments and days (ANOVA-2-Way, LSD, p-value<0.05). ... 28 Figure 3.8: Individual endpoint antibody titres (−Log2+1) for 7, 15 and 30 days post
infection for the different infection methods, IM and immersion, for Study 2. Each dot represents an individual (n= 4 per immersion group and n=5 per IM group). ... 29
XVI Figure 3.9: Standard curve of the mean Ct values vs 10-fold dilutions of a Betanodavirus with a known TCID50 concentration (y =−3.438(x) + 36.39, R2 = 0.9988)... 30
Figure 3.10: Results of the qPCR analysis presented as Ct mean values for each organ during Study 2 for sampling days 7, 15 and 30 (n=4 per group for immersion and n=5 per group for IM). The results are present as mean±SEM. Different symbols represent statistical differences between treatments and days (in the gills) (ANOVA-2 Way, LSD,
p-value<0.05), small letters represent statistical differences between days (in the caudal
fin) (ANOVA-2 Way, Tukey HSD, p-value<0.05), and capital letters represent statistical differences between tissues (brain) (ANOVA-2 Way, Tukey HSD, p-value<0.05) ... 32
XVII
List of tables
Table I: List of wild and farmed fish species in which Betanodavirus has been detected or isolated (is not fully comprehensive of all the affected species) ... 5 Table II: Experimental design for in vivo challenge ... 14 Table III: Conditions for the RT-PCR ... 18 Table IV: Preparation of the reaction mix for the Real Timer RT-PCR using SuperScript III Platinum One-Step qRT-PCR Kit ... 19 Table V: Thermal cycler profile for Real Time RT-PCR ... 19 Table VI: Mean values for water physico-chemical parameters obtained during in vivo challenge ... 21 Table VII: Results for the cell culture samples and the RT-PCR. The results are shown as positive or negative. The moribund collected individuals are represented with (M) . 24
XIX
List of abbreviations and symbols
AGK – Asian Grouper Kidney; CPE – Cytopathic Effect; Dpi – Days post infection;
ELISA – Enzyme-Linked Immunosorbent Assay; HBSS – Hank’s Balanced Salt Solution;
HSWB – High Salt Washing Buffer; IM – Intramuscular injection;
LSD – Least Significance Test; LSWB – Low Sal Washing Buffer; MAb – Monoclonal Antibodies; NBF – Neutral Buffered Formalin; NNV – Nervous Necrosis Virus; OD – Optical density;
PBS – Phosphate Buffered Saline Solution;
RGNNV – Red spotted grouper nervous necrosis virus; RT – Room Temperature;
RT−PCR – Reverse Transcriptase Polymerase Chain Reaction;
SSN 1 – Fish cell line obtained from Channa (Ophicephalus) striatus suitable for virus isolation (piscine nodaviruses).
TCID50 – 50% Tissue Culture Infective Dose;
VER – Viral Encephalopathy and Retinopathy; VTM – Viral Transport Medium;
1
1. Introduction
Currently, capture fisheries have been fully exploited, and therefore, there is no potential for the fisheries sector to grow. However, the aquaculture sector presents an alternative for providing seafood, finfish and shellfish, to feed the increasing global population (Brummett, 2013; FAO, 2016).
World aquaculture production of fish has contributed 44.1% of total food production (including non-food uses) in 2014. The aquaculture sector was responsible for the production of 73.8 million tonnes of aquatic animals in 2014 (FAO, 2016). There is a general trend of increasing the total fish production through aquaculture production (Subasinghe, 2005; FAO, 2016), and globally, the aquaculture sector can be seen as the fastest growing food-production sector (Subasinghe et al., 2009; Gjedrem et al., 2012). Marine aquaculture has also increased its production in the last decades, because of the economic value of reared marine species and their higher demand (Shetty et al., 2012). As aquaculture production increases, farming intensification also increases (Naylor et
al., 2000). The intensification of production, is achieved with high stocking densities and
several diseases have emerged as significant problems in probably all aquaculture species, due most likely to the high stress levels induced in the fish (Murray & Peeler, 2005).
1.1. Production of the species Dicentrarchus labrax in aquaculture
The first documented intensive rearing for Dicentrarchus labrax was made in 1970’s, when the reproductive cycle was closed with several spawning experiments for controlling reproduction performed on the Mediterranean coast (Barnabé & Tournamille, 1972; Volckaert et al., 2008). In the following years, numerous studies were made for improving the rearing/husbandry conditions, nutrition and larval survival of the stock (Volckaert et al., 2008). These studies made possible the exploitation of the European sea bass in aquaculture and its current commercialization (Volckaert et al., 2008). The European sea bass aquaculture industry has grown considerably during the last 15 years producing a few thousand tonnes in 1990 to 156.000 tonnes in 2014, demonstrating that this is one of the most successful and important species reared in aquaculture (FAO, 2016) (Fig. 1.1). Europe is the major producer of sea bass with 80% of worldwide production (Fisheries and Aquaculture in Europe, 2012). Europe and Turkey are the main producers with a share of 65.500 and 42.500 tonnes in 2012 (Hillen et al., 2014). This fish species is considered high-value, since its monetary value ranking is higher than the
2 weight ranking, however, with the development of the European sea bass aquaculture industry the over-production has been contributing to the decline of fish prices; that might explain the overall decrease in the total production between 2000 and 2002 (FAO, 2016). Currently, the price for 1 kg of a medium-size European sea bass reared in aquaculture can range from 4 to 6 euros (FAO, 2016). Different processes can be applied for rearing European sea bass, depending on the final value desired for the annual production.
Figure 1.1: Aquaculture total production of Dicentrarchus labrax (Linnaeus, 1758) (Adapted from:
FAO, 2016).
Traditionally, rearing methods involve the management of appropriate costal lagoons, where the juveniles are captured during their migration to the open sea. These individuals are reared in polyculture systems and the total production reaches a value of 50-150 kg/ha/year (FAO, 2016; Ortega, 2013). However, the most common type of production is rearing sea bass in sea-cages in coastal areas with annual production levels as high as 500-700 kg/ha/year (FAO, 2016; Ortega, 2013).
The reproduction of European sea bass is fully controlled, and the major aquaculture facilities maintain their own improved broodstock, and selective breeding for this species has been receiving increasing interest (Vandeputte et al., 2009). As European sea bass is one of the most important seawater species for the Southern Europe aquaculture, studies about the tissue distribution and diagnosis of Viral Encephalopathy and Retinopathy (VER) are very important to avoid outbreaks and optimize the rearing process (Valero et al., 2015; Carballo et al., 2016).
1.2. Biology, life cycle and distribution of Dicentrarchus labrax (Linnaeus, 1758)
European sea bass belongs to the Moronidae family and is related phylogenetically with the Serranidae family (Volckaert et al., 2008). The reproduction season for the European sea bass takes place during winter, from December/January to
3 March/June, after the adults have completed their migration to the spawning areas (Pawson et al., 2007; Vázquez & Muñoz-Cueto, 2015). Reproduction occurs at sea (Pickett & Pawson, 1994). Spawning takes place in groups in mid-water, and the pelagic eggs hatch and are transported inshore by currents to shallow coastal areas and estuaries, where they develop into juveniles and spend their first year of life (Bento et
al., 2016). The European sea bass is a gonochoric species that reaches maturity about
35 cm for males and 42 cm for females, approximately when they reach a weight of 300-400g and 500-600g, respectively (Pawson & Pickett, 1996; Ortega, 2013). The European sea bass life cycle can be separated in different phases: planktonic eggs and larvae, juveniles, adolescent and adults (Carroll, 2014).
European sea bass is a demersal species, with a distribution range from the coast of Senegal, Morocco and the Canary Islands up to the Norwegian coastlines, the Mediterranean Sea and Black Sea (Fig. 1.2) (Fritsch et al. 2007; Ortega, 2013; Vázquez & Muñoz-Cueto, 2015). It also has been reported near the waters of Iceland (Jonsson, 1992). This wide geographical distribution is related with the physiological adaptations exhibited by this species, which allows the animal to survive in a diverse range of temperatures (from 2°C up to 32°C) and salinity (Barnabé, 1990; Vázquez & Muñoz-Cueto, 2015).
Figure 1.2: Dicentrarchus labrax (Linnaeus, 1758) global geographic distribution (Adapted from:
FAO, http://www.fao.org/fishery/species/2291/en).
This species habits deep waters in coastal areas (as low as 100 meters) (Volckaert et al., 2008), being observed in gravelly zones or rocky bottoms, or the open sea and can enter in estuaries, lagoons, and occasionally, rivers or salt marshes (Pickett
et al., 2004; Ortega, 2013). The fully mature individuals go through seasonal migrations
between the feeding areas and the spawning territories, dispersing during the winter months (Carroll, 2014). The adults of this species feed mostly on crustaceans, molluscs and some species of fish, polychaetes, aquatic insects, snails and seagrasses or
4 seaweeds (Laffaille et al., 2001; Spitz et al., 2013; Vázquez & Muñoz-Cueto, 2015), fishing during the night and using ambushes, catching their prey against the currents and hiding in inlets (Vázquez & Muñoz-Cueto, 2015). The European sea bass is a species with a key role in the littoral food web, since it allows the transference of organic matter between different levels and environments, serving as a basic prey for several species of fish, aquatic birds and mammals (Laffaille et al., 2001).
1.3. Betanodavirus
One of the major constrains to European sea bass aquaculture sector is the economic losses that result due to outbreaks of disease caused by various infectious agents (Subasinghe, 2005; Qi et al., 2009; OIE, 2016). Viral diseases are considered to be the ones that pose major risk to the aquaculture production due to the high mortalities associated with these worldwide (Shetty et al., 2012).
One of the diseases that is recognized as a major treat to Mediterranean and Asian marine aquaculture is VER, due to the high mortalities registered in affected species (Gomez et al. 2009; Vendramin et al. 2013; Kara et al. 2014; Costa & Thompson, 2016). This disease has a worldwide distribution, including the Mediterranean region, UK, Norway, North America, Caribbean, Australia, and South and East Asia (OIE, 2016). VER affects more than 120 species of wild and farmed fish, some invertebrate species and especially marine fish (Costa & Thompson, 2016). The most affected species are striped jack (Pseudocaranx dentex), European sea bass (Dicentrarchus labrax), groupers and soles (Table I) (Munday et al., 2002; OIE, 2016).
1.3.1. Biology and epidemiology of Betanodavirus
The first record of this disease was an event of mass mortality of European sea bass in French Martinique (Bellance and Gallet de Saint-Aurin, 1988). In 1990 a viral agent was described that was responsible for affecting the central nervous system and the retina of fish in a hatchery-reared aquaculture of parrotfish (Oplegnathus fasciatus) in Japan and in barramundi larvae (Lates calcarifer) in Australia (Glazebrook et al., 1990; Yoshikoshi & Inoue, 1990). Several observations under light microscopy and electron microscopy revealed “conspicuous vacuolation and pyknosis in the spinal cord, spinal ganglia and brain of affected fish, and non-enveloped icosahedral particles in the tissues” and “picorna like viral particles” (Glazebrook et al., 1990; Yoshikoshi & Inoue, 1990).
5 Table I: List of wild and farmed fish species in which Betanodavirus has been detected or isolated (is not fully comprehensive of all the affected species).
Species Common name Order Countries Reference
Anguilla anguilla European eel Anguilliformes Taiwan, Spain
Lai et al., 2001 Chi et al., 2003 Bandín et al., 2014 Dicentrarchus labrax European sea bass Perciformes
Martinique, France, Greece, Malta, Italy,
Spain, Portugal
Bellance & Gallet, 1988 Skliris et al., 2001
Bovo et al., 1996 Cutrin et al., 2007
Diplodus sargus sargus White seabream Perciformes Spain García-Rosado et al., 2007
Toffolo et al., 2007
Epinephelus akaara Redspotted grouper Perciformes Taiwan, China Chi et al., 1997
Lin et al., 2001 Epinephelus coioides Orange spotted Grouper Perciformes China, Philippines,
Australia
Lin et al., 2001 Maeno et al., 2002 Moody et al., 2009 Epinephelus marginatus Dusky grouper Perciformes Tunisia, Algeria Haddad-Boubaker et al., 2014
Kara et al., 2014 Epinephelus
septemfasciatus Sevenband grouper Perciformes Japan
Fukuda et al., 1996 Kokawa et al., 2008
Gadus morhua Atlantic cod Gadiformes U.K., Canada, Norway
Starkey et al., 2001 Johnson et al., 2002
Nylund et al., 2008 Hippoglossus
hippoglosus Atlantic halibut Pleuronectiformes Norway, U.K.
Grotmol et al., 1997 Starkey et al., 2000
6 Lates calcarifer Asian sea bass/Barramundi Perciformes Israel, Taiwan, Malaysia,
India
Azad et al., 2005 Banerjee et al., 2014 Ransangan et al., 2010
Ucko et al., 2004
Oplegnathus fascinatus Japanese parrotfish Perciformes Japan Yoshikoshi & Inoue, 1990
Oreochromis niloticus Nile tilapia Perciformes France, Thailand Bigarré et al., 2009
Keawcharoen et al., 2015
Paralichthys olivaceus Japanese flounder Pleuronectiformes Japan Kang et al., 2003
Nguyen et al., 1994
Poecilia reticulata Guppy Cyprinodontiformes Singapore Hedge et al., 2002
Nazari et al., 2014
Pseudocaranx dentex Striped jack Perciformes Japan, Australia
Mori et al., 1992 Arimoto et al., 1993
Moody et al., 2004
Scophtalmus maximus Turbot Pleuronectiformes Denmark, Norway Bloch et al., 1991
Johansen et al., 2004 Solea senegalensis Senegalense sole Pleuronectiformes Spain, Portugal
Thiéry et al., 2004 Cutrin et al., 2007 Oliveira et al., 2009 Sparus aurata Gilthead seabream Perciformes France, Spain, Portugal,
Tunisia
Thiéry et al., 2004 Cutrin et al., 2007 Oliveira et al., 2009
7 The disease was designated as viral nervous necrosis (VNN) in 1990 (Yoshikoshi & Inoue, 1990), and then as encephalomyelitis (Bloch et al, 1991), or viral encephalopathy and retinopathy (VER) (Munday et al., 1992). Based on the characteristics of Striped Jack NNV (SJNNV), such as the genome and the virion size, this virus was identified as belonging to the Nodavirus family (Mori et al., 1992). The Nodavirus family has two genera, but just one (Betanodavirus) affects fish (Costa & Thompson, 2016).
Betanodavirus are icosahedral non-enveloped virus, with a spherical form and have approximately 25-30 nm in diameter; their genome consists in two single-stranded positive-sense RNA molecules: RNA1 with 1.01×10⁶ Da, responsible for encoding the
catalytic part of the RNA-dependent RNA polymerase (RdRp) that allows the replication of the genome, and it is also involved in the regulation of the virus sensitivity to temperature (Hata et al., 2010; Panzarin et al., 2014); RNA2 with a weight of 0.49×10⁶
Da, encodes the coat protein (Nishizawa et al., 1995).
According to the variable region (T4-region) in the RNA2 molecule, Betanodavirus can be classified into four different genotypes: red spotted grouper nervous necrosis virus (RGNNV) (Epinephelus akaara), striped jack nervous necrosis virus (SJNNV) (Pseudocaranx dentex), barfin flounder nervous necrosis virus (BFNNV) (Verasper moseri) and tiger puffer nervous necrosis virus (TPNNV) (Takifugu rubripes) (Nishizawa et al., 1997). The designations for the different genotypes are related with the fish species where they were first isolated (Chi et al., 2001).
The ability of Betanodavirus to infect different fish species depends on the Betanodavirus coat protein that differs according to the RNA2 gene (genotype), and the water temperature (RNA1) (Iwamoto et al., 2004). The distinct genotypes have different optimal growth temperatures, RGNNV 25-30°C; SJNNV 20-25°C; TPNNV 20°C; BFNNV 15-20°C) (Iwamoto et al., 2000; OIE, 2016).
The BFNNV is found in cold-water species such as the Atlantic cod (Gadus
morhua), haddock (Melanogrammus aeglefinus), Atlantic halibut (Hippoglossus hippoglossus), Pacific cod (Gadus macrocephalus), Dover sole (Solea solea; Solea vulgaris), turbot (Scophthalmus maximus), barfin flounder (Verasper moseri) and was
isolated in Norway, Scotland, France, Japan and along the east coast of the North America (Bloch et al., 1991; Watanabe et al.,1998; Grotmol et al., 2000; Gagné et al., 2004; Starkey et al., 2000; Starkey et al., 2001; Shetty et al., 2012). RGNNV has a wider
8 geographic distribution compared to the other genotypes since it can be found in Japan, French Polynesia, Asia, Australia, Mediterranean Sea, North of France and the USA (Nishizawa et al., 1995; Nishizawa et al., 1997; Skliris et al., 2001; Johansen et al. 2004) and infects many fish species such as European sea bass (Dicentrarchus labrax), Asian sea bass (Lates calcarifer), humpback grouper (Chromileptes altivelis), red spotted grouper (Epinephelus akaara) and gilthead seabream (Sparus aurata) (Carballo et al., 2016; Nakai et al., 2009; Nishizawa et al., 1997; Toffan et al., 2017; Yuasa et al., 2007). The SJNNV genotype is known to affect Striped jack (Pseudocaranx dentex), Atlantic halibut (Hippoglossus hippoglossus) and greasy grouper (Epinephelus tauvina), and it is restricted to the japanese waters (Tan et al., 2001; Nagai et al., 1999; Costa & Thompson, 2016). The TPNNV genotype affects a single fish species, the tiger puffer (Takifugu rubripes) (Costa & Thompson, 2016).
The existence of reassortment between RNA1 and RNA2 genes was confirmed in Betanodavirus isolates (Toffolo et al., 2007; Panzarin et al., 2012). In Italy and Croatia, a reassortment virus was isolated from European sea bass, with an RNA1 segment originated from the SJNNV genotype and RNA2 segment from the RGNNV (SJNNV/RGNNV) (Toffolo et al., 2007). Another reassortment was reported in the Iberian Peninsula with a RNA1 segment derived from the RGNNV genotype and the RNA2 segment from the SJNNV genotype (RGNNV/SJNNV) and was isolated from European sea bass, gilthead sea bream and Senegalese sole (Cutrin et al., 2007; Toffolo et al., 2007). In vivo studies performed with both Betanodavirus reassortments shown that they can induce the development of a VER infection (Olveira et al., 2009; Toffan et al., 2017). In a study published in 2010, it was showed that SJNNV and RGNNV genotypes coexist in wild meagre (Argyrosomus regius), which can explain the existence of genetic reassortments between both genotypes (Lopéz-Jimena et al., 2010).
Mass mortalities occur depending on the life stage and the fish species (Munday & Nakai, 1997; Péducasse et al., 1999). Studies have been shown that mortality in the infected animals is aged related, with younger fish more susceptible to the disease (Munday & Nakai, 1997; Péducasse et al., 1999). This disease frequently occurs in larval and juvenile stages of marine fish species (Nguyen et al., 1996; Munday & Nakai, 1997; Péducasse et al., 1999; Lin et al., 2007), nevertheless, significant mortalities have been observed in more advanced life stages, severely affecting production, particularly with European sea bass (Breton et al., 1997; Munday et al., 2002).
9 1.3.2. Clinical signs
The clinical signs caused by Betanodavirus can differ between the fish species, nevertheless there are several symptoms that characterize this disease, such as abnormal coloration (dark or pale coloration), lethargy, reduced appetite, gas accumulation, anorexia, opacity of the cornea or a bilateral exophthalmia, slow or inactive behaviour, floating upside down at the water surface at rest or staying in the bottom quietly, swim bladder hyperinflation and altered swimming behaviour: spinning, rotating, horizontal looping, uncoordinated darting, corkscrew swimming (Munday & Nakai, 1997; Breton et al., 1997; Péducasse et al., 1999; Munday et al., 2002; Parameswaran et al., 2008; Shetty et al., 2012; Costa & Thompson, 2016).
1.3.3. Transmission of Betanodavirus
As a disease, VER can be transmitted both vertically and horizontally (Glazebrook et al., 1990; Arimoto et al. 1993; Nguyen et al. 1996; Grotmol et al., 1999; Skliris & Richards, 1999; Grotmol & Totland, 2000; Castric et al., 2001; Breuil et al., 2002; Azad et al., 2006; Kai et al., 2010).
Betanodavirus has been detected in ovarian tissues, sperm, fertilized eggs and hatched larvae, confirming its vertical transmission (Dalla Valle et al., 2000; Valero et al., 2015). It is also possible that the virus can be carried in the gonads of broodstock and in other organs (due to the stress originated during spawning) (Valero et al., 2015). Other results suggested Betanodavirus could be spread into the fish germ cells and in the gonadal fluid (Dalla Valle et al., 2000; Mushiake et al., 1994; Valero et al., 2015; Costa & Thompson, 2016). The virus has the ability of colonize and replicate in the testis of gilthead sea bream and European sea bass. Also, it has the capability of modulating their reproductive function, since the presence of the virus can change the sensitivity of the brain and testis to specific hormones in both species (Valero et al., 2015). The horizontal transmission of this virus was confirmed in numerous cohabitation assays and it was proved that the viral particles could survive in water (OIE, 2016).
Some species of invertebrates can act as vectors and become natural reservoirs for the virus, aiding in its transmission. Some species have been described as vectors, such as the sand worms, from the genus Nereis (spreading the Betanodavirus through their commercialization) (OIE, 2016), bivalves Mytilus galloprovincialis, spiny lobster
10 copepod Tigriopus japonicus, the brine shrimp Artemia salina and the rotifer Brachionus
plicatilis (Sudhakaran et al., 2006; Gomez et al., 2008; Costa & Thompson, 2016). Also,
fish or mollusc species, such as the Japanese mackerel (Trachurus japonicus) and the Japanese squid (Todarodes pacificus) are used for feeding carnivorous species in aquaculture and these can be infected with VER and transmit the virus to the reared species (Nuñez-Ortiz et al., 2016a). Due to its ability to spread through the water in the rearing systems and between generations of fish, that can be asymptomatic carriers of the virus, VER represents a major treat to aquaculture.
1.3.4. Diagnosis/detection methods
The clinical signs displayed by the animals infected with Betanodaviruses are very characteristic, but it is necessary to access a rapid preclinical state of the infection to prevent the manifestation of symptoms. There are several methods for diagnosing VER such as histology, immunohistochemistry, isolation of virus in a susceptible cell line (e.g. SSN-1 or E11), in situ hybridization, reverse transcription polymerase chain reaction (RT-PCR), quantitative PCR (real time or q-PCR), nested PCR, antibody-based identification, like enzyme linked immunosorbent assay (ELISA), indirect florescent antibody tests (IFAT) and LAMP (Valle et al., 2005; Goswami et al., 2012 ; Shetty et al., 2012; Costa & Thompson, 2016; Doan et al., 2016). Also, histopathological analysis is a major tool in Betanodavirus diagnostic and findings revealed abnormalities present in the nervous central system, characterized by vacuolation and necrosis in these tissues in all the susceptible fish species (Munday et al., 2002; Shetty et al., 2012; Costa & Thompson, 2016). The anterior brain is one of the most affected organs, when compared to the posterior brain and the spinal cord (Munday et al., 2002). Vacuolation of the neurone soft encephalic ganglia and the spinal ganglia was observed in Atlantic halibut juveniles (Grotmol et al., 1997). Other described lesions include shrinkage, basophilia, granularity of the neuropil, the presence of mononuclear cell infiltration, pyknosis and cell lysis (Yoshikoshi & Inoue, 1990; Munday et al., 2002; Costa & Thompson, 2016). The endothelial cells of the blood brain vessels can be congested due to an inflation of the endothelial lining. Vacuolated cells were detected in the bipolar and ganglionic nuclear layer of the retina in infected European sea bass (Breton et al., 1997).
For diagnosis purposes, it is usual to collected tissue samples from fish using lethal sampling techniques, except for broodstock, from which seminal and ovarian fluids can be collected and analysed (Burbank et al., 2017). Non-lethal sampling methods
11 become more desirable for sampling valuable individuals, such as broodstock or rare species, or repetition of the sampling procedure. Also, the sacrifice of animals for research purposes is becoming more restricted due to ethical considerations regarding animal welfare (Drennan et al., 2007; Blessing et al., 2010; Henderson et al., 2016). Non-lethal sampling methods also have other advantages, since they can be more easily applied in the field for sample collection and the fish sexual fluids are not always available for collection (Burbank et al., 2017). Non-lethal sampling methods for diagnosis purposes are gaining more importance, since they can be a reliable alternative to invasive diagnosis methods. However, it is necessary to evaluate and establish if the non-lethal sampling methods are as suitable for diagnosis purposes as lethal sampling methods. The comparison between these methods is required to understand the most suitable sampling method to be implemented for diagnosis and avoid the spreading of an infection (Burbank et al., 2017). Several different methods have been used for detecting viral (Monaghan et al., 2014; Collet et al., 2015; Lopez-Vázquez et al., 2006), bacterial (Elliot et al., 2015; Monte et al., 2016; Tavares et al., 2016) and parasite (Fox
et al., 2000; Ek-Huchim et al., 2012; Krkošek et al., 2016) infections in fish with the target
tissues being selected according to the infection route. Different types of non-lethal material can be collected, including sampling blood by venipuncture, biopsy, faeces collection and mucus swabs, for detecting infectious disease in fish (Tavares et al., 2015). The most common non-lethal methods for analysing the presence of Betanodavirus in fish included taking samples in eggs, ovary and seminal fluids by RT-PCR and the detection of specific antibodies in collected fish serum (ELISA) (Krishnan
et al., 2016).
1.3.5. Treatment and prevention of VER
To avoid an outbreak of this disease, it is necessary to apply and develop a set of management practices such as, screening the broodstock, better husbandry practices, good quality water, quality of the fish’s feed, use of immunostimulants (probiotics, prebiotics, etc.), or good sanitation (Costa & Thompson, 2016).
Betanodavirus is a very stable virus, and because of this can be very difficult to eradicate from an aquaculture facility, since the virus is resistant to exposure of pH 2-9 for 30 min and to heat treatment at 50°C for 1 h (Arimoto et al., 1996; Frerichs et al., 1996; Frerichs et al., 2000). Chemicals have been studied to verify their efficacy in eliminating or inactivating Betanodavirus, including epinecidin-1 or hepcidin 1-5, cyclic shrimp anti-lipopolysaccharide factor (cSALF), furan-2yl-acetate, gymnemagenol,
12 dasyscyphin C (Wang et al. 2010; Khanna et al., 2011; Ichinose et al., 2013). The virus can be inactivated at pH 12 and with sodium hypochlorite, calcium hypochlorite, benzalkonium chloride or iodine. The use of heat treatment, ultra-violet light (UV) and ozone also proved to be effective (Chia et al., 2010; Krishnan et al., 2010; Suthindhiran
et al., 2010; Wang et al., 2010; Khanna et al., 2011).
Another method for preventing a VER outbreak is related with fish immunization. Currently, there are numerous studies for evaluating the efficiency of vaccines against Betanodavirus, however there is still no commercial vaccine available except for one RGNNV vaccine available for the seven-band grouper (Epinephelus septemfasciatus) (OIE, 2016). The vaccination of the broodstock would be another measure to prevent a VER outbreak, since it would stop the virus from spreading to the eggs and prevent the adults from being affected (Frerichs et al., 2000; Kai et al., 2010; Costa & Thompson, 2016).
1.4. Aim and objectives
The aim of this study was to verify if it was possible to detected Betanodavirus with non-lethal sampling methods for diagnosis purposes.
13
2. Materials and Methods
2.1. Fish husbandry
European sea bass (n=700, average size= 6.6g±0.01) were obtained from a hatchery in Portugal (Atlantik Fish Lda., Castro Marim). The juveniles were acclimatized for four weeks in a 2000 L (2 m3) fiberglass tank and fed with a commercial pellet ad
libitum three times per day. On arrival ten fish were randomly selected and euthanized
to screen for the presence of Betanodavirus by RT-PCR. During acclimation the fish were kept at a water temperature of 22.2°C±1 with a salinity of 32.6±1 and density of 2.45 kg m-3.
In order to evaluate the growth of the fish, one hundred fish were anaesthetised with 2-phenoxyethanol (Sigma-Aldrich, USA) (0.5 mL L−1) and weighted.
Once the fish reached 10.6g±0.01, the fish were transferred to the pathology suite to be challenged, as described in Section 2.3.
2.2. Pathogen
The Betanodavirus (ARG/VIR/2016-02) belonging to the RGNNV genotype used for challenging the fish was produced at the Moredun Research Institute. The virus was cultured in AGK cells (Asian Grouper Kidney) at 26°C until a full cytopathic effect (CPE) was observed.
The concentration of the virus was determined by calculating the virus titre (number of infectious units per unit volume) as 50% tissue culture infective dose per mL (TCID50 mL-1). Infectivity titrations were performed with SSN-1 cell lines. The virus titres
were calculated by the method of Spearman-Karber (Hierholzer & Killington, 1996).
2.3. Experimental design and virus challenge
Once the fish reached 10.6g±0.01, they were allocated into 8 tanks (16 L) with 30 fish added per tank, with a density of 18kg m-3. The water was maintained with a
14 Each tank had an independent recirculating system with an UV light (TMC®, Des
Moines, USA) and a protein skimmer (TMC® Aquarium, Chorleywood, UK) for ensuring
the maintenance of the water quality throughout the experimental period. During the challenge, the salinity was measured daily with a refractometer (Hanna Instruments Inc, Rhode Island, USA), and temperature and dissolved oxygen were controlled daily with a HI9147-04 multiparameter probe (Hanna Instruments Inc, Romania). Once a week, the concentration of ammonia and nitrites were determined with the use of commercial kits (API®, Pennsylvania, USA). During the challenge, the tanks were cleaned daily and 30%
of the water changed daily. The fish were fed with a commercial pellet, three times a day
ad libitum.
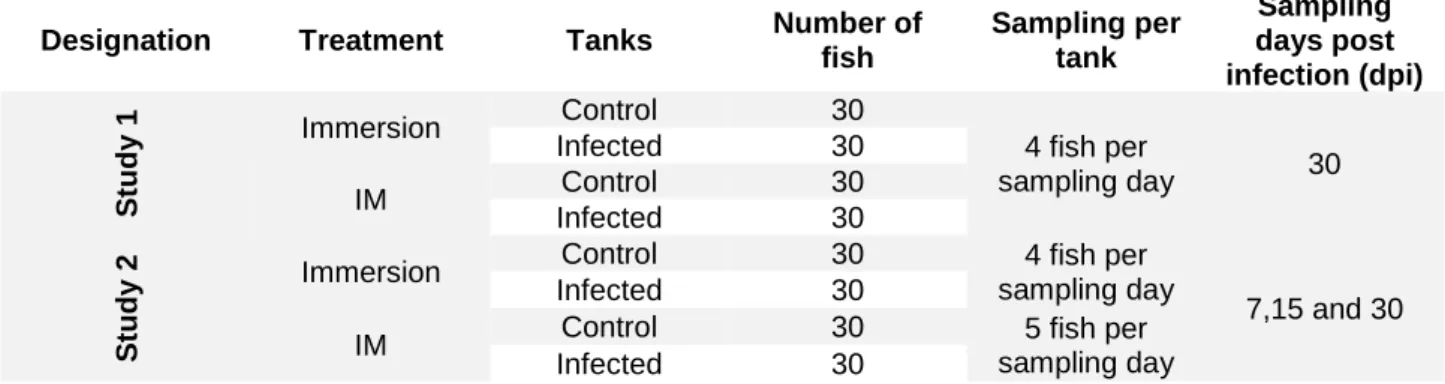
Two different trials were performed at the same time: Study 1 – examined mortality; and Study 2 – for the non-lethal sampling. In both studies the in vivo challenges were performed with two different infection routes: immersion or intramuscular injection (IM) (see Table II). Each study and infection route had a virus infected group and a non-infected control group.
Table II: Experimental design for in vivo challenge.
Designation Treatment Tanks Number of
fish Sampling per tank Sampling days post infection (dpi) S tu d y 1 Immersion Control 30 4 fish per sampling day 30 Infected 30 IM Control 30 Infected 30 S tu d y 2 Immersion
Control 30 4 fish per sampling day
7,15 and 30 Infected 30
IM Control 30 5 fish per
sampling day Infected 30
For the immersion infection, 60 fish were transferred to a tank containing a 106
TCID50 mL-1 of Betanodavirus, at a density of 80 kg m-3, where they were kept for one
hour. For both the immersion infected and control tanks, the fish were submitted to the same conditions, but the water in control tanks did not contained the virus. After one hour, the fish were transferred to the challenge tanks system.
For the IM infection, the fish were anaesthetized with 2-phenoxyethanol (0.5 mL L−1) and injected with 100 µL of 107 TCID
50 mL-1 of Betanodavirus near the caudal fin.
The control fish were injected with phosphate buffered saline solution (PBS 1x). After this procedure, the fish were carefully placed in the designated tanks. The tanks were
15 monitored twice a day for any clinical signs, and dead or moribund fish were removed from the tanks.
Moribund fish were sampled with the brain been collected into RNAlater (Thermo Fisher Scientific, Vilnius, Lithuania) and viral transport medium (VTM) (Becton, Dickinson and Company, Maryland, USA) and stored at −80°C until analysed. The trials lasted for 4 weeks and mortalities were recorded daily.
2.4. Sampling of fish
The fish were euthanized with an overdose of 2-phenoxyethanol (0.5 mL L−1) and the sampling process was performed immediately after. On day zero pre-challenge, the organs (brain, gills and caudal fin) and blood of ten stock fish were sampled. From Study 1, four fish per tank were sampled 30 days post infection (dpi). In Study 2, five fish per tank were sampled for the IM infected individuals and four fish per tank were sampled for the immersion infected individuals, on 7, 15 and 30 dpi.
The fish were anaesthetised, and the first to be sampled was the blood. The blood samples were collected from the caudal vein with a 22-gauge needle and 1 mL syringe (both sterile). After collecting the blood, the samples were transferred into 1.5 mL tubes and the blood was allowed to clot at 4°C overnight. The following day the samples were centrifuged at 7000g for 7 min (Eppendorf AG, Hamburg, Germany). Serum was collected, aliquoted and stored at −80°C. RNAlater was then added to the blood clot, which stored at −80°C.
After the blood collection, the targeted organs were removed. The caudal fin, gills and brain were collected into RNAlater (1 vial per organ per individual). The tissues were cut into smaller pieces and for each organ a different sterile scalpel was used. Each cryovial was pre-filled with 1 mL RNAlater and the weight was recorded. After adding the samples, the RNAlater cryotubes were weight again, left overnight at 4°C, and on the following day the RNAlater cryotubes with tissues were stored at −80°C. During the sampling procedure, the fish from control tanks were always sampled first, and the brain was always the first organ to be collected. For the cell culture, the brains were collected and placed into viral transport medium (VTM) vials and stored at −80°C. All the dissection instruments were disinfected between individuals with 70% ethanol.
16 2.5. Isolation of Betanodavirus by cell culture
The brain samples collected from IM infected and immersion infected fish, and respective controls, (n=4 from stock, n=3 from IM control, n=9 from IM infected, including moribunds, n=3 from immersion control and n=3 from immersion infected) were homogenised with mortar and pestle in Hanks’ Balanced Salt Solution supplemented with Penicillin (300 IU mL-1), Streptomycin (300 µg mL-1) and Kanamycin Sulphate (300
µg mL-1) (HBSS/PenStrepKan). Each sample was diluted in the appropriated volume of
HBSS/PenStrepKan in order to have a final sample diluted 1:10 (tissue weight: diluent volume). The homogenised samples were centrifuged at 2600g, for 15 min at 4°C (Sigma 4K15). After centrifugation the supernatant was collected and filtered (0.45 µm filter, Sartorius) for reducing the bacterial load.
The samples were inoculated in triplicate (100 µL well-1) into 24 well plates with
SSN-1 cells (passage 1 of the virus). The samples were inoculated by simultaneous inoculation and onto pre-formed monolayers (at a confluence of 70%). The plates were incubated at 26°C, observed regularly and the CPE recorded. After 7 days, 100 µl of each well were transferred (blind passage, passage 2) into a well with fresh SSN-1 cells (24 well plates) and incubated for another 7 days. The cells were observed for CPE and after the 7 days period, the cell culture supernatant from passage 2 wells was collected and used for extracting viral RNA to confirm the virus growth observed by CPE. All the cell culture supernatants were collected and stored at -80°C.
All the cell culture reagents were acquired from Gibco, Paisley, Scotland.
2.6. ELISA (enzyme-linked immunosorbent assay)
ELISA plates (Greiner Bio-one, Germany) were coated with 50 µL per well-1 of
0.01% poly-L-lysine and incubated during 60 min at room temperature (RT). After the adsorption of poly-L-lysine the wells were washed 3 times with LSWB (Low Salt Washing Buffer, pH 7.3) and 100 µL of antigen (virus supernatant, 106 TCID
50 mL-1) was added to
each well and incubated at 4°C overnight. The next day, 50 µL well-1 of 0.05%
glutaraldehyde was added to each well and incubated for 20 min at RT. Then, the plates were washed 3 times with Low Salt Washing Buffer (LSWB), was added 250 µL well-1 of
blocking buffer (3% skimmed milk) (Premier Foods, London, UK) and blocked for 2 h at 22°C. Meantime, doubling dilutions of fish serum in PBS (1x) (starting with 1:32 dilution) were prepared for each serum sample. The blocking buffer was tapped off, 100 µL of
17 diluted fish serum was added to each well, and the plates were incubated overnight at 4°C. PBS (1x) was used as negative control and as positive control European sea bass serum with anti-Betanodavirus was used (1:128 in PBS 1x). The wells were washed 5 times with High Salt Washing Buffer (HSWB) and soaked during 5 min on the last wash. Anti-European sea bass IgM MAb (Aquatic Diagnostics Ltd, Stirling Scotland), diluted at 1:150 in antibody buffer was added to each well (100 µL well-1) and incubated for 60 min
at RT. The plates were washed 5 times with HSWB and soaked for 5 min on the last wash, before adding 100 µL of goat anti-mouse IgG-conjugated with horseradish peroxidase (HRP) to each well, and incubated for 60 min at 22°C. The washing procedure with HSWB was repeated. After this step, substrate was added to each well at 100 µL well-1 and incubated during 10 min at 22°C. The reaction was stopped by
adding 50 µL well-1 of stop solution. The plates were read at 450 nm in the ELISA reader
(Promega, Southampton, UK).
The serum samples from both infected and non-infected fish were analysed in duplicate. The average of the negative control was calculated. A sample was considered positive when its value was 3 times higher than the negative control average.
With the 2-fold dilutions used in each ELISA assay (starting in 1:32), it was possible to calculate the antibody titres expressed as a −Log2+1 value. The −Log2+1
values were obtained with the corresponding optical density (OD at 450 nm) values considering the last dilution in which it was possible to record a positive OD value.
Except when mention all the reagents used in the ELISA were purchased from Sigma-Aldrich, UK.
All the reagent formulations are described in Appendix I.
2.7. RNA Extractions
The sampled organs were placed in a 1.5mL sterile tube and homogenized with a mortar and pestle and the appropriated buffer provided in the RNeasy Mini Kit (Qiagen, Hilden Germany). The homogenised tissue was then placed into the kit columns and the procedure was performed according to the manufacture instructions.
The blood clot samples preserved in RNALater were centrifuged at 12000 g and the blood clot was retrieved from the RNAlater. The blood clot was weighted, and the
18 RNA extraction was performed with a QIAamp RNA Blood Mini Kit (Qiagen, Hilden Germany). As suggested by the manufacturer’s instructions, the homogenized cell lysates were stored at −80°C for 24 h and the extraction process was then continued. All extractions were performed according to the manufacture instructions.
A QIAamp Viral Mini Kit (Qiagen, Hilden Germany) was used to extract viral RNA from the cell culture supernatant. A 140 µL volume was collected from all cell culture wells and the viral RNA was extracted following the extraction kit instructions.
All the RNA samples were stored at −21°C until used.
The Nanodrop Spectrophotometer (Thermo Fisher Scientific, Massachusetts, USA) was used for evaluating the RNA concentration from all the samples. The RNA purity was assessed by the ratios 260/280 nm and 260/230 nm.
2.8. Reverse Transcriptase Polymerase Chain Reaction (RT-PCR)
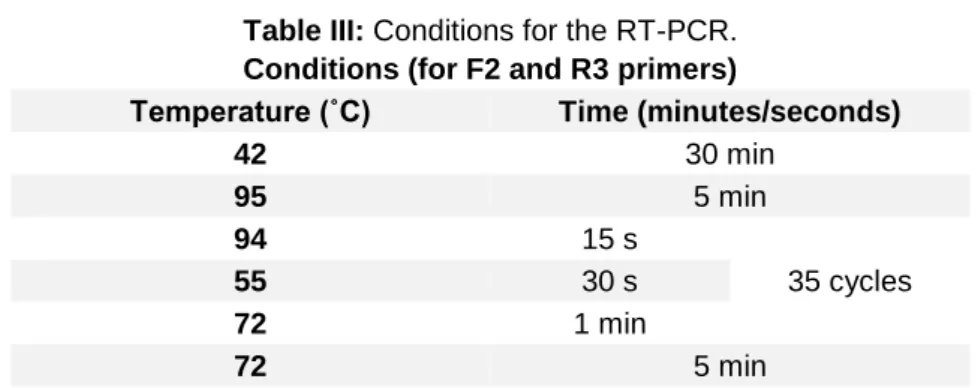
The RT-PCR was performed with SuperScript One Step RT-PCR with Platinum Taq Kit (Invitrogen, Carlsbad USA). To prepare the PCR reaction solution with a final volume of 25 µL, each sample contained 12.5 µL of Reaction Mix (1x), 0.5 µL of 10 µM of sense and anti-sense primers (F2 and R3) (Nishizawa et al., 1994), 0.5 µL of RT-Platinum Taq Mix. The PCR reaction solution was briefly mixed by vortexing and to each 0.2 mL micro-centrifuge tube (Axygen, USA) 22.5 µL of the Reaction Mix was added and then 2.5 µL of the desired extracted RNA sample. The microcentrifuge tubes were briefly centrifuged and placed in the Biometra Tone Analytik Jena thermal cycling for RT-PCR following the reverse transcriptase and amplification conditions described in Table III.
Table III: Conditions for the RT-PCR. Conditions (for F2 and R3 primers)
Temperature (˚C) Time (minutes/seconds)
42 30 min 95 5 min 94 15 s 35 cycles 55 30 s 72 1 min 72 5 min
After amplification of the viral RNA, the samples were loaded onto a 1.5% agarose gel (Bioline, London, UK) in TAE buffer (Sigma Aldrich, Missouri, USA) stained with Gel Red (Biotium, Fremont, USA). A DNA ladder Hyper Ladder 100 bp (Promega,
19 Southampton, UK) was added to each gel to verify the product size. The gel was electrophoresed at 150 V for 100 min (Bio-Rad Laboratories Ltd., Hertfordshire, UK). The viral RNA fragments were visualized using a UV Transilluminator (Alpha imager 2200).
2.9. Real Time RT-PCR
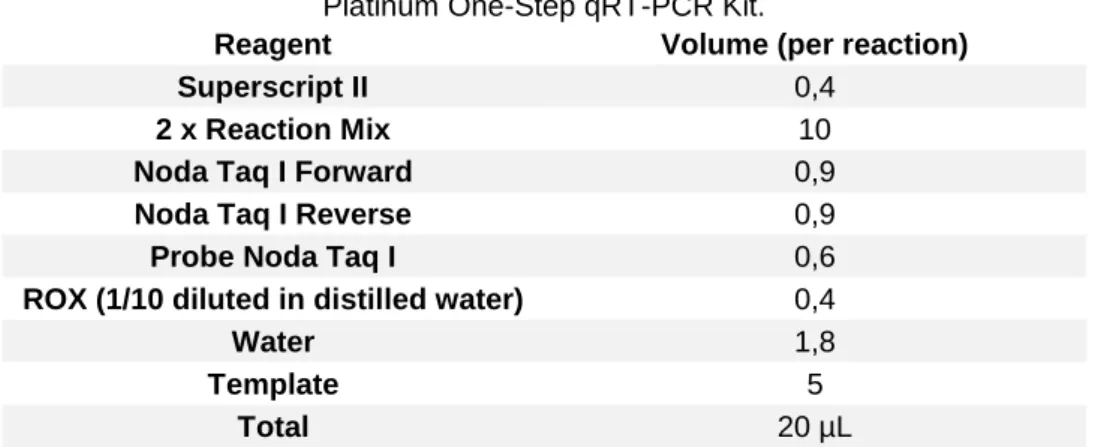
Real-time RT-PCR was performed using a SuperScript III Platinum One-Step qRT-PCR Kit (Invitrogen, California USA). The final volume for each one of the reactions was 20 µL, with 5 µL of sample and 15 µL of Master Mix. The primers used were the
Noda Taq1-FW: CAACTGACARCGAHCACAC and Noda Taq1-RV:
CCCACCAYTTGGCVAC, while the probe was Noda Taq1-probe: CARGCRACTCGTGGTGCVG (Panzarin et al., 2010). The primers and target probe (Sigma-Aldrich, USA) were used with a final concentration of 10 µM. The master mix was prepared according to the Table IV and was added to MicroAmp optical 96 well reaction plate (Applied Biosystems, California USA).
Table IV: Preparation of the reaction mix for the Real Timer RT-PCR using SuperScript III
Platinum One-Step qRT-PCR Kit.
Reagent Volume (per reaction)
Superscript II 0,4
2 x Reaction Mix 10
Noda Taq I Forward 0,9
Noda Taq I Reverse 0,9
Probe Noda Taq I 0,6
ROX (1/10 diluted in distilled water) 0,4
Water 1,8
Template 5
Total 20 µL
The templates were loaded into the respective wells (5 µL), the plate was sealed with the plate sealer, and briefly centrifuged. The plate was placed in an Applied Biosystems 7500 Real-Time PCR System and the assay performed following the conditions described in Table V. Once the data was acquired, it was exported and analysed with the 7500 Applied Biosystems Software version 2.3.
Table V: Thermal cycler profile for Real Time RT-PCR. Thermal Cycler Profile
Stage Repetitions Temperature (°C) Time (min)
1 1 55.0 10:00
2 1 95.0 05:00
3 40 95.0 00:15
20 For each real-time RT-PCR assay a standard curve was prepared, in triplicates, with 10-fold serial dilutions of RNA extract from a Betanodavirus supernatant with a known concentration of infective particles (107.75 TCID
50 mL-1). The results of four
real-time RT-PCR standard curves, efficiencies from 90 to 97.05 and R2 higher than 0.994
(automatically calculated with the 7500 Software for Real Time PCR systems version 2.3) were used to calculate the average of the mean of the Ct value for each viral dilution. The results were plotted as a linear regression with the mean Ct values on the Y-axis and 10-fold Betanodavirus dilution on the X axis. This allowed to obtain the equation of the line (y=mx+b) that permits to calculate the TCID50 mL-1 of unknown samples.
2.10. Statistical analysis
To analyse the endpoint antibody titres for the mortality study (Study 1), a t-student test (Zar, 2010) was performed in order to verify statistical differences between the infection routes (IM and immersion) at 30 days post infection (dpi). For analysing the endpoint antibody titres for the non-lethal study (Study 2), an analysis of variance two-way (ANOVA-2 Way) with replication, followed by a Least Significance Difference (LSD) test (Zar, 2010) was performed to evaluate statistical significant differences between treatments (IM and immersion) and sampling days (7,15 and 30 dpi). In order to study differences in the qPCR results for the analysed tissues (brain, gills, caudal fin and blood) (Study 2) an ANOVA 2-Way (with replication) was applied (Zar, 2010). Also, when applicable a LSD test was performed to evaluate statistical significant differences (Zar, 2010) between treatments (IM and immersion) and days (7, 15 and 30 dpi), and to determine differences between sampling days, a Tukey HSD was performed. All the assumptions inherent to the performance of the methods (namely, normality of data and homogeneity of variances) were validated.
For all statistical tests the significance level was set at 0.05 (that is, p-value≤0.05). All calculations and statistical analysis were performed with IBM SPSS Statistics 24 software. When applicable, results were presented with mean±standard deviation (S.D) or mean±standard error of the mean (SEM). All graphs were designed with the Graph Pad Prism 7 Software.
21
3. Results
3.1. Challenge in vivo
Before performing the in vivo challenge, a sample of 100 individuals was weighted and the mean weight of the fish determined. At the time of transferring the individuals to the challenge tanks, mean weight was 10.6g±0.01.
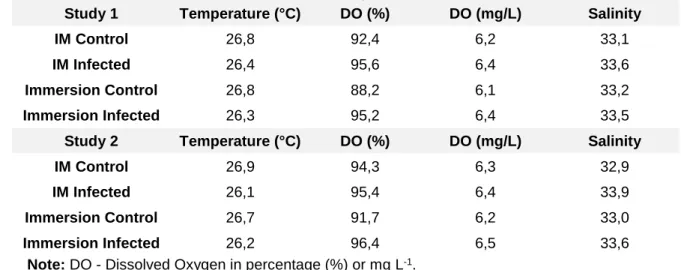
The animals were kept in a controlled environment and the water parameters were measured daily, always assuring the animal welfare during this period. The water temperature was maintained in a range of values suitable for the replication of Betanodavirus in fish tissues. The water physico-chemical parameters of the water are presented in Table VI for both studies.
Table VI: Mean values for water physico-chemical parameters obtained during in vivo
challenge.
Study 1 Temperature (°C) DO (%) DO (mg/L) Salinity
IM Control 26,8 92,4 6,2 33,1
IM Infected 26,4 95,6 6,4 33,6
Immersion Control 26,8 88,2 6,1 33,2
Immersion Infected 26,3 95,2 6,4 33,5
Study 2 Temperature (°C) DO (%) DO (mg/L) Salinity
IM Control 26,9 94,3 6,3 32,9
IM Infected 26,1 95,4 6,4 33,9
Immersion Control 26,7 91,7 6,2 33,0
Immersion Infected 26,2 96,4 6,5 33,6
Note: DO - Dissolved Oxygen in percentage (%) or mg L-1.
3.2. Study 1 - mortality study
The mortality study was performed in order to evaluate the Betanodavirus strain virulence and capacity of inducing disease in healthy fish, and to confirm that the experimental infection with the virus was responsible for the animals’ death.
In the IM infected fish, clinical signs became evident after 5 dpi, with the fish starting to display dark coloration, abnormal swimming behaviour (spinning, rotating, and corkscrew swimming). Also, the first mortalities were recorded at 6 dpi, in the IM infected individuals, and mortality reached a plateau at 18 dpi (Fig. 3.1). The mortalities for the immersion infected fish began later and were all recorded at 14 dpi. The highest
22 cumulative mortality value obtained during the challenge was 40% for the IM Infected individuals, and 3.3% for the immersion infected individuals. Neither treatment controls had mortalities occurring during the challenge period.
Figure 3.1: Cumulative mortality (%) observed during challenge with Betanodavirus for Study 1
after experimental infection (n=30 per group).
At the end of the trial (30 dpi) it was possible to detect Betanodavirus antibodies in the individuals infected by both challenge methods (Fig.3.2). The mean endpoint antibody titres for the IM infected group were higher than that obtained for the immersion infected individuals at 30 dpi, with 10 −Log2+1 and 6 −Log2+1 respectively (Fig. 3.2).
Figure 3.2: Endpoint antibody titres (−Log2+1) at 30 dpi for the different infection methods. The
23 Control fish from both IM and immersion challenged groups had no specific antibodies against Betanodavirus. There were no statistical differences in antibody titres at 30 dpi when the two treatments (IM and the immersion challenge groups) were compared (t-student, t(6)=1.433, p-value=0.202>0.05; Fig. 3.2).
The individual endpoint antibody titres for the IM infected fish were higher than the immersion infected fish for all the individuals analysed (Fig. 3.3). Controls from both infection methods had no specific antibodies against Betanodavirus.
Figure 3.3: Individual endpoint antibody titre (−Log2+1) at 30 dpi for the two infection routes used
in Study 1 (n=4).
At the end of the mortality study, 30 dpi, random individuals were selected as mentioned above, and their brains were sampled for virus isolation by cell culture. Throughout the study, moribund individuals (n=6) were also sampled for cell culture.
No CPE was observed from samples taken from the stock fish or control fish, analysed by cell culture. As presented in Table VII, 8 out of 9 infected brains from IM infected and 2 out of 3 infected brains from immersion infected individuals, inoculated into SSN-1 cell line, produced a CPE after the incubation period.