UNIVERSIDADE DA BEIRA INTERIOR
Department of Civil Engineering and Architecture
Department of Electro-mechanical Engineering
Evaporative cooling performance of
alkali-activated tungsten mine waste mud
mortars
María Victoria Bastardo Salazar
Dissertation to obtain the degree of Master of
Materials and Building Technologies
(2nd cycle)
Supervisor: Prof. Doutor Pedro Nuno Dinho Pinto da Silva
Co-Supervisor: Prof. Doutor. João Paulo de Castro Gomes
iii
Acknowledgments
To God, my Lord, for giving me life and all the opportunities I have had so far, and being with me every day.
To my parents, who have dedicated their lives to my siblings and to me, for all that sacrifice they do every day, even when they are far away from me now. Hope you can be proud of me.
To Ricardo, for being part of my research, not only as supporting but as the best contributor in the whole project every time I needed.
To my three siblings, Juancho, Ceci, and Ale, who also supported me throughout my research, supporting me and encouraging me day and night, even when they are so far from me right now.
To Fernando, my very best friend since so long ago, who helped me finding references that I could not find from my data base in Portugal, for spending part of his valuable time during his PhD research to pay attention to my requirements.
To professors PhD. Castro Gomes and PhD. Pedro Dinho, for trusting me and offering me this research project. I have learn more than I could imagine during this all year working with you.
To Pedro Martins, João Centeio and João Correia who were very helpful at any time I needed in several phases of this research, even when our communication was sometimes difficult because of the language.
v
Abstract
The increase on energy demand associated to the substantial use of air conditioning systems, requires careful consideration of passive cooling strategies with evaporative cooling to be a useful technique for this purpose. An important factor influencing the performance of evaporative cooling systems is the material that acts as a medium in the evaporation process. In these study there were experimentally determined the evaporative cooling properties of some geopolymer materials that are made by using of mining waste mud. The main objective of this study was to develop a geopolymer-based material having adequate properties for evaporative cooling to be used in a complex passive cooling unit under research development. The experimental work was based on the use of a test tunnel previously designated to other evaporative cooling research, where other types of materials where analyzed. Results show that geopolymer materials show good behavior for this type of testing, and the best of them were the composition with the coarse sand as an aggregate.
Key words
vii
Table of Contents
1. Introduction ... 12
1.1. Definition of topic research ... 12
1.2. Problem of study ... 13 1.3. Previous Works ... 13 1.4. Goals ... 13 1.4.1. Main goal ... 13 1.4.2. Specific goals ... 13 1.5. Research overview... 14 2. Theoretical framework ... 15
2.1. Evaporative cooling systems ... 15
2.2. Geopolymers ... 16
3. Methodology ... 18
3.1. Elaboration of geopolymer samples ... 19
3.2. Standard ISO 10545-3: Determination of water absorption for ceramic tiles. ... 25
3.3. Wind tunnel. Passive cooling unit. ... 25
4. Results and analysys... 27
4.1. Elaboration of samples process ... 27
4.2. Samples behavior during standard ISO 10545-3 test ... 28
4.3. Test results from the wind tunnel ... 30
4.3.1. General study ... 30
4.3.2. Further study ... 31
5. Conclusions and recommendations ... 36
5.1. Conclusions ... 36
5.2. Recommendations ... 37
ix
List of Figures
Figure 1. Very fine sand (left), medium sand (middle) and very coarse sand (right), types of
sand used in the elaboration of the samples. ... 19
Figure 2. Refractory furnace (left) and Mill from Los Angeles (right). ... 20
Figure3. Sodium Silicate (left) and Sodium Hydroxide (right), geopolymer activators. ... 22
Figure 4. Commercial mixing machine making the mixing process of one of the samples. ... 23
Figure 5. Samples Nº2, Nº3, Nº5 and Nº7 (up) and a group of the samples (down) obtained with polymeric compositions. ... 25
Figure 6. Scheme of the experimental unit. ... 26
Figure 7. Sample Nº6 (left) and detail of the surface defect of the same simple (right). ... 27
Figure 8. Sample Nº1 (left) and sample Nº2 (right) after the activation process. ... 28
Sample 9. Sample Nº2 after drying test, standard ISO 10545-3. ... 29
Figure 10. Some of the damaged samples after the water absorption test, standard ISO 10545-3. ... 29
Figure 11. Evaporated water vs. temperature. Test time: 90 min... 31
Figure 12. Evaporated water ratio vs. Temperature. Test time: 90 min. ... 32
Figure 13. Evaporated water vs. Air velocity (test time: 90 min) ... 33
Figure 14. Evaporated water ratio vs. Air velocity (Test time: 90 min) ... 33
Figure 15. Sample 8: Evaporated water vs. time (at 30ºC, 0.9 m/s) ... 34
Figure 16. Sample 8: General behavior (at 30ºC, 0.9 m/s) ... 34
Figure 17. Sample 8: Evaporated water vs time (at 30ºC, 1.9 m/s) ... 35
xi
List of Tables
Tabla 1. Fixed values of the geopolymer composition. ... 18 Tabla 2. Composition of each simple of geopolymer materials. ... 21 Table 3. Performance of the samples. ... 30
12
Chapter 1
1. Introduction
1.1. Definition of topic research
Mining is one of the primary production activities based on the selective obtaining of minerals and other materials from the earth’s crust. The processes associated with mining activities involve several actions that generate significant environmental impacts, which can last over the time beyond the mining operations period. One of these consequences is, therefore, the accumulation of mining waste.
These problem is observed in Panasqueira, Portugal, a mining region where the large accumulation of waste cannot be returned to their place of origin due to the contamination that this action may cause to the ecosystem, because the mining waste from Panasqueira contains large amounts of heavy metals, which can contaminate the river Zêzere water, a watercourse that is very close to the mining area, and therefore, this action may intensely affect the entire environment [1]. This is one of the most important reasons why recycling has been seriously considered as a way to solve the accumulation of waste problem, since, while the mining waste are successfully used in other applications, the environmental impact would be widely reduced.
Moreover, the construction industry worldwide is currently in the search of new materials that, holding the same purpose of preserving the environment, would be able to reduce the current high consumption of energy in the entire world. Every time there are more people using air conditioning systems to maintain thermal comfort within the spaces of both work and home, and this leads to excessive increases in energy demand. This concern, linked to the idea of recycling the mining waste of Panasqueira, the University of Beira Interior has developed an initiative that combines both themes, using waste materials to produce new building material to reduce energy consumption of buildings, in Portugal. These materials derived from mine waste, have high alkali activation, due to its high mineral composition, and they are known as Geopolymers. These new materials have been even proposed as substitutes for cement, which is why it has been necessary to submit the geopolymers to several testing process, in order to ensure that their properties gather all the requirements established by any building material, as well as additional benefits, such as reducing energy consumption.
13
1.2. Problem of study
In this context, the development of this research has as a main objective the study of the capacity of water absorption and water evaporation of geopolymer materials, to be used in evaporative cooling systems, allowing a reduction in energy consumption of buildings.
1.3. Previous Works
Castanheira et al. [2] conducted, prior to this research project, a research related to the study of the characteristics and properties of geopolymer materials to be used as building materials, where the optimal ratio of the alkali components was determined, the ideal composition of the precursor material and age and curing temperature of the entire geopolymeric composition in order to obtain the best performance of this materials.
On the other hand, Pires et al. [18] conducted a study of evaporative cooling for different textile and common building materials in an experimental unit composed by a test tunnel designed specifically for this purpose, where samples were tested for all the different materials at different conditions of air temperature and air velocity. He obtained favorable results and concluded that textiles are ideal for use in evaporative cooling applications, but he also had good results with some of the building materials such as ceramic ones. The successful obtained by Pores in his research was one of the strongest reasons that motivates this current research project.
1.4. Goals
1.4.1. Main goal
Evaluate the characteristics of water absorption and water evaporation of different combinations of geopolymer materials to be used in evaporative cooling applications.
1.4.2. Specific goals
Study of previous research projects regarding geopolymer materials to understand their properties.
Proposing different materials with different compositions of geopolymer.
Selecting the components to be used in the preparation of the samples.
Preparing the samples of geopolymer materials based on the composition proposals established.
Carrying out the necessary tests according to the international standards for building materials, in order to determine their water absorption properties.
Defining the necessary conditions to test the different samples of geopolymeric compositions in the experimental evaporative cooling unit.
14 Performing different tests with different combinations of temperature and air
velocity in the wind tunnel.
Analyze the results of the evaporative cooling testing process.
Identify the samples with the best performance in the experimental process
Proposing ideas to the developments of future works.
1.5. Research overview
In this chapter there is presented the research work taking account its background and goals to accomplish in this work.
Chapter 2 refers to evaporative cooling systems, their evolution and applications, as well as the utility of them today and the benefits this systems represent in terms of energy efficiency compared to conventional systems. Also, in this chapter it is presented information of the geopolymer materials, their characteristics, discovery, molecular behavior and their applications in construction.
Chapter 3 presents the experimental methodology that was carried out for the development of the geopolymeric samples, as well as the tests conducted in the wind tunnel to obtain the water evaporation characteristics of these materials.
Chapter 4 shows the experimental study, which corresponds to the results obtained throughout the development of this research, indicating the best materials to be used in evaporative cooling process, the analysis of the data obtained from the wind tunnel testing process and the comparison between the different samples of geopolymer.
Finally Chapter 5 indicates the conclusions obtained by the testing process and the results obtained, as well as proposals for future projects, that may enable the improvement of research in the evaporative cooling systems, as well as the search for new materials to be used in construction applications.
15
Chapter 2
2. Theoretical framework
2.1. Evaporative cooling systems
In a global perspective, it is evident that there is a daily great rise in people living standards. This fact, connected with the low cost of air conditioning systems, have led to an excessive increase in energy demand of buildings to provide thermal comfort in inner spaces. Only in the European Union (EU) there is expected to increase the use of air conditioning systems of buildings in about four times since 1990 to 2020. In fact, the energy consumption row with the highest growth rate in buildings is for cooling systems, which deeply harms the overall goal of reducing CO2 emissions.
It is predicted that the total cooling area has increased over the last decade from 1200 million square meter in 2000 to about 2200 million square meters in 2010, representing an increase of 3 to 5 square meters in the cooling area, where only the commercial buildings are responsible for 70% of the increase predicted for 2020. This means that electricity consumption for air conditioning from 51 TWh in 2000 (18 m CO2) that reaches the 95 TWh in
2010 (33 m CO2), which implies as major consequences the emphasis on the dependence of
fossil fuels which leads to an increase in prices of energy products as well as the greenhouse effect due to the CO2 emissions, resulting in a reduction of the ozone layer [10].
All of the above implies that there is an urgent need in seeking ways to solve all of these problems, which leads to consider the alternative of passive cooling systems, which, if use properly, they can achieve considerable reductions in energy consumption and therefore a reduction in CO2 emissions. These involve the use of some of the great natural heat sinks,
such as ambient air and water.
It is assumed that the first evaporative cooling systems were used in the 1920’s, where people in hot summer nights soaked blankets or sheets used as screens in their bedrooms, and placed behind them electric fans, removing the warm air and making the room cool. This idea has been developed until obtaining the evaporative cooling systems currently known, which represent a great alternative in reducing energy consumption from air conditioning systems [22].
These systems provide efficient cooling through a combination of water evaporation, and this is a natural process with a simple air in motion system. Basically, the outside fresh
16
air is pushed into the wet panel which is cooled by evaporation and circulated through the space in question by an electric fan. Since this process adds moisture to the air, these systems where initially used in dry climates such as deserts, however, nowadays they are being used even in regions near the sea [4].
Essentially there are two types of evaporative cooling systems, direct or indirect. In the first case, the air which is intended to be cooled is directly used in the evaporation process, being simultaneously cooled and moistened. The second case corresponds to systems where there is an intermediate media in the heat exchange process that physically separates the air to be cooled from the air is being used in the evaporation process. In this case, ambient air is cooled without being wet.
The key factor that directly affect the system performance in the indirect evaporative cooling cases is the media material that acts as the principal element in the process of evaporation of water, ie, the one which is moistened and then subjected to the air stream that will further allow the evaporation of water. Innumerable materials have been investigated for this purpose, including textiles and various building materials, which are among the most used for evaporative cooling applications [18]. These include ceramic materials [8], silica sandstone, fly ash and siliceous shale among others, as well as jute fabrics, cotton towels, palm and luffa fibers and PCV sponge meshes between the textiles.
A new proposal regarding the media materials used in evaporative cooling systems, corresponds to the geopolymer composition materials, as in previous works (Castanheira) have presented favorable physical and mechanical properties, which means they can be widely used as construction materials.
Present work was carried out with the aim of selecting the best geopolymer compositions that can be used in a specific application of evaporative cooling that be subsequently integrated into a complex element of passive cooling of buildings that is currently being developed.
2.2. Geopolymers
They are known as geopolymer materials those that have a composition rich in alumina-silicate, and have a wide range of applications, being the most relevant the possibility of being used as a substitute for Portland cement and various ceramic materials. The denomination of ‘geopolymer’ was first used by Joseph Davidovits in the 1970 to characterize new materials with the ability to transform, polycondense and adopt different shapes at low temperatures such as polymers [6]. However it is presumed that the Soviet
17
Union developed similar materials after 1950 and they were known as ‘soil cement’. Over time, the word ‘geopolymer’ became the most common way of referring to these materials.
Geopolymers are materials produced by the reaction of raw materials, rich in alumina-silicate in alkaline media and its production depends on the chemical and mineralogical composition of precursor material (eg. Mine waste, fly ash, clay, etc.), curing temperature, curing age of material, percentage of water used in the mix and concentration of alkaline compounds [2]. There materials present high mechanical resistance between their properties, good durability, low shrinkage, adequate porosity and resistance to acid and sulhpates. It have been proven in previous studies of mining waste, rich in alumina-silicate, at a local tungsten mining (Panasqueira), that these waste have very good reactivity with alkaline activators (Sodium Silicate and Sodium Hydroxide), after calcinations temperature (800 to 950ºC) in order to increase the resistance of artificial waste of geopolymer aggregates (WGA) [14].
Davidovits in his research has reported several advantages of geopolymer compounds compared with Portland cement, especially in the environmental field, due to the fact that geopolymers have a much longer useful life comparing to Portland cement due to the capacity of encapsulation of metallic waste and the reduction of CO2 emissions that geopolymers have
[5].
All of the above indicates that alkali-activated binders represents a great alternative to become a substitute for cement. However there clusters are still at the early stage of development, therefore it is necessary to continue researching about them so in a next future they can become a viable economic and technical solution in the process of searching for new building materials.
18
Chapter 3
3. Methodology
In order to make a deep analysis in the field of water absorption and water evaporation of the materials with geopolymeric compositions, different mixtures were prepared, varying the percentages of some of their components.
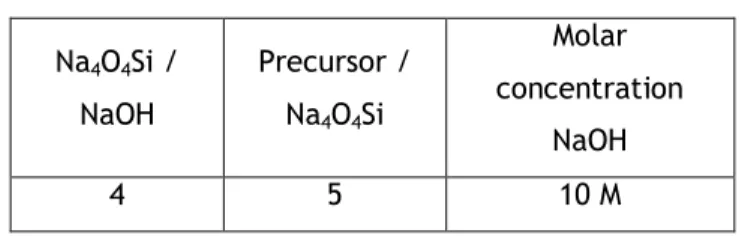
On the basis of previous studies regarding geopolymers [2], [14], certain values remain fixed that correspond to the ideal composition of the geopolymer, considering the quality of the mix and the cost of developing it. The fixed values correspond to the Sodium Silicate and the Sodium Hydroxide ratio (Na4O4Si/NaOH), the precursor and Sodium Silicate
ratio (precursor/ Na4O4Si) and the molar concentration of Sodium Hydroxide. These last value
was mainly considered for having the best quality-cost value, because even when other molar concentration values showed better results in previous works [2] its elevated production costs do not make them as useful choices for this experimental process. Fixed values used in this research are shown in table 1.
Table 1. Fixed values of the geopolymer composition.
Na4O4Si / NaOH Precursor / Na4O4Si Molar concentration NaOH 4 5 10 M
Once the fixed values were established, different proposals of geopolymer compositions were developed in order to test them later in water absorption and water evaporation experimental work. These proposals include the variation of some aggregates of the geopolymeric mixture, such as the percentage of water added and the type of sand. There were three different types of sand: very fine sand (1/16 – 1/8 mm diameter), medium sand (1/4 mm – 1/2 mm) and very coarse sand (1 mm – 2 mm). Figure 1 shows the different types of sand used.
19
Figure 1. Very fine sand (left), medium sand (middle) and very coarse sand (right), types of sand used in the elaboration of the samples.
3.1. Elaboration of geopolymer samples
The process of preparing geopolymer consists on a rigorous methodology to be carried out with rigor and caution, since the aggregates are chemical compounds that react with the precursor to carry out the activation process and the molecular bound between the individual compounds. The reaction time is critical, as well as the use of the exact amounts of each aggregate and the subsequent process of mixing all the aggregates. An error in any of these steps can lead to a poor compaction of the geopolymer, and therefore a poor mechanical behavior.
The first step that should be taken in the process of making geopolymer mixtures is to obtain the precursor material. Since environmental protection and recycling is highly considered in these research, there was used as precursor material waste from Panasqueira mining, Covilhã, Portugal. These waste have a particular composition due to the fact that they are from mines, therefore they have a high mineral percentage. The main compounds that become part of these mining waste are Sodium Oxide (1.14%), Silicon Dioxide (68.54%) and Aluminum Oxide (18.24%).
Previous studies concluded that the calcinations of the mining waste at high temperatures improves the properties of this precursor material in the final geopolymer product [2], therefore, the material was calcined at 950ºC for two hours in an industrial refractory furnace. Then a ball mill was used to obtain finer precursor particles which also achieves better results in the mixing process. The mill process take 6 hours to get the ideal grain size which is very fine. Figure 2 shows the industrial refractory furnace and the ball mill from Los Angeles used to calcine and mill the precursor material, respectively.
20
Figure 2. Refractory furnace (up) and Mill from Los Angeles (down).
Even when it is considered, according to previous work, that milled precursor material shows better results in geopolymers, it was proposed for this work the making of mixtures with not-milled precursor to be studied in the water absorption and evaporation of water tests in order to take the possibility of obtaining interesting results which would involve the widening of the spectrum of options in the geopolymer field, varying the composition according to the application where the material will be used. This fact allows versatility and adaptability of the geopolymer, making it an attractive option in the construction field.
Once the precursor is obtained, different mixtures were proposed to start making the samples. Table 2 shows the mixtures made for this research. Materials that become part of these mixtures are precursor, sand, water, Sodium Hydroxide and Sodium Silicate.
21
Table 2. Composition of each simple of geopolymer materials.
Sample Precursor Sand Humidity Water % Pressure Force (KN)
Sand / Precursor
ratio
Silicate /
Hydroxide ratio Silicate ratio Precursor /
1 Milled medium sand sifted - 5 20 3:1 4:1 5:1
2 Milled medium sand sifted - 5 20 3:1 4:1 5:1
3 Milled Very fine sand - 10 30 3:1 4:1 5:1
4 Milled Very fine sand 1% 10 40 3:1 4:1 5:1
5 Milled (50% very fine) + (50% medium
sifted) 0.50% 10 30 3:1 4:1 5:1
6 Milled Medium sand sifted 0.50% 10 30 3:1 4:1 5:1
7 Milled Medium sand sifted - 10 30 3:1 4:1 5:1
8 Milled Very coarse sand - 10 30 3:1 4:1 5:1
9 Milled Very fine sand 1% 10 30 3:1 4:1 5:1
10 Milled Medium sand sifted 0.50% 10 30 3:1 4:1 5:1
11 Milled Very coarse sand - 5 30 3:1 4:1 5:1
12 Milled Not- Very coarse sand - 10 30 3:1 4:1 5:1
13 Milled Not- Medium sand sifted - 10 30 3:1 4:1 5:1
The geometry of the samples became an important factor in the development process, due to the fact that, to the absorption and evaporation of water processes there was used a wind tunnel previously constructed at the Thermodynamics and Heat Transfer Laboratory from University of Beira Interior to conduct previous studies of some textile and building materials [18], therefore, the dimensions of each sample should be such that could fit properly in the wind tunnel, with an area of 15x15cm2 and a thickness of 2 cm. In order to
fill these requirements, cubic iron molds was used with internal dimensions of 15x15x15 cm3
but they were not entirely filled since the required thickness was of 12 mm. Latter it will be detailed the process of compaction of the samples in the iron molds.
Different proposed mixtures of geopolymer were made in the Durability and Technology Laboratory of University of Beira Interior. Firstly it is important to establish the amount of material to be obtained in order to get the right proportions of each component of
22
the mixture. Each aggregate amount is set according to the final volume to be achieved and this is of 150x150x12 mm3 according to the information mentioned above. Once it is
established the mass value of the precursor, the fixed values of the activators (shown in figure 3) Sodium Silicate/Sodium Hydroxide (Na4O4Si/NaOH), ratio, the precursor/Sodium
Silicate (precursor/ Na4O4Si) ratio and the molar concentration of Sodium Hydroxide, a
computer software known as AlKalSoft is used to obtain the values of the mass of Sodium Silicate and the volume of Sodium Hydroxide needed to get the correct geopolymer mixture.
Figure3. Sodium Silicate (left) and Sodium Hydroxide (right), geopolymer activators.
Once the values are obtained from the software, the process of preparing the mixture begins. The first step consists in the combination of Sodium Silicate with Sodium Hydroxide. Due to the fact that the samples produced were of small dimensions, the amount of each of the activators were reduced, requiring the use of a magnetic agitator to get a proper mixture of these two components. Both Sodium Silicate and Sodium Hydroxide were placed in a beaker and mixed by the agitator once they are placed in the sheet. This process take at least 10 minutes, since less of that time does not allow the necessary combination of both activators.
After obtaining the mixture of Sodium Hydroxide and Sodium Silicate, the second step was taken, consisting in the mixture of the sand with the precursor material. In some cases of combinations, the sand was previously moistened before being combined with the precursor, as in previous studies it was found that the wet sand could be a possible factor that would allow a better mixture of the materials. For these samples, the first step of this second stage consists in adding water to the sand prior to mixing it with the precursor. Next, a commercial mixer machine was used to complete the entire mixture of all the components. Figure 4 shows the Mixing machine in the process of the mixture for one of the samples.
23
Figure 4. Commercial mixing machine making the mixing process of one of the samples.
In the mixer bowl there were placed both the sand and the precursor, later the percentage of water was aggregated (which varied in some cases, depending on the sample, as showed it table 2), they were mixed for 15 minutes and after that the activators (previously mixed) were gradually added in order to obtain a homogeneous mixture. The process was continued for 15 minutes more after all the aggregates were added, to reach the activation of the geopolymer mixture. Once the proper consistency of the mixture was obtained, it was placed into the mold to be compacted.
To obtain sample with the indicated specifications, a compaction process was applied in the Laboratory of Technology from University of Beira Interior. Compressive strength equipment was used to apply a compressive force between 20 and 40 KN to obtain a proper geopolymer compaction. Since the mold dimensions were of 15x15x15 cm3, two pieces of
wood with dimensions of 15x15x3 cm3 were needed in order to fill the empty volume inside
the mold and then place it into the compression machine. Initial force proposed was of 20KN but the compaction in this case did not obtained good results because the particles were not fully compacted. This lead to increase until 30KN for the next samples and even 40KN, although these last value was later discarded since it was found to be higher than necessary to compact the particles, given that one of the sides of the sample showed surface deterioration. Once the samples were completed, is was needed to wait between 10 to 12 days to begin the testing process, because it is necessary to wait until the internal elements of geopolymer interact with each other until they reach the optimal activation of the mixture. Figure 5 shows some of the samples obtained to this research. The samples, with a total of 13, were named to be analyzed later, from 1 to 13.
24
Once all the samples were completed and it was reached the activation period, the water absorption study was performed, according to the standard ISO 10545-3.
25
Figure 5. Samples Nº2, Nº3, Nº5 and Nº7 (previous page) and a group of the samples (up) obtained with polymeric compositions.
3.2. Standard ISO 10545-3: Determination of water
absorption for ceramic tiles.
To obtain the water absorption coefficient of each simple, there were necessary to conduct a study according to standard ISO 10545-3. Initially, the standard requires a process of drying the plates in an industrial oven at 110ºC, for a minimum period of 24 hours. Samples must be weighed before being placed in the oven and then after they are taken out from it, to record the percentage of water evaporated during this period. The process must be repeated as many times as necessary until the difference between two consecutives weighing is less than 0.1%. In the case of this research there was needed to repeat the drying process for 48 hours to obtain a difference of less than 0.1%.
Immediately after finishing the drying process, the plates were immersed in a thermal bath with water at 100ºC for a period of two hours. At the end of this period of time, the heat source and the materials remain submerged in water for a period of 4 hours in order to cool at room temperature. At the end of this time the plates were weighed to obtain the percentage of water absorbed.
3.3. Wind tunnel. Passive cooling unit.
To evaluate the water evaporation performance of each sample. An experimental unit was used, consisting of a centrifugal fan, a wind tunnel a precision scale and a butterfly valve. This system was previously used for the study of several textile and building materials (Pires), analyzing the same properties studied in this research for the geopolymer materials. Image 6 shows an scheme of the experimental unit used in this study.
26
Figure 6. Scheme of the experimental unit.
The air conditioning system, consisting of a centrifugal fan was connected to the wind tunnel through a cylindrical pipe and a butterfly valve was placed at the entrance of the duct to control the speed of the air flowing through the wind tunnel, parameter that was measured with a digital anemometer telescopic probe (Testo 416) with an associated error of 1.5% of reading. The tunnel has a rectangular cross section of 30 mm and 150 mm width and has a square hole of 150 mm at the bottom surface, to allow placing the samples of materials to be evaluated.
Additionally, temperature and humidity probes (Rotronic, HygroClip SC05) were placed inside the tunnel to measure air conditions before and after the sample. These sensors were connected to a data acquisition equipment (Rotronic, HygroLog NT3-D) that record the data of the air conditions in the tunnel for each test. The error associated to the probes are of ± 1.5% for relative humidity and of ± 0.2ºC for temperature.
Moreover, there were incorporated three type T thermocouples, which have an associated error of ±0.5ºC, one at the entrance of the wind tunnel to control the temperature of inlet air to the unit, a second thermocouple at the surface of each sample to evaluate temperature variations if each materials during the test, and a third thermocouple at the exit of the wind tunnel to check the air temperature in this section.
Air conditioning equipment (P. A. Hilton Ltd., AC573) was connected to test tunnel. A temperature controller (Cole-Parmer Instrument Co., 89000-15) was used to precisely set the temperature of the air supplied by air conditioning equipment to the test tunnel. Flow velocity was fixed combining the variation of the power supplied to fan motor and using a butterfly valve.
A precision scale (KERN PCB 6000-1) with measuring error of 0.1g was used to measure the samples mass increment. All measurements took place every 1 minute for a period of 90 minutes.
27
Chapter 4
4. Results and analysys
4.1. Elaboration of samples process
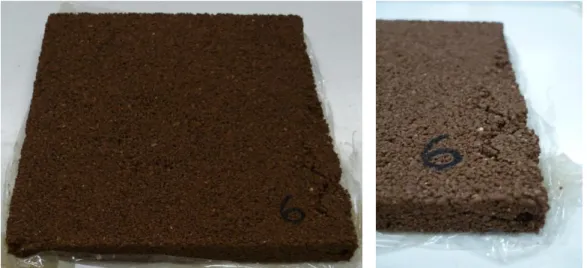
Once the samples of the geopolymer materials were developed, there were observed some characteristics in one of them. Sample Nº6 showed superficial defects specifically in the top of its surface where one of the edges has a lift. This was due to compaction problems, caused by some failures presented by the compression machine. Figure 7 shows the final finish obtained by sample Nº6.
Figure 7. Sample Nº6 (left) and detail of the surface defect of the same simple (right).
Due to the problems presented in sample Nº6, it was decided to repeat the same mixture to tested it later, so the sample Nº6 was replaced by the sample Nº10, both having the same composition, but the surface finish of sample Nº10 has no defects.
Moreover, in the case of samples Nº1 and Nº2 it can be observed that both of them have the same composition, because the first one showed a weak surface finish, so it was decided to repeat the same composition because, since it was the first one, it could be the result of some mistake during the process of preparing the mixture on during the compaction process. However, after making the sample Nº2, this one showed the exactly same result as observed in sample Nº1, which implies that the weakness of the surface is not related to the preparing or compaction processes but to the composition of the mixture. Image 8 shows the surface finish of samples Nº1 and Nº2 after reaching the activation of the geopolymer mixture.
28
Figure 8. Sample Nº1 (left) and sample Nº2 (right) after the activation process.
The other 11 samples did not show problems during this first stage of the research, regarding to the development of the samples. Based on this, even when all the plates elaborated made a total of 13 samples, 11 different mixtures were obtained in order to continue the process of study, being discarded sample Nº6. In the case of samples Nº1 and Nº2 they were both studied, even when they presented the same composition.
4.2. Samples behavior during standard ISO 10545-3 test
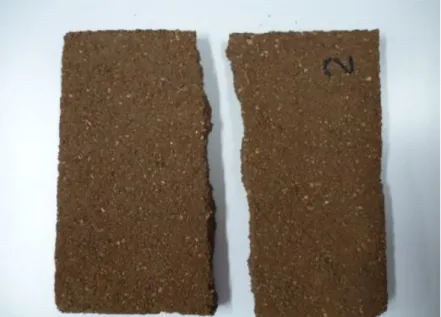
By the time of testing the materials according to standard ISO 10545-3, there were interesting results. Many of the samples studied were severely damaged during this procedure, making it impossible to continue testing the damaged samples.Due to the proper porosity of the geopolymer materials and being some of the samples more porous than others, many of them did not resist the required test by the standard ISO. Sample Nº2 broke in half at the end of the drying process, even before being immersed in the heat bath. Image 9 shows the result of sample 2 after the drying test.
Another samples, such as samples Nº1, Nº3, Nº7, Nº10, Nº11, Nº12 and Nº13 had severe fractures after completing the water immersion test. Figure 10 show some of the damaged samples after completing the requirements of standard ISO 10545-3.
29
Sample 9. Sample Nº2 after drying test, standard ISO 10545-3.
Figure 10. Some of the damaged samples after the water absorption test, standard ISO 10545-3.
30
With this in mind, the research was continued with the samples that were not damaged, which were samples Nº4, Nº5, Nº8 and Nº9, because the main objective of this work is related to the ability of water absorption and water evaporation of geopolymer materials. Damaged samples indicated that the mixtures used in those cases did not reach the minimum requirements to be used as potential materials in evaporative cooling applications.
4.3. Test results from the wind tunnel
4.3.1.
General study
Fortunately, the samples that resisted the standard ISO test could successfully complete the tests in the wind tunnel experimental unit. Initially, each sample was tested with the ambient air conditions presented during the summer in the region where the study took place, which is the city of Covilhã, Portugal. These conditions correspond to an air temperature of 30ºC and an air velocity of 0.9 m/s. Each took placed in the wind tunnel for a period of 90 minutes.
Calculations were made for three different parameters, necessary to characterize the different samples and identify which one shows the best performance in evaporative cooling applications. The first parameter corresponds to the absorption coefficient of water, defined as the ratio between the weight of water absorbed by the sample and the weight of the dry sample, expressed as a percentage. The second parameter is the ratio between the evaporated water and the water actually present in the sample (water absorbed during the previous process). This second parameter evaluates the behavior of the samples during the drying process. Finally, the third parameter indicates the ratio between the value of evaporated water and the dry sample mass value, which represents the product of the previous two parameters. This last factor allows to identify the best material in the evaporative cooling process, since both variables absorption en evaporation of water abilities are important to define the sample with the best performance. Table 3 shows the results obtained by the four samples tested in the wind tunnel.
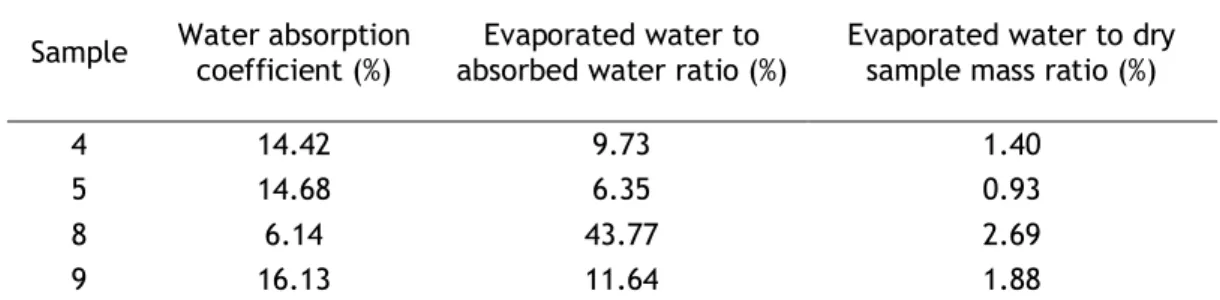
Table 3. Performance of the samples.
Sample Water absorption coefficient (%) absorbed water ratio (%) Evaporated water to Evaporated water to dry sample mass ratio (%)
4 14.42 9.73 1.40
5 14.68 6.35 0.93
8 6.14 43.77 2.69
31
As shown in table 3, the water absorption coefficient varies from 6.14% for sample Nº8 to 16.13 for sample Nº9. Regarding the evaporated water to absorbed water ratio it is observed values from 6.35% for sample Nº5 to 43.77% for sample Nº8. Finally, third parameter shows that the highest value corresponds to sample Nº8, with a value of 2.69%, indicating that this sample presented the best performance in this experimental study, being the main feature of this sample the addition of very coarse sand.
Moreover, the sample Nº4 shows in the third parameter, a value of 1.40% while sample Nº9 presented a value of 1.88%. The only difference between these two samples is the value of compaction force applied to compact the particles, being of 40KN for sample Nº4 and 30KN for sample Nº9, which implies that a lower compaction force was more appropriate in this case, allowing greater porosity of the material that resulted in improving the performance in the evaporative cooling test.
4.3.2.
Further study
Next stage of the experimental work consisted in identifying how the influence of temperature and air velocity can affect performance in the process of water evaporation for all the samples. Taking this into account, there was conducted two series of tests with a period of 90 minutes per test, like the general study.
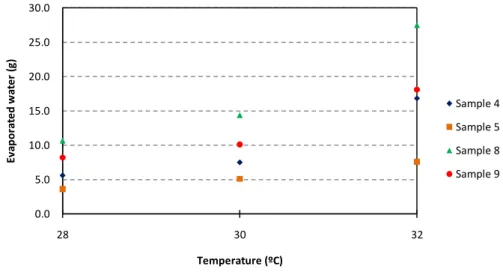
First series, related to changes in temperature, consisted in testing at temperature values of 28ºC, 30ºC and 32ºC, remembering the weather characteristics of the region where the study was carried out. For this series, air velocity was of 0.9 m/s which is the same value used in the previous study. Figures 11 and 12 show the results obtained by the samples for this series of testing.
Figure 11. Evaporated water vs. temperature. Test time: 90 min.
0.0 5.0 10.0 15.0 20.0 25.0 30.0 28 30 32 Ev ap o ra te d w at e r (g ) Temperature (ºC) Sample 4 Sample 5 Sample 8 Sample 9
32
Figure 12. Evaporated water ratio vs. Temperature. Test time: 90 min.
As shown in figure 11, the evaporated mass increased as the temperature increased. While sample Nº5 shows a linear behavior between the evaporated water and the rise of the temperature, samples Nº4, Nº8 and Nº9 show an exponential behavior, were it can be observed for the case of the higher temperature, 32ºC, the value of evaporated mass for these three samples is considerably higher comparing to the values obtained by them at 28ºC. In the same way, it is observed in this figure that the sample with better performance in this series of test was the sample Nº8 with evaporated water values significantly higher than the other samples at all temperature values.
On the other hand, figure 12 shows the ratio of water evaporated for each sample in these series of temperature testing, indicating that the lowest value at 32ºC was obtained by sample Nº5 with a value of 9% of evaporated water from the initial amount of water contained in the sample, while the highest value obtained was of 84% for sample Nº8 indicating that almost all the water previously absorbed by this sample was evaporated.
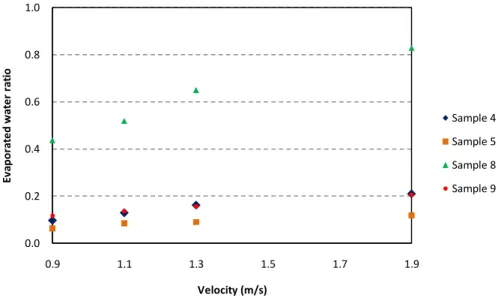
Next, second series corresponds to variations in velocity values, taking in this case, values of 0.9, 1.1, 1.3 and 1.9 m/s considering again the conditions of the region of study during the summer, as well as the capacity of axial fan used in this experimental work. The air temperature for all these series was of 30ºC, the same value used in the general study. Every test took place for a period of 90 minutes. The results obtained by these series of testing are shown in Figures 13 and 14.
As shown in figure 13, the evaporated mass proportionally increased according to the increasing of the velocity of air for all the samples. Sample Nº8 showed the best performance. Moreover, figure 14 presents the rate of water evaporation of water for sample Nº8 which was
0.0 0.2 0.4 0.6 0.8 1.0 28 30 32 Ev ap o ra te d w at e r ra ti o Temperature (ºC) Sample 4 Sample 5 Sample 8 Sample 9
33
significantly higher comparing with the other samples, with a total of 83% of the water previously absorbed during these second series of testing.
Figure 13. Evaporated water vs. Air velocity (test time: 90 min)
Figure 14. Evaporated water ratio vs. Air velocity (Test time: 90 min)
All of the above means that the sample which presented the best performance over all the testing process was sample Nº8, while the sample with the worst performance was sample Nº5, and it is also evident that increasing air velocity and air temperature significantly influence the increase of the amount of evaporated water for each material.
0.0 5.0 10.0 15.0 20.0 25.0 30.0 0.9 1.1 1.3 1.5 1.7 1.9 Ev ap o ra te d w at e r (g ) Velocity (m/s) Sample 4 Sample 5 Sample 8 Sample 9 0.0 0.2 0.4 0.6 0.8 1.0 0.9 1.1 1.3 1.5 1.7 1.9 Ev ap o ra te d w at e r ra ti o Velocity (m/s) Sample 4 Sample 5 Sample 8 Sample 9
34
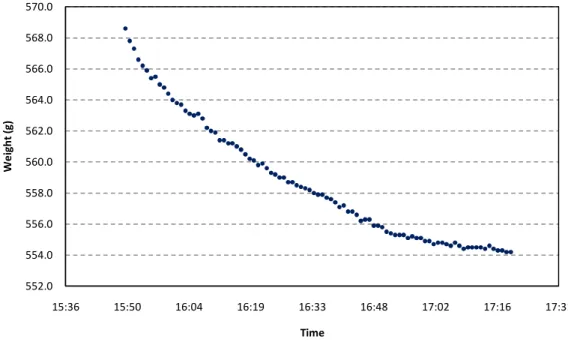
Figure 15. Sample 8: Evaporated water vs. time (at 30ºC, 0.9 m/s)
Figure 16. Sample 8: General behavior (at 30ºC, 0.9 m/s)
Figures 15 and 16 show the results obtained by sample Nº8 at the lowest air velocity value, being of 0.9 m/s. As it can be seen, the evaporation of water occurred at a fairly constant rate during 90 minutes of the test, and the air inlet and outlet temperatures remained relatively constant throughout the entire test. An important feature to note in figure 16 is the fact that it is clearly evidenced a difference between the temperature before and after the sample. Also, it is shown that the temperature of the sample is significantly lower than the temperature of the inlet air.
552.0 554.0 556.0 558.0 560.0 562.0 564.0 566.0 568.0 570.0 15:36 15:50 16:04 16:19 16:33 16:48 17:02 17:16 17:31 W e ig h t (g ) Time 0.0 5.0 10.0 15.0 20.0 25.0 30.0 35.0 15:36 15:50 16:04 16:19 16:33 16:48 17:02 17:16 17:31 Te m p e ra tu re ( ºC ) Time (min) Sample Inlet air Outlet air
35
Figure 17. Sample 8: Evaporated water vs time (at 30ºC, 1.9 m/s)
Figure 18. Sample 8: General behavior (at 30ºC, 1.9 m/s)
In the same way, there are the results of sample Nº8 for the highest air velocity tested, corresponding to 1.9 m/s in figures 17 and 18. In this case, the water evaporation process showed an approximately linear behavior, but in three segments with different slopes, being the last 45 minutes of the test the period with the minor slope, because most of the water absorbed by the sample had been evaporated. In the case of temperatures, figure 18 shows, as well as for the previous case (lower air velocity), practically constant temperature lines, which showed also that the air temperature before the sample is higher than the air temperature after the sample, and the temperature of the sample is considerably lower than the inlet air temperature.
535.0 540.0 545.0 550.0 555.0 560.0 565.0 570.0 9:50 10:04 10:19 10:33 10:48 11:02 11:16 11:31 11:45 W e ig h t (g ) Time 0.0 5.0 10.0 15.0 20.0 25.0 30.0 35.0 9:50 10:04 10:19 10:33 10:48 11:02 11:16 11:31 11:45 Te m p e ra tu re ( ºC ) Time (min) Sample Inlet air Outlet air
36
Chapter 5
5. Conclusions and recommendations
5.1. Conclusions
Evaporative cooling systems represent an alternative to the use of air conditioning systems, promoting the reduction of energy consumption and CO2 emissions. Remembering
these fact and after the analysis of the results obtained in this experimental work, it can be confirmed that the material used as heat transfer media plays a fundamental role in the process, and its characteristics can completely modify the performance of the entire passive cooling system.
Moreover, the use of waste and recycled materials in the develop process of new building materials represents a solution to the problem of accumulation of mining waste, specifically in the region of Panasqueira as the particular materials studied in this research work are from these mining accumulation, and the use of these waste in preparing geopolymer compositions presents an alternative to Portland cement, which is the responsible of large emissions of Carbon Dioxide to the atmosphere.
The main objective of this study was, therefore, to study different compositions of geopolymer materials to evaluate their water absorption and water evaporation capacities in order to proposed them as possible media in passive cooling applications. Additionally, this work allowed to determine that some compositions did not reached the minimum requirements to be used in evaporative cooling systems, such as all the samples that were damaged during the standard ISO 10545-3 testing. It also mean that new proposed combinations, as those containing non-milled precursor, do not have the mechanical and physical properties necessary to be considered as possible building materials.
Additionally, this work allow to determine which of the compositions was the most suitable for evaporative cooling applications, being sample Nº8 the one that presented not only the best results, but also outstanding, comparing with the other samples. The success obtained by these sample is due to the type of sand used in its composition, being the very coarse sand which have a considerable bigger grain size compared with other types of sand used. This particular aggregate produced a high porosity material, which was decisive in the performance as water evaporation media.
It was also determined that the variation of air temperature and air velocity have major influence on the evaporation process, showing better results for higher values of temperature and velocity. In both series of testing studied, the best results were obtained for
37
sample Nº8, followed by samples Nº9 and Nº4, and finally the sample Nº5 showed the lowest performance in the evaporation process.
5.2. Recommendations
In order to complement the information obtained in this research Project with the aim of ensuring that the geopolymer materials tested for evaporative cooling applications would be suitable building materials it is necessary to perform the mechanical and physical studies of the compositions analyzed in the test tunnel, to check their compression strength and bending strength, among others.
Even when the samples that resulted damaged during the standard ISO 10545-3 testing show that it is evident that these material properties did not reached the minimum requirements to be used in evaporative cooling systems, it would be interesting to repeat these compositions and test their mechanical and physical properties before any other test, in order to find the weakness of each one that will later allow to correct those problems if possible and then test those compositions again in evaporative cooling applications. These would expand the possibilities of geopolymer compositions that can be used in such applications.
As well as geopolymer samples showed good performance in evaporative cooling testing, in the case of previous studies [18] textile materials behavior presented ideal results for this application, therefore it would be interesting to evaluate the combination of both. By creating mixed layers of textile and geopolymer materials it can be obtained a new brick of composite material which combines the properties of both elements, which would allow obtaining attractive results. Even economically speaking it would be an advantage, since the energy consumption necessary to obtain the precursor material for geopolymer compounds is still very high. When combining with other material, it would reduce the amount of geopolymer needed; therefore, there would be a decrease in energy consumption.
38
References
[1] Antunes, C. Developments of based polymeric coating waste units with Panasqueira Mining, Msc Thesis, University of Beira Interior, June 2009 (In Portuguese).
[2] Castanheira, I., Castro-Gomes, J.P., Albuquerque, A., Evaluation of the stability of waste-based geopolymeric artificial aggregates for wastewater treatment processes under different curing conditions, Advances in Science and Technology 69 (2010) 86-91.
[3] Chung-Min Liao, Kun-Hung Chiu, Wind tunnel modeling the system performance of alternative evaporative cooling pads in Taiwan region, Building and Environment 37 (2002) 177–187.
[4] B. Costelloe, D. Finn, Thermal effectiveness characteristics of low approach indirect evaporative cooling systems in buildings. Energy and Buildings 39 (2007) 1235-1243. [5] Davidovits J., Geopolymer cement to minimize carbon-dioxide greenhouse warming,
Ceramic Transactions 37 (1993) 165–182.
[6] Davidovits J., Geopolymers: inorganic polymeric new materials, Journal of Thermal Analysis 37 (8) (1991) 1633–1656.
[7] E. Velasco Gómez, F.J. Rey Martínez, F. Varela Diez, M.J. Molina Leyva, R. Herrero Martín, Description and experimental results of a semi-indirect ceramic evaporative cooler, International Journal of Refrigeration 28 (2005) 654-662.
[8] Elfatih I., Shao L., Riffat S., Performance of porous ceramic evaporators for building cooling application, Energy and Buildings 35 (2003) 941–949.
[9] Kong D., Sanjayan J, Sagoe-Crentsil K., Comparative performance of geopolymers made with metakaolin and fly ash after exposure to elevated temperatures, Cement and Concrete Research 37 (2007) 1583–1589.
[10] Laia C.1, Richard M.1, Camelo S.1, Gonçalves H.2, Towards Sustainable Summer
Comfort, 1CEEETA ECO – Consultores em Energia, Lda. and 2Instituto Nacional de
39
[11] M.K. Ghosal, G.N. Tiwari, N.S.L. Srivastava, Modeling and experimental validation of a greenhouse with evaporative cooling by moving water film over external shade cloth, Energy and Buildings 35 (2003) 843–850.
[12] Surakha Wanphen, Katsunori Nagano, Experimental study of the performance of porous materials to moderate the roof surface temperature by its evaporative cooling effect, Building and Environment 44 (2009) 338–351.
[13] Pacheco-Torgal, F., Castro-Gomes, J., Jalali, S., Investigations on mix design of tungsten mine waste geopolymeric binder, Construction and Building Materials 22 (2008) 9 1939-1949.
[14] Pacheco-Torgal, F., Castro-Gomes, J., Jalali, S., Alkali-activated binders: A review Part 1. Historical background, terminology, reaction mechanisms and hydration products, Construction and Building Materials 22 (2008), 1305–1314
[15] Pacheco-Torgal, F., Castro-Gomes, J., Jalali, S., Alkali-activated binders: A review Part 2. Historical background, terminology, reaction mechanisms and hydration products, Construction and Building Materials 22 (2008), 1315-1322.
[16] Panias D., Giannopoulou I., Perraki T., Effect of synthesis parameters on the mechanical properties of fly ash-based geopolymers, Colloids and Surfaces A: Physicochem. Eng. Aspects 301 (2007) 246–254.
[17] Pires L., Silva D. Pedro, L.C. Carrilho Gonçalves, Surface configuration relevance in the overall thermal resistance of a wall, Energy and Buildings 37 (2005) 1068–1074. [18] Pires L., Silva, D. Castro Gomes, J.P., Performance of textile and building materials
for a particular evaporative cooling purpose. Experimental Thermal and Fluid Science 35 (2011) 670–675.
[19] Songpiriyakij S., Kubprasit T., Jaturapitakkul C., Chindaprasirt P., Compressive strength and degree of reaction of biomass- and fly ash-based geopolymer, Construction and Building Materials 24 (2010) 236–240.
[20] Van Jaarsveld, J, Van Deventer, J., Lukey, G., The effect of composition and temperature on the properties of fly ash- and kaolinite-based geopolymers, Chemical Engineering Journal 89 (2002) 63-73.
40
[21] Wang MR, et al, Influence of calcination temperature of kaolin on the structure and properties of final geopolymer, Mater Lett (2010) doi:10.1016/j.matlet.2010.08.007.¨ [22] California Energy Commission, http://www.energy.ca.gov/
[23] BS EN ISO 10545-3: 1997, Ceramic tiles Part 3: Determination of water absorption, apparent porosity, apparent relative density and bulk density, British Standard.