_____________________________________________________________________________________________________ *Corresponding author: E-mail: [email protected],[email protected];
SCIENCEDOMAIN international www.sciencedomain.org
Caffeine, Sleep Duration and Adolescents’
Perception of Health Related Quality of Life
Margarida Gaspar de Matos
1,2,3*, Teresa Paiva
3,4,
David Costa
2, Tânia Gaspar
1,2and Diana Galvão
2 1FMH, University of Lisbon, Aventura Social Research Team, Lisbon, Portugal.
2
WJCR/ISPA, Lisbon, Portugal.
3
ISAMB-FMUL, University of Lisbon, Portugal.
4
CENC – Sleep Medicine Center, Lisbon, Portugal.
Authors’ contributions
This work was carried out in collaboration between all authors. Author MGM designed the study, wrote the protocol and supervised the work. Authors MGM, TG and DC performed the statistical analysis. Authors MGM and DC wrote the first draft of the manuscript. Authors DC, DG and TP managed the literature searches and edited the manuscript. All authors read and approved the final manuscript.
Article Information
DOI: 10.9734/BJESBS/2016/23894 Editor(s): (1) Atika Khalaf, School of Health and Society, Kristianstad University, Sweden. Reviewers: (1) Avinash De Sousa, Lokmanya Tilak Municipal Medical College, Mumbai, India. (2)Nafis Faizi, Aligarh Muslim University (AMU), India. (3)Anonymous, Tokyo Bay Urayasu Ichikawa Medical Center, Japan. (4)S. S. Deshpande, SKN Medical College, Pune, India. (5)Jerzy Beltowski, Medical University, Lublin, Poland. (6)Paulo dos Santos Duarte Vitória, Beira Interior University, Portugal. (7)Liping Li, Shantou University Medical College, China. Complete Peer review History:http://sciencedomain.org/review-history/14741
Received 28th December 2015 Accepted 1st May 2016 Published 22nd May 2016
ABSTRACT
Introduction: The main objective of this study was to understand the impact of caffeine on
adolescents’ health and health related behaviours, namely sleep duration and health related quality of life.
Methods: Students in the 6th, 8th and 10th grades were chosen randomly from clusters of schools for this study. A questionnaire designed to measure caffeine consumption, sleep quantity and quality and health related quality of life was used.
ANOVAs were used for gender and grade and three multilinear regression models were conducted
Results: Coffee and soft drinks with caffeine have a negative impact in sleep duration. Both sleep
duration and quality have a positive effect on health related quality of life. Although the use of energetic drinks with alcohol is low, it has a negative impact on the perception of health quality of life. Males have shown a better perception of health related quality of life and greater quantity and quality of sleep while females report more difficulties falling asleep and report more fatigue.
Conclusions: Caffeine intake has a negative impact on sleep duration and perception of health
related quality of life, although accounting for a relatively low variance.
Keywords: Adolescence; caffeine; quality of life perception; sleep duration; caffeine; sleep duration and adolescents’ perception of health related quality of life.
1. INTRODUCTION
On average, a teenager drinks 244.4 mg of caffeine per day [1]; this caffeine is contained not only in coffee but also in sodas, tea [1] and energy drinks. Teenagers are so addicted to caffeine that on withdrawal they suffer from caffeine abstinence symptoms, such as headaches, sleepiness, fatigue, anxiety and depression upon withdrawal [2].
Caffeine is an adenosine antagonist and therefore studies have shown that caffeine consumption among adolescents increases awakenings during sleep, reduces sleep time and increases sleep interruptions [3].
Although screen time (use of television, videogames, computer and mobile phone) in children has been increasing [4], the literature defends that it increases even further when children reach adolescence [5-8]. Screen time also causes insufficient sleep and reduces its quality [9-13].
Bad quality of sleep is correlated to a poorer school performance [14]. This effect takes place because a poor sleep leads to attention problems [15] and to memory impairment [16]. Furthermore sleep deprivation, defined as a difference of 3 hours or more between sleep duration in weekends and weekdays has significant associations with frequent health complaints [12], and with risk behaviours, namely early sexual activity, violence and substance use, tobacco, alcohol and drugs [11,13].
Perceived health related quality of life is an important feature during adolescence and is also affected by poor sleep habits [12]. Furthermore, perceived health related quality of life tends to decrease during adolescence, being poorer in older adolescents and in girls [17,18]. Besides, it has a strong impact in several areas of the adolescents’ lives such as family relationships, school performance and well-being [19].
Considering that caffeine consumption and screen time affect negatively the quality of sleep, it can thus be inferred that both these behaviours will ultimately lead to a reduction in school performance as it was already found regarding screen time [11]. Screen-time, coffee and energy drink consumption are common behaviours among teenagers [12] which influence their sleep quality, increase fatigue and affect school performance. Furthermore, these habits are correlated and present mutual influences [11-13]. The main objective of this study is to understand the impact of caffeine on adolescents’ health related behaviours, namely sleep duration and perception of health related quality of life.
2. METHODS 2.1 Procedures
A questionnaire with open and closed questions was administered in the classroom with the assistance of the informatics teacher, using an online procedure and took an average of 50 minutes (a regular class length) to fill in. Researchers were available to answer pupils’ questions. The overall procedure, has been described elsewhere [12,14].
This study has the approval of a scientific committee, an ethical national committee and the national commission for data protection and followed strictly all the guidelines for protection of human rights; adolescents' participation in the survey and completion of the questionnaires was voluntary and anonymity was assured.
The questionnaire and survey methods are a component of the Health Behavior in School-Aged Children (HBSC) study [12,14].
2.2 Participants
The Portuguese HBSC survey included 6026 pupils (47.7% boys), in the 6th, 8th and 10th
grades with a mean age of 13.8 years (SD = 1.68); these participants were randomly chosen from 36 national vertical clusters of schools, in a total of 473 classes, in a national sample stratified by Education Regional Divisions and by grade. The overall response rate was 79%. The sample is nationally representative regarding those grades, therefore grade was used as a proxy for age in most studies derived from this sample. In this specific study participated 3869 Portuguese adolescents, of which 46.8% were boys, attending the 8th and the 10th grade (60% were on 8th grade), mean age 14.7 years, SD =1.18, included in the Portuguese HBSC survey 2014.
2.3 Measures
Adolescents answered a set of questions drawn from HBSC Portuguese questionnaire in 2014 [12] that included demographics (gender, age and grade), and the following variables (all expressed as Likert type scales, thus categorial in nature, except the last three measures that were expressed as continuous variables): Soft drinks with caffeine consumption (rated 1 to 7) - from never/ less than once a week/ once a week/ 2-4 days a week/ 5-6 days a week/ once a day, to more than once a day; Coffee consumption (from 1 to 6) - from never/almost never drink coffee; 1 coffee, to 5 coffees or more a day; Energetic drink with alcohol (from 1 to 5) - from never /rarely/ every month/ every week, to daily; Fatigue: feeling exhausted (from 1 to 5) - from never/ rarely/ every month/ every week, to daily; Difficulty falling asleep (from 1 to 5) – from never/ rarely/ every month/ every week, to daily; Computer use on weekdays (from 1 to 9) – from never, ½ hour; 1 hour to 7 h, or more; Computer use on weekends (from 1 to 9) from never, ½ hour; 1hour to 7 h or more; Kidscreen 10 - a 10 questions scale, Likert style that estimates the perception of wellbeing and health related quality of life. This scale was previously validated in the portuguese population, and is used regularly in the HBSC national reports, national validation data was published elsewhere and showed an excellent psychometric quality [19]; Hours of sleep during the week and Hours of sleep during the weekend.
2.4 Data Analysis
Basic Descriptive statistics and percentages were used to describe demographics and answers with likert scaled options. Regarding all categorial variables, Z scores were used [20] with the exceptions of demographics (gender and
grade), perception of health related quality of life (Kidscreen10) and hours of sleep (weekdays and weekends) that are continuous variables. Two Analysis of Variance (ANOVA) were conducted for gender and grade. Finally, three Multilinear regression models were carried out, in order to study the association of the independent variables in the study with 1) hours of sleep during the week; 2) hours of sleep during the weekend; 3) perception of health related quality of life (Kidscreen10). Multilinear regression models were controlled for gender an gender. All the analysis were carried out using the statistical software SPSS21 ©. Significance level was set at p<.05.
3. RESULTS
As previously mentioned, the main objective of this study was to understand the impact of caffeine on adolescents’ health and health related behaviours, namely health related quality of life and sleep duration. Descriptive data and frequencies for each of the variables, as extracted from the national report [19] are: Soft drinks with caffeine consumption: never (8%); on a week basis (39%); several times a week (34%) and on a daily basis (19%); Coffee consumption: never (81.1%), one coffee a day (14.8%), 2 coffees a day (2.5%) and more than 3 coffees a day (1.6%); energetic drinks with alcohol consumption: never (73.1%), rarely (19.4%), on a monthly basis (4.8%), on a weekly basis (2%) and on a daily basis (0.7%); Difficulty falling asleep: never (60.2%), on a monthly basis (14.5%), on a weekly basis (9.1%), more than once a week (7.9%) and on a daily basis (8.3%); Fatigue: feeling exhausted: never (39.2%), on a monthly basis (21.5%), on a weekly basis (14.9%), more than once a week (12.6%) and on a daily basis (11.7%); Hours of Computer use weekdays: never (12.2%), half an hour (18.3%), one hour (22.4%), 2 hours (18.1%), 3 hours (11.9%), 4 hours (6.6%), 5-6 hours (6.1%) and 7 hours or more (4.6%); Hours of Computer use weekends: never (7.2%), half an hour (9.4%), one hour (14.4%), 2 hours (16.4%), 3 hours (14.3%), 4 hours (12.2%), 5-6 hours (14%) and 7 hours or more (11.9%); Kidscreen 10 (health related quality of life) – M =37.59; SD 6.55; Hours of sleep during week days – M =7.78h; SD 1.11; and Hours of sleep during weekends – M =8.79h: SD 1.39.
When analysed by gender (Table 1), boys have a better perception of health related quality of life, drink more soft drinks with caffeine, more coffee, and more energetic drinks with alcohol;
furthermore, patterns related to quantity and quality of sleep present gender variations that benefit boys. Girls sleep less during the week and longer during the weekend, besides, they report more difficulties falling asleep and report more fatigue. No gender differences were found regarding computer use, neither on weekdays or weekends.
Using grade as a proxy for age, older adolescents (those attending the 8th grade) seem more prone to have a lower perception of their health related quality of life, take more coffee and energetic drinks with alcohol, sleep poorly, use more computer during the week, and seem more prone to compensate reduced sleep during weekends (Table 2).
Table 1. ANOVA comparisons for gender (all categorial variables except demographics were transformed into Z scores)
N M SD F p Kidscreen10 Boy 1754 39.1 6.4 174.59 .000 Girl 1967 36.2 6.4 Softdrinks with caffeine Boy 1794 .10 1.0 36.63 .000 Girl 2022 -.09 1.0 Coffee Boy 1785 .07 1.1 16.76 .000 Girl 2016 -.06 .8
Energetic drinks with alcohol Boy 1775 .08 1.1 21.60 .000 Girl 1996 -.07 .9 Hours of sleep on weekdays Boy 1714 7.9 1.1 20.92 .000 Girl 1938 7.7 1.1 Hours of sleep on weekends Boy 1615 8.7 1.5 16.73 .000 Girl 1864 8.9 1.3 Fatigue Boy 1755 -.21 .9 153.96 .000 Girl 1967 .18 1.0 Difficulty falling asleep Boy 1755 -.18 .9 106.45 .000 Girl 1966 .16 1.1
Computer use week Boy 1620 .01 1.0 .19 .661
Girl 1845 -.01 .9
Computer use. weekends
Boy 1621 -.02 1.0 1.62 .203
Girl 1844 .02 .9
Table 2. ANOVA comparisons for grade (all categorial variables except demographics were transformed into Z scores)
N M SD F p
Kidscreen10 8th grade 2248 38.25 6.55 56.94 .000
10th grade 1473 36.60 6.44
Soft drinks with caffeines 8th grade 2323 -.01 1. .47 .492
10th grade 1493 .01 1.
Coffee 8th grade 2311 -.06 .9 25.64 .000
10th grade 1490 .10 1
Energetic drinks with alcohol 8th grade 2293 -.11 .9 73.40 .000
10th grade 1478 .17 1.
Hours of sleep on weekdays 8th grade 2199 8 1.1 164.44 000
10th grade 1453 7.5 1.0
Hours of sleep on weekends 8th grade 2067 8.7 1.5 6.8 000
10th grade 1412 8.9 1.3
Fatigue 8th grade 2249 -.13 1. 93.84 .000
10th grade 1473 -.19 1.
Difficulty falling asleep 8th grade 2248 -.04 1. 10.49 .001
10th grade 1473 -.06 1.
Computer use week 8th grade 2059 -.02 1. 2.12 .146
10th grade 1406 .03 .9
Computer use weekends 8th grade 2058 -.05 1. 14.86 .000
Modelling the relationships between the hours sleep during weekdays, using the remaining variable as independent variables (used as Z scores, with exception of Kidscreen10 and hours of sleep during weekends), an adequate model was achieved, F(11,3177) = 85.93, p<.001), which explained 22.7% of the variance. As it is clear from Table 3, the variables positively associated with hours of sleep during weekdays are weekend sleep duration and the perception of health related quality of life; while the use of energetic drinks (coffee and soft drinks with caffeine), weekdays computer use, fatigue and difficulties falling asleep have a significant negative impact.
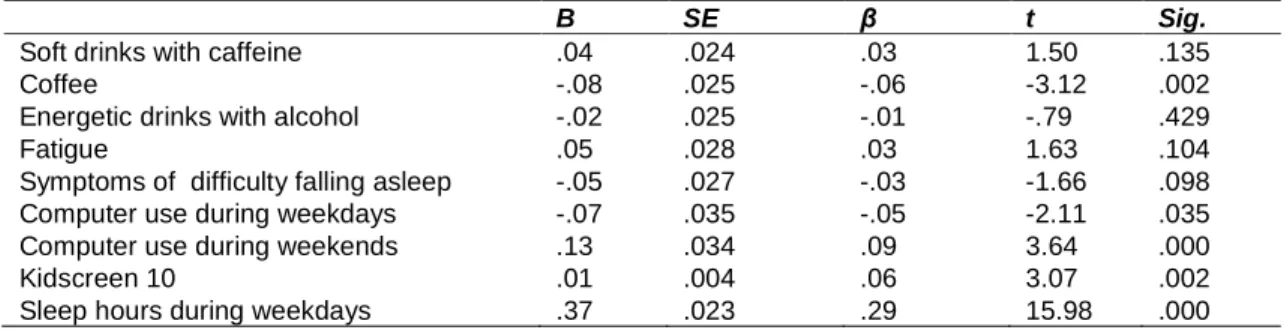
When modelling the relationships between the hours of sleep during weekends, using the remaining variables as independent variables (used as Z scores, with exception of Kidscreen and hours of sleep during weekends), an adequate model was achieved, F(11,3177) = 37.63, p<.001), explaining 11.2% of the variance. As it is clear from the inspection of Table 4, not only all independent variables have a low impact on the dependent variable, but the only variable
with an average impact is sleep duration during the weekdays. However, coffee consumption, hours of computer use and the perception of health related quality of life have a significant impact on the number of hours of sleep during weekend. There is a positive association between the use of computers during the weekends and the sleep duration in this same period.
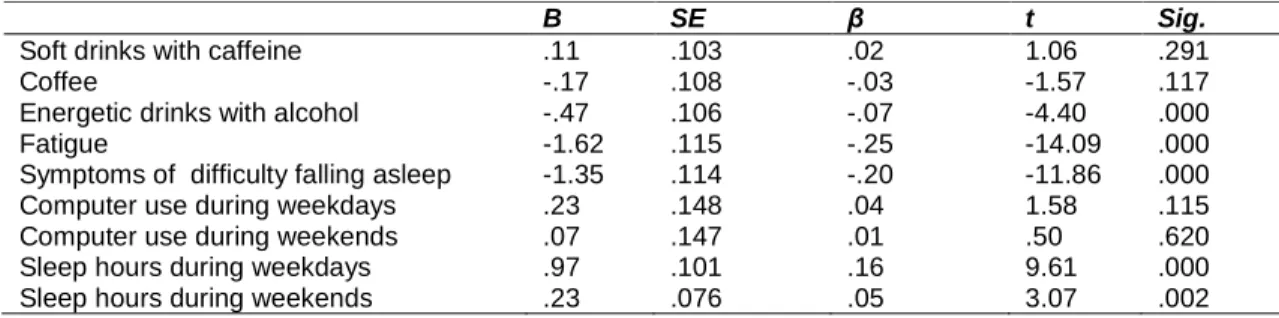
The model concerning the relationships between Kidscreen10 (health related quality of life), using the remaining variables as independent variables (used as Z scores, except for hours of sleep both during weekdays and weekend), an adequate model was achieved, F (11, 3177) = 109., 87, p<.001), that explained 27.3% of the variance. In Table 5, the variables associated with Kidscreen10 are related to sleep features, sleep duration in weekdays and weekends. Fatigue and difficulties falling asleep have important negative impacts, together with the consumption of energetic drinks with alcohol. Computer use and soft drinks with caffeine consumption do not impact the perception of health related quality of life.
Table 3. Multiplelinear regression analysis using hours of sleep during weekdays as dependent variable and controlling for gender and grade. All categorial variables except
demographics were transformed into Z scores
B SE β t Sig.
Soft drinks with caffeine -.07 .018 -.06 -3.83 .000
Coffee -.08 .019 -.07 -4.20 .000
Energetic drinks with alcohol -.02 .018 -.02 -1.30 .194
Fatigue -.07 .020 -.06 -3.31 .001
Symptoms of difficulty falling asleep -.09 .020 -.08 -4.52 .000
Computer use during weekdays -.07 .026 -.07 -2.85 .004
Computer use during weekends -.04 .025 -.04 -1.54 .123
Kidscreen10 .03 .003 .17 9.61 .000
Sleep hours during weekends .20 .013 .26 15.98 .000
Table 4. Multiple regression analysis using hours of sleep during weekend as dependent variable and controlling for gender and grade. All categorial variables except demographics
were transformed into Z scores
B SE β t Sig.
Soft drinks with caffeine .04 .024 .03 1.50 .135
Coffee -.08 .025 -.06 -3.12 .002
Energetic drinks with alcohol -.02 .025 -.01 -.79 .429
Fatigue .05 .028 .03 1.63 .104
Symptoms of difficulty falling asleep -.05 .027 -.03 -1.66 .098
Computer use during weekdays -.07 .035 -.05 -2.11 .035
Computer use during weekends .13 .034 .09 3.64 .000
Kidscreen 10 .01 .004 .06 3.07 .002
Table 5. Multiple regression analysis using perceived health related quality of life (Kidscreen10) as dependent variable and controlling for gender and grade. All categorial
variables except demographics were transformed into Z scores
B SE β t Sig.
Soft drinks with caffeine .11 .103 .02 1.06 .291
Coffee -.17 .108 -.03 -1.57 .117
Energetic drinks with alcohol -.47 .106 -.07 -4.40 .000
Fatigue -1.62 .115 -.25 -14.09 .000
Symptoms of difficulty falling asleep -1.35 .114 -.20 -11.86 .000
Computer use during weekdays .23 .148 .04 1.58 .115
Computer use during weekends .07 .147 .01 .50 .620
Sleep hours during weekdays .97 .101 .16 9.61 .000
Sleep hours during weekends .23 .076 .05 3.07 .002
4. DISCUSSION AND CONCLUSIONS
During weekdays the consumption of coffee and soft drinks with caffeine is associated with reduced sleep duration and with increased computer time. These results were expected as there is literature defending that the use of stimulants such as caffeine reduce sleep quality and quantity in adolescents [21] and there is research proving that sleep time during weekdays is shortened among teenagers who frequently use certain types of technological devices, such as computers [22]. Both sleep duration and difficulties on its initiation have an important impact upon health related quality of life, while drinking energetic drinks and computer use have poor impact. Our results concerning the link between sleep quality and quantity and health related quality of life have already been identified in previous research [23].
Gender and developmental differences were found. Boys have a better perception of health related quality of life, as repeatedly reported in the literature [17-19], drink more soft drinks with caffeine, coffee, and energetic drinks with alcohol while girls have more often sleep problems and shorter sleep duration during weekdays [12]. The fact that boys consume greater amounts of soft drinks with caffeine and energy drinks has also been reported in a recent study [24]. Older adolescents have a worse perception of their quality of life, as repetedelly reported in the literature [17-19], consume coffee more often and also energetic drinks with alcohol, sleep less and use computer for longer periods of time during the week [25].
This study points out that simultaneously there is a certain consistency in a pattern of poorer and better sleep habits, regarding the number of hours of sleep; in fact, controlling for gender and
grade (as a proxy of age) the number of hours of sleep during weekends and weekdays, not only mutually predicted each other but both have a significant and important association with the perception of wellbeing/quality of life. From the 3 models described, the weakest model is the one which explains sleep during weekends. Other features related to sleep duration and initiation, the perception of health related quality of life, the consumption of soft drinks with caffeine and computer use either during week or weekends, explain poorly or not significantly the number of hours sleep during weekends. This feature confirms previous studies in the area of adolescents sleep, carried out with previous HBSC studies [11-13].
The consumption of coffee and soft drinks with caffeine has an impact on the number of sleep hours during the week, such results were also present in previous studies [3,26,27] showing that caffeine reduces sleep time. Furthermore, coffee consumption also has an impact on sleep hours during weekdays, and it seems that computer use during the weekend is associated with increased sleep hours during weekends suggesting a weekend lifestyle related to computer use and resting from the shorter sleep time during the week.
All features related with sleep duration and initiation has an important impact on health perceived quality of life [23]. Drinking soft drinks with caffeine and computer use have poor impact on health related quality of life. This was an unexpected finding which defied the traditional health assumptions, however, the use of soft drinks with caffeine and computer use may well be related to other non-controlled factors (e.g. socio economic status or being active during leisure time) that may be the “missed link” to a better perception of quality of life in this period of
adolescence [12,13]. The use of energetic drinks with alcohol seems to have no impact on the number of hours of sleep either during weekends or weekdays, but this fact can be due to its relative low use [25].
There are several strengths in this study: it is a national survey [25], integrated in an international study of adolescents’ behaviours [28], and the methodology followed the recommended ethical and statistical requirements. The limitations of the present study are related to the cross sectional nature of the study, that does not allow causality assumptions, to the fact that it is only based in self-reported data and finally to the fact that the data was drawn from a larger broad questionnaire that was not designed to assess specifically the variables considered in this study, which do not allow a indepth study of sleep potential related variables.
Besides the mentioned limitations, this study managed to propose a sound insight into adolescents’ behaviours using a national wide random representative sample. Furthermore this is the first national study in this area, and a continuity of other national studies in the area of sleep’s impact on lifestyles, health and academic achievement in adolescents and young adults,
using previous data from the HBSC study [11-13].
The main conclusions of this study are: 1) There is a considerate prevalence of caffeine consumption among adolescents: 19.8% and 19.0% of the adolescents drink coffee and caffeinated drinks, respectively, on a daily basis (one or more per day) while the use of energetic drinks with alcohol is rare (0.7%); 2) Even though a large percentage of adolescents spend quite some time on a computer, both regular and extreme use increase during weekends: computer time longer than 3 hours or more is practiced by 29.2% of the adolescents during weekdays and by 52.4% during weekends; these values are also impressive for extreme users: 10.7% of the teenagers spent 5 or more hours on a computer during weekdays and 25.9% of them spent the same time on a computer during weekends; 3) Slightly more than a quarter of the teenagers have sleep problems: 26.3% of the adolescents have frequent difficulties in sleep initiation, sleep on average less than 8 hours a day during weekdays and compensate by sleeping on average more than 8 hours during weekends; 4) There is a large prevalence of fatigue among adolescents: 39.2% of the teenagers are tired on a regular basis.
The present results confirm previous studies using previous data of the same HBSC study [11-13] and suggest a need for health promotion interventions in families and in schools together with a warning concerning public policies in the area of sleep, perception of health related quality of life and caffeine intake (and other “sleep killers”) during adolescence. As it was shown by previous literature [11,29] low sleep duration and quality is associated with a poorer school performance. With this in mind it is essential that health promotion actions take place in schools and in the community in order to promote sleep hygiene and other healthy
behaviors as already discussed elsewhere [30-32].
Once more the authors want to stress the relevance of considering adolescents as active participants in every study focusing on adolescents’ health, education or policy measures that intend to have an impact upon their lives [30-32], in this case hearing about how it can be possible to increase their sleep quality and quantity while being able to cope with other responsibilities in other areas of their lifes (school, family, friends, leisure); it is also highlighted that although sleep features are a relevant issue in adolescents’ and young people’s life and health related matters, sleep is a very complex and multifactorial subject whose full comprehensive model is not fully reached within the set of variables disposed in the present survey, as stated before [11-13] suggesting that in the next European survey in 2018, this topic should be further developed.
COMPETING INTERESTS
Authors have declared that no competing interests exist.
REFERENCES
1. Bernstein G, Carroll M, Thuras PD, Cosgrove KP, Roth ME. Caffeine dependence in teenagers. Drug Alcohol Depend. 2002;66(1):1–6.
2. Bernstein G, Carroll M, Dean N, Crosby R, Perwien R, Benowitz N. Caffeine with-drawal in normal school-age children. J Am Acad Child Adolesc Psychiatry. 1998;37: 858–865.
3. Pollak C, Bright D. Caffeine consumption and weekly sleep patterns in US seventh-, eighth-, and ninth-graders. Pediatrics. 2003;111:42-46.
4. Rideout VJ, Foehr UG, Roberts DF. Generation M2: Media in the lives of 8 to 18 year-olds. The Henry J. Kaiser Family Foundation. 2010;1–79.
5. Cui Z, Hardy LL, Dibley MJ, Bauman A. Temporal trends and recent correlates in sedentary behaviours in Chinese children. Int J Behav Nutr Phys Act. 2011;8(1):93. 6. Dumith SC, Garcia LT, Da Silva KS,
Menezes AB, Hallal PC. Predictors and health consequences of screen-time change during adolescence - 1993 Pelotas (Brazil) birth cohort study. J Adolesc Health. 2012;51(6):S16–S21.
7. Nelson MC, Gordon-Larsen P, Adair LS, Popkin BM. Adolescent physical activity and sedentary behavior: Patterning and long-term maintenance. Am J Prev Med. 2005;28(3):259–266.
8. Gamito P, Morais D, Oliveira J, Brito R, Rosa PJ, de Matos MG. Frequency is not enough: Patterns of use associated with risk of Internet addiction in Portuguese adolescents. Cmput Hum Behav. 2016;58: 471-478.
9. Cain N, Gradisar M. Electronic media use and sleep in school-aged children and adolescents: A review. Sleep Med. 2010;11(8):735–742.
10. Nuutinen T, Ray C, Roos E. Do computer use, TV viewing, and the presence of the media in the bedroom predict school-aged children’s sleep habits in a longitudinal study? BMC Public Health. 2013;13(1): 684.
11. Matos MG, Gaspar T, Tomé G, Paiva T. Sleep variability and fatigue in adolescents: Associations with school-related features, Int J Psychol; 2015. 12. Paiva T, Gaspar T, Matos M. Sleep
deprivation in adolescents: correlations with health complaints and health-related quality of life. Sleep Med. 2015;16(4):521-527.
13. Paiva T, Gaspar T, Matos M. Sleep deprivation correlations with risk behaviors in adolescents: Results from a Portuguese national survey. Sleep Med. 2013;14(1): e32-e33.
14. Li S, Arguelles L, Jiang, F, Chen, W, Jin X, Yan C, Shen X. Sleep, school performance, and a school-based intervention among school-aged children: A sleep series study in China. PLoS ONE. 2013;8(7).
15. Fallone G, Acebo C, Seifer R, Carskadon M. Experimental restriction of sleep
opportunity in children: Effects on teacher ratings. Sleep. 2005;28(12):1561–1567. 16. Paavonen EJ, Räikkönen K, Lahti J, Komsi
N, Heinonen K, Pesonen AK, et al. Short sleep duration and behavioral symptoms of attention-deficit/hyperactivity disorder in healthy 7 to 8-year-old children. Pediatrics. 2009;123(5):e857–e864.
17. Cavallo F, Dalmasso P, Ottová-Jordan V, Brooks F, Mazur J, Välimaa, R, et al. Trends in life satisfaction in European and North-American adolescents from 2002 to 2010 in over 30 countries. Eur J Pub Health. 2015;25(2):80-82.
18. Cavallo F, Dalmasso P, Ottová-Jordan V, Brooks F, Mazur J, Välimaa, R, et al. Trends in self-rated health in European and North-American adolescents from 2002 to 2010 in 32 countries. Eur J Pub Health. 2015;25(2):13-15.
19. Gaspar T, Ribeiro JP, Matos MG, Leal I, Ferreira A. Health-related quality of life in children and adolescents: Subjective well being. Span J Psychol. 2012;15:177-186. 20. Maroco J. Análise estatística com
utilização do SPSS. Lisboa: Edições Sílabo; 2007.
21. Lohsoonthorn V, Khidir H, Casillas G, Lertmaharit S, Tadesse M, Pensuksan W, et al. Sleep quality and sleep patterns in relation to consumption of energy drinks, caffeinated beverages, and other stimulants among Thai college students. Sleep Breath. 2013;17:1017–1028.
22. Arora T, Broglia E, Thomas GN, Taheri S. Associations between specific techno-logies and adolescent sleep quantity, sleep quality, and parasomnias. Sleep Med. 2014;15(2):240–247.
23. Léger D, Morin CM, Uchiyama M, Hakimi Z, Cure S, Walsh JK. Chronic insomnia, quality-of-life, and utility scores: comparison with good sleepers in a cross-sectional international survey. Sleep Med. 2012;13(1):43–51.
24. Schwartz DL, Gilstad-Hayden K, Carroll-Scott A, Grilo S, McCaslin C, Schwartz M, et al. Energy drinks and youth self-reported hyperactivity/inattention symptoms. Acad Pediatr. 2015;15(3).
25. Santos T, De Matos MG, Simões C, Machado MC. Psychological well-being and chronic condition in Portuguese adolescents. Int J Adolesc Youth. 2015;1-12.
26. Babu KM, Church RJ, Lewander W. Energy drinks: The new eye-opener for
adolescents. Clin Pediatr Emerg Med. 2008;9(1):35–42.
27. Millichap J, Yee M. The diet factor in pediatric and adolescent migrain. Pediatr Neurol. 2003;28(1):9–15.
28. Currie C, Zanotti CF, Morgan A, Currie DB, de Looze M, Roberts C, et al. Social determinants of health and well-being among young people. Health Behaviour in School-aged Children (HBSC) study: international report from the 2009/2010 survey. HEPCA, WHO Regional Office for Europe, Denmark. 2012;6.
29. Li S, Arguelles L, Jiang F, Chen W, Jin X, Yan C, et al. Sleep, school
performance, and a school-based inter-vention among school-aged children: A sleep series study in China. PLoS ONE. 2013;8(7).
30. Matos MG, Morgan A, Team, SA. Roads to whatever? Or roads to a self-fulfilled future? Health assets and well-being in
children and adolescents. In Labirintos da Adolescência - Roads to Whatever, ed. Funcação Calouste Gulbenkian; 61-85. Lisboa: Fundação Calouste Gulbenkian; 2012
31. Matos MG, Sampaio D, Baptista I, Team SA. Adolescent’s health education and promotion in Portugal: a case study of planning for sustainable practice. In The Implementation of health promoting schools, exploring the theories of what, why and how, ed. Samdal O, Rowling L, 2013;123-126. New York: Routledge Taylor & Francis Group.
32. Matos MG. Aventura Social: da Investigação à Intervenção em Grupos com jovens e no espaço intergeracional. In Neufeld C, (eds.). Terapia cognitivo-comportamental em grupo para crianças e adolescentes, ed. Neufeld, C., na - na. ISBN: 978-85-8271-210-8. Porto Alegre: Artmed; 2015.
_________________________________________________________________________________
© 2016 Matos et al.; This is an Open Access article distributed under the terms of the Creative Commons Attribution License (http://creativecommons.org/licenses/by/4.0), which permits unrestricted use, distribution, and reproduction in any medium, provided the original work is properly cited.
Peer-review history:
The peer review history for this paper can be accessed here: http://sciencedomain.org/review-history/14741