SPATIAL VARIABILITY OF EUCALYPTUS AND PHYSICAL ATTRIBUTES OF SOIL FERTILIZED WITH LIME MUD AND MINERAL FERTILIZER
Elizeu de Souza Lima1, Rafael Montanari2, Lenon Henrique Lovera1, Marcelo Carvalho Minhoto Teixeira Filho2, Vinícius Evangelista da Silva2, César Gustavo da Rocha Lima2
1Faculdade de Engenharia Agrícola, Universidade Estadual de Campinas. E-mail: [email protected], [email protected]
2Universidade Estadual Paulista "Júlio de Mesquita Filho", Campus de Ilha Solteira. E-mail: [email protected], [email protected], [email protected], [email protected]
ABSTRACT
The objective of this article was to analyze the linear correlations of the single development of
Eucalyptus urograndis trees based on the physical attributes of the soil in order to evince specific areas
of management to make sustainable use of cellulose residue in a Typic Quartzipisamment. For this purpose, we used lime sludge associated with a mineral fertilizer to verify linear correlations and spatial dependence between plant and soil as well as the effect of the residue applied to the soil in the physical-environmental quality. We collected attributes of plant and soil to establish the physical attributes on the layers of 0-0.20 m and 0.20-0.40 m in an experimental mesh of approximately 2000 m2, containing 50 sampling points. On the scope of Geostatistics, a spatial dependence occurred for attributes GM2, VM2, RD1, RD2, and Clay1. The maps of Kriging allowed to visualize the distribution of the physical attributes of the soil.
Keywords: Soil management, cellulosic residues, forestry
VARIABILIDADE ESPACIAL DO EUCALIPTO E DOS ATRIBUTOS FÍSICOS DO SOLO ADUBADO COM LAMA DE CAL E FERTILIZANTE MINERAL
RESUMO
O objetivo com esta pesquisa foi analisar as correlações lineares do desenvolvimento individual das árvores de Eucalyptus urograndis em função dos atributos físicos do solo, objetivando-se evidenciar zonas específicas de manejo no intuito da utilização do resíduo de celulose de maneira sustentável ao ambiente, em um Neossolo Quartzarênico. Para isso, utilizou-se a lama de cal associado a um fertilizante mineral, a fim de verificar correlações lineares e dependência espacial entre planta e solo e, efeito do
resíduo aplicado ao solo na qualidade físico-ambiental. Foram coletados atributos de planta e solos para a determinação dos atributos físicos nas camadas de 0-0,20 m e 0,20-0,40 m em uma malha experimental de aproximadamente 2000 m2, contendo 50 pontos amostrais. No âmbito da geoestatística houve dependência espacial para os atributos UG2, UV2, DP1, DP2 e Argila1. Os mapas de krigagem permitiram visualizar a distribuição dos atributos físicos do solo.
Palavras-chave: Manejo do solo, resíduos celulósicos, silvicultura
INTRODUCTION
Forests of Eucalyptus spp are cultivated through sustainable management with the objective to reduce impacts on the environment and generate both economic and social development to surrounding communities. By using advanced technologies of management and control of forests, companies of cellulose and paper seek to reach optimum sustainability practices for the environmental areas influenced by them.
The soils of the Cerrado region are old and highly weathered with low fertility, low CTC, high acidity, and high saturation by aluminum. In this ecosystem, the development of the roots is shortened upon the presence of excess aluminum and can also be affected by calcium deficiency, restricting the absorption of water and nutrients leading to decreased productivity of wood from eucalyptus (COSTA et al., 2014).
The industries of paper and cellulose generate many types of residues including approximately 48 Mg of to each 100 Mg of cellulose produced, consequently leading to environmental issues regarding destination (BELLOTE et al., 1998). Among these residues, lime sludge has the potential to neutralize the acidity of the soil and improve its physical quality in forest and agricultural areas providing the plants with nutrients (MEDEIROS et al., 2009).
The discharge of these residues into the soil in cultivations of eucalyptus has proved a more adequate alternative, especially considering how necessary limestone is to the soils of tropical regions on the surroundings of several industries of paper and cellulose. Such soils have high pH buffering, which is associated with the conditions of acidity related to high contents of organic matter and exchangeable Al (MEDEIROS et al., 2009). Therefore, its chemical correction may be limited by high cost, especially
in the locations which are more distant from limestone distributors, characterizing an interesting use as acidity correctives for improving the chemical and physical conditions of the soils.
Studies on the residues of the cellulose industry in forestry cultivations have provided the following favorable effects to the soil: decreased pH and consequent increased availability of some nutrients, such as phosphorus and micronutrients; increased cations exchange capacity in the soil; improvement of physical attributes such as water retention capacity and soil density in addition to increasing the biological activity of the soil accelerating the decomposition of burlap and nutrients cycling (BELLOTE et al.,1998).
Forestry enterprises have sought an efficiency of both planning and management processes involving practices of reforestation execution and demanded specific knowledge on the species cultivated as well as the site for their production. However, the traditional methods used to assess both the development and the productivity of the forests is the measure of central tendency, which is generally average, in addition to a measure of dispersion, such as variance, without considering the affinities existing between surrounding samplings. Therefore, with an increase in the necessity of further information on a production area, the use of accuracy instruments is materialized applied to forestry (PELISSARI et al., 2012).
Geostatistical analysis is used to study the spatial variability of the attributes of both soil and plant to benefit the decision on the location of the experiments and interpretation of the results and requires the collection of samples previously planned with the accurate spatial position to each sampling point (MONTANARI et al., 2012).
Considering the abovementioned aspects, our objective was to analyze the linear correlations of the individual development of the Eucalyptus urograndis trees according to the physical attributes of the soil seeking to evince the specific areas of management in order to use lime sludge in a sustainable way using a Typic Quartzipisamment.
MATERIAL AND METHODS
This study was developed along the year of 2014 at the experimental area of the Bom Retiro Farm, a property of Eldorado Brasil Celulose, located in the municipality of Três Lagoas, MS, latitude 20o27’ S, longitude 52o29’ W, with a mean annual rainfall of 1300 mm and mean temperature of 23.7 °C. Climate type is Aw, according to Köppen classification, characterized as humid tropical with a rainy
season during the summer and a dry season along the winter. The soil in which the experimental mesh was installed is classified as Typic Quartzipisamment (EMBRAPA, 2013).
Initially, in March 2014, was carried out the cultivation of Eucalyptus urograndis seedlings using a spacing of 3 x 2.5 m (between lines and between plants) as well as the collection of soil samples from the area aiming at its physical characterization, including both deformed and undeformed samples considering two different depths (0.00-0.20 m and 0.20-0.40 m), analyzed according to methodology by Embrapa (2011) and Stolf (1991). For this purpose, the locations to the collection of the simple samples were established randomly in the line spacings of the eucalyptus.
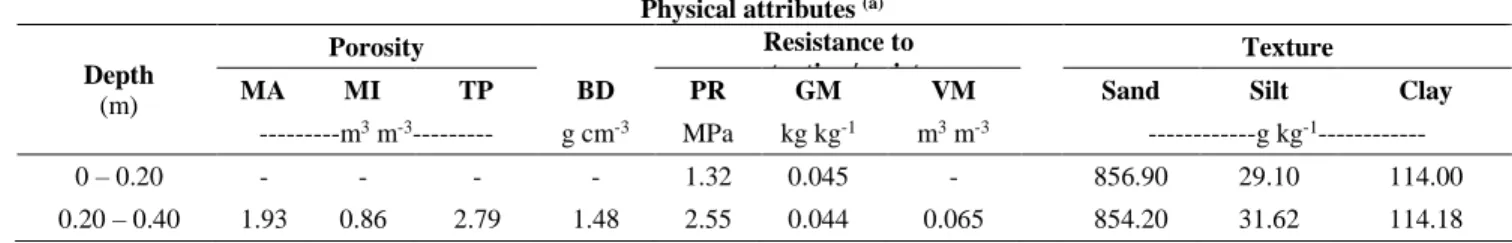
Therefore, we established the following physical attributes of the soil: macroporosity (MA), microporosity (MI), total porosity (TP), bulk density (BD), penetration resistance (PR), gravimetric moisture (GM), volumetric moisture (VM), contents of sand, silt and clay (Table 1).
Table 1. Initial analysis of some physical attributes of the soil studied upon the application of Lime
sludge + Oxyfertil, Três Lagoas-MS, March 2014.
MA, MI, TP, BD, PR, GM, and VM are respectively: macroporosity, microporosity, total porosity, bulk density, penetration resistance, gravimetric moisture, volumetric moisture collected on layers of 0.00-0.20 and 0.20-0.40 m of the soil.
The treatment consisted of lime sludge + oxyfertil, where the mesh received 2 Mg ha-1 of the compound containing 60% of lime sludge and 40% of oxyfertil. The lime sludge was constituted of 24% of CaO and 0.1% of MgO; the oxyfertil was constituted of 60% of CaO and 30% of MgO. The application was mechanical through limestone spreader upon three months of eucalyptus cultivation.
We defined directions x and y of the Cartesian coordinates system and according to the spacing of the eucalyptus plants, we proceeded with the overall stacking of the experimental mesh constituted of five transects, forming approximately 2 ha, containing 50 sampling points. The sampling spacing was of 7.5 x 3.0 m.
The attributes (soil and plant) were collected at the surroundings of each tree representing the sampling point three months after the application of lime sludge and six months after the cultivation of eucalyptus. The attributes of plant were height (HEI) – measured using a meter graduated scale and diameter at breast height (DBH) – measured at a height of 1.30 m of the soil by using a digital
Physical attributes (a)
Depth
(m)
Porosity Resistance to
penetration/moisture
Texture
MA MI TP BD PR GM VM Sand Silt Clay
---m3 m-3--- g cm-3 MPa kg kg-1 m3 m-3 ---g kg-1---
0 – 0.20 - - - - 1.32 0.045 - 856.90 29.10 114.00
pachymeter. The attributes of the soil were mechanical penetration resistance (PR) and collection of both deformed and undeformed soil samples in order to establish gravimetric moisture (GM), volumetric moisture (VM), bulk density (BD), real density (RD), total porosity (TP), and texture, collected at depths of 0.00-0.20 and 0.20-0.40 m. It is worth emphasizing that it was not possible to collect undeformed soil samples at depth of 0.00-0.20 m due its highly sandy nature.
The impacting penetrometer was used to assess soil penetration resistance (PR) individually at each sampling point established according to Stolf (1991) simultaneously to the soil collection for gravimetric moisture determination. The remaining attributes were established according to methodologies by Embrapa (2011). All of the analyses were conducted at the Laboratory of Soil Physics of the School of Engineering of Ilha Solteira – UNESP.
Each attribute studied received a classic statistical descriptive analysis using SAS software to calculate the average, median, mode, minimum and maximum values, standard deviation, variation coefficient, kurtosis, and asymmetry. The analysis of distribution of data frequency was also carried out. In order to test the hypothesis of regularity or indetermination of attributes, we applied the Shapiro & Wilk (1965) test at 1%, in which statistics W tests the null hypothesis, regarded as the sample derived from a population with regular distribution.
We built the correlation matrix among all of the attributes analyzed, containing all possible paired combinations in order to verify the existence of significant correlations between the plant (dependent variables) and soil (independent variables) attributes. We also tested the multiple regression between the dependent variables (plant) versus all of the independent ones (solo) aiming at selecting those which, in the proper cases, would provide the most satisfactory cause-effect relationships.
The geostatistical analysis was carried out using Gamma Design Software 7.0 (GS+, 2004) including the spatial dependence through the semivariogram calculation based on the assumptions of stationarity in the intrinsic hypothesis. We adjusted the simple semivariograms to all of the attributes studied from both plant and soil. For the elaboration of the Kriging maps, we used the Gamma Design Software 7.0 (GS+, 2004) set of softwares as well as Surfer 8.0 (Golden Software, 2002).
RESULTS AND DISCUSSION
According to the classification of the variation coefficient (VC) proposed by Pimentel-Gomes & Garcia (2002), the variability of an attribute may be categorized according to the magnitude of its variation coefficient. Therefore, Table 2 presents the descriptive analysis of the attributes studied. Height
(HEI) had a mean variability with variation coefficient of 18.23% corroborating Rosa Filho et al. (2011), who had found median value of 14.4% when assessing the productivity and attributes of the soil in a
Eucalyptus urophylla forest site. The result also agrees with Lima et al. (2010), who verified mean values
of variation coefficient for the HEI of 12.0%, respectively. Diameter at breast height (DBH) presented high variability with variation coefficients of 23.45%.
Table 2. Initial descriptive analysis of plant and soil in a Typic Quartzipisamment upon application
of Lime Sludge + Oxyfertil, Três Lagoas-MS, June 2014.
Attribute (a)
Descriptive statistical measures
Average Mean
Value
Standard Deviation
Coefficient Test Probability
(b)
Minimum Maximum Variation
(%)
Kurtosis Asymmetry Pr<w DF
Plant attributes
ALT (m) 3.51 3.60 1.70 4.50 0.64 18.23 0.03 -0.63 0.0759 NO
DAP (m) 0.027 0.028 0.010 0.036 0.006 23.45 0.20 -0.83 0.0120 IN
Soil physical attributes
RP1 (MPa) 2.98 3.00 5.00 2.00 0.69 22.98 1.83 0.82 0.0001 IN RP2 (MPa) 3.38 3.47 1.80 4.86 0.66 19.52 -0.40 0.04 0.6871 NO UG1 (kg kg-¹) 0.03 0.03 0.02 0.05 0.006 18.91 -0.13 0.18 0.9504 NO UG2 (kg kg-¹) 0.04 0.04 0.03 0.06 0.004 10.68 1.04 0.25 0.0779 NO UV2 (m³ m-3) 0.06 0.06 0.05 0.08 0.007 11.55 -0.05 0.03 0.9417 NO DS2(Mg m-3) 1.45 1.46 1.25 1.60 0.09 6.56 -0.99 -0.33 0.0312 IN DP1 (Mg m-3) 2.70 2.70 2.63 2.78 0.04 1.39 -0.17 0.12 0.0011 IN DP2 (Mg m-3) 2.70 2.70 2.67 2.74 0.03 1.01 -1.20 0.37 0.0001 IN PT2 (m3 m-3) 0.46 0.96 0.40 0.54 0.04 7.52 -1.02 0.31 0.0204 IN Sand1 (g kg-1) 888.9 888.20 871.00 907.00 7.32 0.82 0.10 0.19 0.9175 NO Sand2 (g kg-1) 883.5 883.00 871.00 897.50 6.43 0.73 -0.65 0.21 0.6169 NO Silt1 (g kg-1) 31.91 32.90 18.60 39.70 5.72 17.91 -0.94 -0.44 0.0083 IN Silt2 (g kg-1) 31.36 31.80 16.50 39.70 5.42 17.26 -0.29 -0.45 0.11033 NO Clay1 (g kg-1) 79.19 78.35 70.10 97.60 5.46 6.90 1.32 0.75 0.0736 NO Clay2 (g kg-1) 85.08 84.10 78.20 93.50 3.84 4.51 -0.85 0.46 0.0150 IN
HEI = height of trees; DBH = diameter at breast height; PR, GM, VM, BD, RD, TP, Sand, Silt, and Clay from 1 to 2, are respectively mechanical resistance to penetration, gravimetric moisture, volumetric moisture, bulk density, real density, total porosity, sand, silt, and clay collected on layers of 0.00-0.20 and 0.20-0.40 m of soil; (b) DF = distribution of frequency, including NO and IN respectively of type regular and indefinite.
Sand1, Sand 2, Clay1, Clay2, BD2, RD1, RD2, and TP2 had low variability (Table 2) with variation coefficients between 0.73 - 7.52%. For PR2, GM1, GM2, Silt1, Silt2, and UV2, the mean variation coefficients were between 10.68 - 19.52%. However, the attributes PR1 obtained high variation coefficients of 22.98%. The values found for Sand, Clay and DS are similar to those found by Araújo et al. (2014), who obtained low variation coefficient for the same attributes when studying a Typic Quartzipisamment of loamy texture. The variation coefficient should be used as parameter to validate the mean values found since, according to Pimentel-Gomes & Garcia (2002), a variation coefficient
above 30% reveals that the average has low significance, and values above 60% reflect a very heterogeneous set of data canceling the confidence of the average. However, if below 30%, data are homogeneous and the average is significant and able to be used as representative for the data obtained.
The DBH presented frequency distribution of indefinite type, with a negative asymmetry coefficient of -0.83. The kurtosis coefficient was positive, with a value of 0.20, not significant at a 5% probability through regularity test, with a value of 0.0120. The ALT presented frequency distribution of regular type with a negative asymmetry coefficient of -0.63 and positive kurtosis coefficient of 0.03, similarly to the findings by Lima et al. (2010), Rosa Filho et al. (2011), and Carvalho et al. (2012). These values were also in accordance with the regular distributions found by Andreotti et al. (2010), Montanari et al. (2010), and Basso et al. (2011), when researching plant productivity according the geostatistical precepts. However, and regardless such coefficients, these attributes were significant at 5% probability through the Shapiro & Wilk regularity test (1965) since their respective probabilities were 0.0759 and 0.1263, that is, of regular frequency distribution (Table 2).
Attributes PR2, GM1, GM2, VM2, Sand1, Sand2, Silt2, and Clay1 presented frequency distribution of regular type, therefore the respective measures of central tendency should be represented by the mean values, with positive asymmetry coefficients between 0.03 and 0.75, as well as negative value of -0.45. The positive kurtosis coefficients were between 0.10 and 1.32, and the negative values between -0.65 and -0.05; all of these coefficients were significant at 5% probability through regularity test, since the respective probabilities varied between 0.0736 and 0.9504 (Table 2).
For attributes PR1, BD2, RD1, RD2, TP2, Silt1, and Clay2 presented frequency distribution of undefined type, therefore, the respective measures of central tendency should be represented by the median values. Such attributes had positive asymmetry coefficients between 0.12 and 0.82 and negative values of -0.44 and -0.33. The positive kurtosis coefficient was of 1.83 for the PR1 and negative between -1.20 and -0.17; none of these coefficients were significant at 5% probability through regularity test since their respective probabilities varied between 0.0001 and 0.0312, that is, frequency distribution of indefinite type (Table 2).
The mean value found for the HEI was of 3.51 m and the median found for the DBH was of 0.027 m – extremely low values due to the six-month cultivation eucalyptus.
Hereinafter, the mean values found according to the attributes: PR2 (3.38 MPa), GM1 (0.03 kg kg-1), GM2 (0.04 kg kg-1), VM2 (0.06 m3 m-3), Sand1, and Sand2 (888.9 and 883.5 g kg-1), Silt2 (31.36 g kg-1), Clay1 (79.19 g kg-1). Arshad et al (1996) consider these values of RP to be high. A value of
mechanical resistance to penetration above 2.0 MPa restricts the growth of roots, while for those with values below 1.0 Mpa, the resistance may be assumed as low. However, non-revolved soils on a yearly basis and/or those cultivated with eucalyptus are tolerable at values of PR up to 4.0 MPa due to the permanence and continuity of pores occurring when the roots reach high depths, leading to a more active biological activity and greater stability of aggregates (CARVALHO et al. 2012).
Hereinafter, the median values found according to the attributes: PR1 (3.00 MPa), BD2 (1.46 Mg m-3), RD1, and RD2 (2.70 Mg m-3), TP2 (0.96 m3 m-3), Silt1 (32.90 g kg-1), Clay2 (84.10 g kg-1) (Table 2). Such results disagree with those found by Carvalho et al. (2015) when assessing the physical attributes of a Typic Quartzipisamment in a Eucalyptus urograndis population (having obtained RP of 0.34 MPa, BD of 1.59 Mg m-3, and TP of 0.39 m3 m-3. This differentiation between the two studies occurred due to the rearrangement of the soil particles resulting in higher values of mechanical resistance to penetration and soil density as well as lower total porosity.
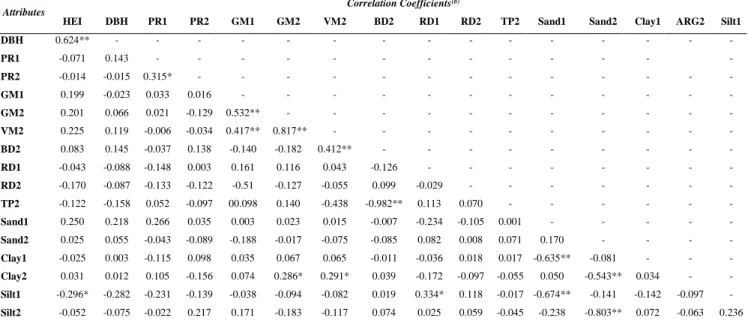
Table 3 presents the simple linear correlation matrix between the attributes of eucalyptus and physical attributes of the soil. In general, the direct correlations were HEI x DBH (r = 0.624**), PR1 x PR2 (r = 0.315*), GM1 x GM2 (r = 0.532**), GM1 x VM2 (r = 0.417**), GM2 x VM2 (r = 0.817**), VM2 x BD2 (r = 0.412**), GM2 x CLAY2 (r = 0.286*), VM2 x CLAY2 (r = 0.291*), and RD1 x Silt1 (r = 0.334*), considering that the increase in an attribute leads to an increase in another at the forest site of Eucalyptus urograndis. Such direct correlations between the attributes of physical nature were expected since the increase in soil density reflects both the gravimetric and the volumetric moisture of the soil, resulting in increased mechanical resistance to penetration, which, in turn, decreases the soil permeability and its rate of infiltration into the water.
The values of indirect correlations (Table 3) were BD2 x TP2 (r = -0.982**), Sand1 x Clay1 (r = -0.635**), Sand2 x ARG2 (r = -0.543**), Sand1 x Silt1 (r = -0.674**), Sand2 x Silt2 (r = -0.803**), and HEI x Silt1 (r = -0.296*), indicating a variation inversely proportional between cause and effect, that is, between the variables, illustrating that the lower the soil density the higher its total porosity, as well as the lower the amount of sand in the soil the higher its content of clay and silt, thus suggesting how to manage the study area. Between the attributes of soil and eucalyptus, only Silt1 presented negative, significant correlation; therefore, the individual height of the trees proved higher in areas with lower contents of Silt on the layer of 0.00-0.20 m.
Table 3. Matrix of simple linear correlation of attributes of eucalyptus and a Typic
Quartzipisamment upon application of Lime Sludge + Oxyfertil, Três Lagoas-MS, June 2014.
Attributes Correlation Coefficients
(b)
HEI DBH PR1 PR2 GM1 GM2 VM2 BD2 RD1 RD2 TP2 Sand1 Sand2 Clay1 ARG2 Silt1
DBH 0.624** - - - - PR1 -0.071 0.143 - - - - PR2 -0.014 -0.015 0.315* - - - - GM1 0.199 -0.023 0.033 0.016 - - - - GM2 0.201 0.066 0.021 -0.129 0.532** - - - - VM2 0.225 0.119 -0.006 -0.034 0.417** 0.817** - - - - BD2 0.083 0.145 -0.037 0.138 -0.140 -0.182 0.412** - - - - RD1 -0.043 -0.088 -0.148 0.003 0.161 0.116 0.043 -0.126 - - - - RD2 -0.170 -0.087 -0.133 -0.122 -0.51 -0.127 -0.055 0.099 -0.029 - - - - TP2 -0.122 -0.158 0.052 -0.097 00.098 0.140 -0.438 -0.982** 0.113 0.070 - - - - Sand1 0.250 0.218 0.266 0.035 0.003 0.023 0.015 -0.007 -0.234 -0.105 0.001 - - - - - Sand2 0.025 0.055 -0.043 -0.089 -0.188 -0.017 -0.075 -0.085 0.082 0.008 0.071 0.170 - - - - Clay1 -0.025 0.003 -0.115 0.098 0.035 0.067 0.065 -0.011 -0.036 0.018 0.017 -0.635** -0.081 - - - Clay2 0.031 0.012 0.105 -0.156 0.074 0.286* 0.291* 0.039 -0.172 -0.097 -0.055 0.050 -0.543** 0.034 - - Silt1 -0.296* -0.282 -0.231 -0.139 -0.038 -0.094 -0.082 0.019 0.334* 0.118 -0.017 -0.674** -0.141 -0.142 -0.097 - Silt2 -0.052 -0.075 -0.022 0.217 0.171 -0.183 -0.117 0.074 0.025 0.059 -0.045 -0.238 -0.803** 0.072 -0.063 0.236
HEI = height of trees; DBH = diameter at breast height; PR, GM, VM, BD, RD, TP, Sand, Silt, and Clay from 1 to 2, are respectively mechanical resistance to penetration, gravimetric moisture, volumetric moisture, bulk density, real density, total porosity, sand, silt, and clay collected on layers of 0.00-0.20 and 0.20-0.40 m of soil; (b) * significant at 5% and ** significant at 1%.
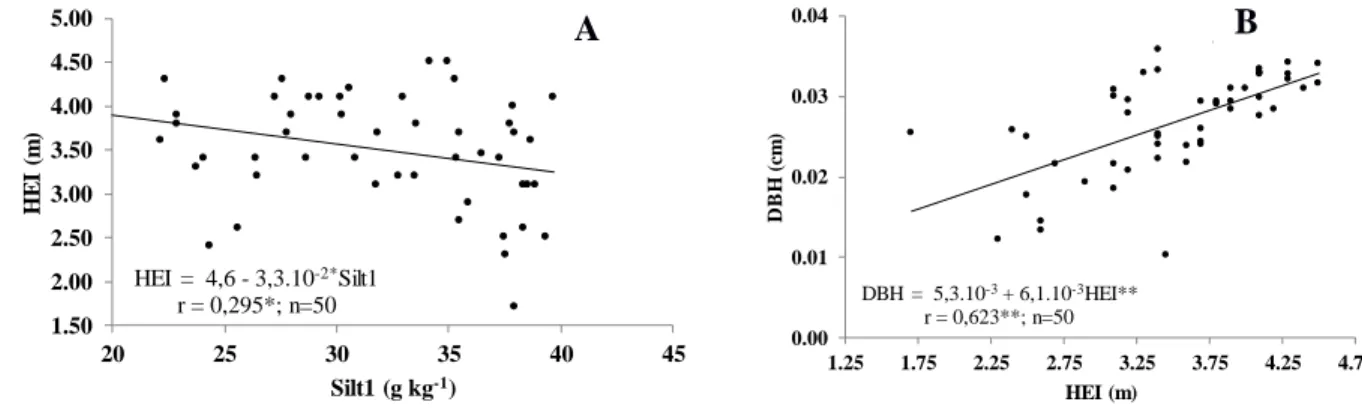
In the scope of the correlation of attributes of plant versus soil (Figure 1), a significant regression of the HEI occurred due to Silt1 (Figure 1A) with low correlation coefficient (r = 0.295*). We verified that the HEI presented an indirect linear variation with Silt1. Thus, the occurrence of maximum Silt1 content (39.7 g Kg-1) will imply the minimum HEI estimated (1.70 m), which indicates that the decrease in Silt1 leads to an increase in the individual growth of the eucalyptus trees, since this relationship is not able to be explained according to information available in the literature nor through the remaining attributes studied. For the environmental conditions of the experiment locations, it probably occurred an influence of other non-assessed physical-chemical and/or biological factors.
The main simple linear regression equations between the attributes researched in the scope of the correlations established between plant and plant as well as plant and soil are presented in Figure 1B. Therefore, the models were exclusively presented for the pairs of attributes which provided significant correlations as well as significant adjunct coefficients for the independent variables.
Figure 1. Regression equations between the attributes of eucalyptus with those of a Typic
Quartzipisamment upon treatment with Lime Sludge + Oxyfertil, Três Lagoas-MS, June 2014.
In the scope of the correlation between the attributes of plant and plant (Figure 1), we observed that the regression equation of the DBH according to the HEI was represented by a linear model (Figure 1B), but with an average, significant, correlation coefficient (r = 0.623**). Therefore, the variation of the DBH may be explained by only 18.3 % of the variation of the HEI data. Thus, whenever the HEI varies between 1.7 and 4.5 m, the DBH increases from 0.157 to 0.327 m. In turn, when considering the mean value of 3.51 of the HEI, the mean DBH can be estimated as 0.267 m. The autocorrelation enabled to estimate the spatial dependence of surrounding samples considering that the presence of a random variable is able to influence its neighbors spatially. The simple semivariogram allowed the propagation of the behavior of the regionalized variable or of its residues, demonstrating the size of the zone of influence surrounding a sample as well as the variation and continuity in the different directions in the space.
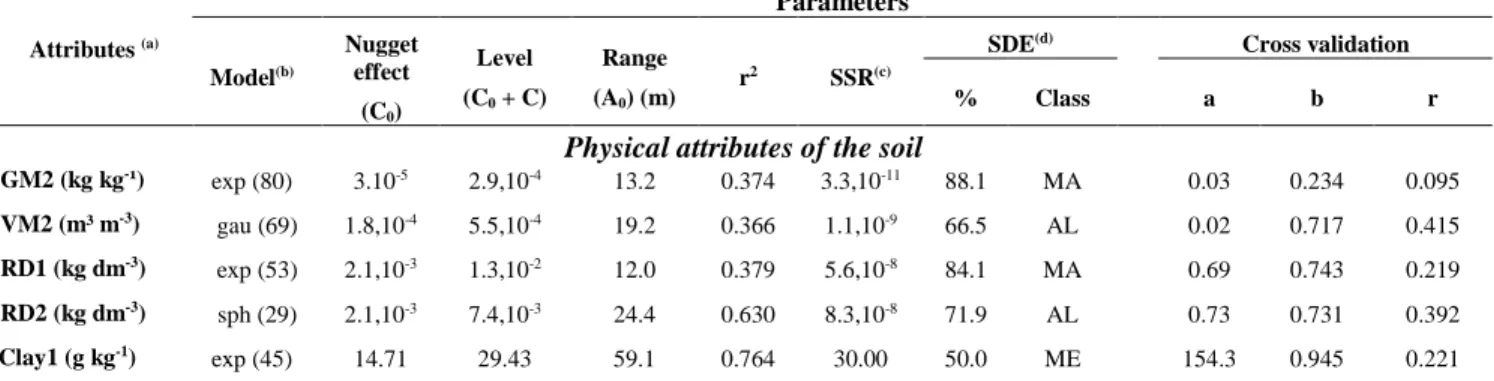
Table 4 presents the parameters of the simple semivariograms for the attributes of plant and soil of a Typic Quartzipisamment in Três Lagoas (MS) upon application of the compound lime sludge + oxyfertil in a cultivation of Eucalyptus urograndis. Therefore, only GM2, VM2, RD1, RD2, and Clay1 proved spatial dependence and all of the remaining ones presented pure nugget effect. By analyzing Table 4, it was possible to observe the variables which presented pure nugget effect (C0 = C + C0) (HEI, DBH, PR1, PR2, GM1, BD2, TP2, sand1, clay2, Silt1, Silt2, and Clay2), that is, without spatial dependence indicating random spatial distribution. In these cases, classical statistics can be applied. The fact of the attributes of plant have presented pure nugget effect may have occurred due to the very new culture (only six months old).
HEI = 4,6 - 3,3.10-2*Silt1 r = 0,295*; n=50 1.50 2.00 2.50 3.00 3.50 4.00 4.50 5.00 20 25 30 35 40 45 H E I (m ) Silt1 (g kg-1) DBH = 5,3.10-3+ 6,1.10-3HEI** r = 0,623**; n=50 0.00 0.01 0.02 0.03 0.04 1.25 1.75 2.25 2.75 3.25 3.75 4.25 4.75 D B H ( cm ) HEI (m) B A
Table 4. Parameters of the simple semivariograms and the crossed validations adjusted to the attributes
of plant and soil in a Typic Quartzipisamment, Três Lagoas-MS, June 2014. Attributes (a) Parameters Model(b) Nugget effect (C0) Level (C0 + C) Range (A0) (m) r2 SSR(c)
SDE(d) Cross validation
% Class a b r
Physical attributes of the soil
GM2 (kg kg-¹) exp (80) 3.10-5 2.9,10-4 13.2 0.374 3.3,10-11 88.1 MA 0.03 0.234 0.095
VM2 (m³ m-3) gau (69) 1.8,10-4 5.5,10-4 19.2 0.366 1.1,10-9 66.5 AL 0.02 0.717 0.415
RD1 (kg dm-3) exp (53) 2.1,10-3 1.3,10-2 12.0 0.379 5.6,10-8 84.1 MA 0.69 0.743 0.219
RD2 (kg dm-3) sph (29) 2.1,10-3 7.4,10-3 24.4 0.630 8.3,10-8 71.9 AL 0.73 0.731 0.392
Clay1 (g kg-1) exp (45) 14.71 29.43 59.1 0.764 30.00 50.0 ME 154.3 0.945 0.221
GM, VM, RD, and Clay of 1 to 2 are respective to gravimetric moisture, volumetric moisture, real density, and clay collected on layers of 0.00-0.20m and 0.20-0.40m of the soil; (b) epp = pure nugget effect; exp = exponential; sph = spherical; gau = Gaussian. (c) SSR = sum of the square of the residues. (d) SDE = spatial dependence evaluator.
However, based on the efficiency of the spatial determination coefficient (r2), we verified that the descending relationship of the semivariograms analyzed through the magnitude of the spatial determination coefficient (r2) as the following: 1) Clay1 (r2 = 0.764), 2) RD2 (r2 = 0.630), 3) RD1 (r2 = 0.379), 4) GM2 (r2 = 0.374), 5) VM2 (r2 = 0.366) (Figure 1, Table 4). Regarding the attributes assessed, we observed that the clay on the layer 0.00-0,20 m presented the best semivariographic adjustment r2 (0.764). The spatial dependence evaluator (SDE), in turn, presented mean spatial dependence (SDE = 50.0%) classified through the exponential model with 45 pairs at the first lag and a range of 59.1 m (Table 4). The RD2 had the second best semivariographic adjustment to its value of r2 (0.630), with an SDE of 71.9%, regarded as high spatial dependence, classified through the spherical model with 29 pairs at the first lag and a range of 24.4 m (Table 4).
The range values varied from 12 to 59 m. However, in the methodological conditions of this research, as well as aiming at benefiting further researches involving the same attributes and treatments, the range values to be used in geostatistical packages, which feed computational packages employed in accuracy forestry, should not be lower than 12 m upon use of the lime sludge + oxyfertil corrective.
The parameters of the crossed validations referent to the Kriging for the attributes of plant and soil, analyzed through the magnitude of the correlation coefficient (r), were the following: 1) VM2 (0.415), 2) RD2 (0.392), 3) Clay1 (0.221), 4) RD1 (0.219), and 5) GM2 (0.095), which is equivalent to state that the model adjusted to the experimental semivariogram produced for attribute VM2 offers a stronger correlation, making it the model with the best adjustment for the elaboration of the Kriging maps.
The attributes which presented spatial dependence were ranked and a sequence similar to that established for the descending magnitude of their ranges. We may highlight that attributes Clay1, RD2, GM2, and VM2 were those which resulted in higher spatial determination coefficient (r2) as well as higher correlation coefficient (r) for the crossed validation. Therefore, such attributes proved plausible indicator of physical quality of the soil upon application of lime sludge + oxyfertil for the correction of the soil.
Regarding the Kriging maps (Figure 2), it is possible to observe an arrangement of spatial distribution of the well-defined physical attributes in the assessed area, which allowed to identify homogenous zones specific to the physics of the soil under cultivation of Eucalyptus urograndis well distinguished for most of the attributes studied. We concluded that in the central-west region of the maps with the occurrence of the highest values of RD1, RD2 and Clay1 the highest values of VM2 were mapped (Figures 2A, B, C, and D). Thus, conservationist practices can be recommended to management zones in which RD1, RD2 and Clay1 presented lower values in order to increase the VM2 in the soil cultivated with eucalyptus.
This behavior may probably be attributed to the increase in RD1, RD 2 and Clay1. Since the soil studied is a Typic Quartzipisamment, we believe that in this case the VM2 is improved, which also improves water retention. From the spatial point of view, RD 1, RD 2 and Clay1 proved an indicator of the physical quality of the soil studied when considering the UV2.
Still, another fact was the occurrence of lower values of GM2 (0.035 kg kg-1), VM2 (0.057 m3 m -3), and Clay1 (77.0 g kg-1) (Figures 2A, B and E) in the southwest region of these Kriging maps.
This identification of the areas regarding their quality facilitates the monitoring of the physical quality of the soil as well as the environmental quality, which can be used in a rational and environmentally friendly way.
Figure 2. Maps of Kriging of the attributes of a Typic Quartzipisamment (GM2, VM2, RD1, RD2,
and Clay1) upon treatment with lime sludge + Oxyfertil, Três Lagoas-MS, June 2014.
CONCLUSIONS
The residue of lime sludge + oxyfertil did not provide the physical attributes studied with alterations.
The Silt contained on the layer of 0.00 - 0.20 m indicated a possible physical quality of the soil, presenting confidence for the height of plants in eucalyptus cultivation in a Typic Quartzipisamment.
The Kriging maps allowed a visualization of the distribution of the physical attributes of the soil representing an important instrument to its management.
A B
C D
ACKNOWLEDGMENTS
The authors would like to thank FAPESP, process number: 2013/25329-5 and the Incentive to resource qualification-FUNDUNESP, process number: 2333/002/14-PROPe/CDC for the financial support as well as to Eldorado Brasil Celulose of Três Lagoas, MS, for having granted the study area.
REFERENCES
ANDREOTTI, M.; CARVALHO M.P. DE; MONTANARI, R.; BASSO F.C.; PARIZ, C.M.; AZENHA, M.V.; VERCESE, F. 2010. Produtividade da soja correlacionada com a porosidade e a densidade de um Latossolo Vermelho do Cerrado Brasileiro. Ciência Rural, Santa Maria, v.40, n.3, p.520-526. ARSHAD, M.A.; LOWERY, B.; GROSSMAN, B. 1996. Physical tests for monitoring soil quality. In:
DORAN, J. W.; JONES, A. J. Methods for assessing soil quality. Madison: Soil Science Society of
America, Madison p.123-141.
ARAÚJO, D.R.; MION, R.L.; SOMBRA W.A.; ANDRADE, R.R.; AMORIM, M.Q. 2014. Variabilidade espacial de atributos físicos em solo submetido à diferentes tipos de uso e manejo.
Revista Caatinga, Mossoró, v.27, n.2, p.101–15.
BASSO, F.C; ANDREOTTI, M.; CARVALHO, M.P.; LODO, B.N. 2011. Relações entre produtividade de sorgo forrageiro e atributos físicos e teor de matéria orgânica de um latossolo do Cerrado. Pesquisa
Agropecuária Tropical, Goiânia, v.41, n.1, p.135-144.
BELLOTE, A.F.J.; SILVA, H.D; FERREIRA, C.A.; ANDRADE, G.C. 1998. Resíduos da indústria da celulose em plantios florestais. Boletim Pesquisa Florestal, Colombo, v., n.37, p.99-106.
CARVALHO, A.P.V.; DIAS, H.C.T.; PAIVA, H. N.; TONELLO, K.C. 2012. Resistência mecânica do solo à penetração na bacia hidrográfica do Riacho Fundo, Felixlândia-MG. Revista Árvore, Viçosa, v.36, n.6, p.1091-1098.
CARVALHO, M.P.; MENDONÇA, V.Z.; PEREIRA, F.C.B.L.; ARF, M.V.; KAPPES, C.; DALCHIAVON, F.C. 2012. Produtividade de madeira do eucalipto correlacionada com atributos do solo visando ao mapeamento de zonas específicas de manejo. Ciência Rural, Santa Maria, v.42, n.10, p.1797-18013.
CARVALHO, R.P.; DANIEL, O.; DAVIDE, A.C.; SOUZA, F.R. 2015. Atributos físicos e químicos de um neossolo quartzarênico sob diferentes sistemas de uso e manejo. Revista Caatinga, Mossoró, v.28, n.1, p.148-59.
COSTA, T.G.; BIANCHI, M.L.; PROTÁSIO, T.P.; TRUGILHO, P.F.; PEREIRA, A.J. 2014. Qualidade da madeira de cinco espécies de ocorrência no cerrado para produção de carvão vegetal. Revista
Cerne, Lavras, v.20, n.1, p. 37-46.
EMBRAPA - Empresa Brasileira de Pesquisa Agropecuária. 2011. Manual de métodos de análise de
solo. Rio de Janeiro: Centro Nacional de Pesquisa de Solos, 230p.
EMBRAPA - Empresa Brasileira de Pesquisa Agropecuária. 2013. Sistema brasileiro de classificação
de solos. Rio de Janeiro: Centro Nacional de Pesquisa de Solos, 353p.
GS+. 2004. Geostatistics for environmental sciences. Plainwell: Gamma Design Software, 159p. GOLDEN SOFTWARE. 2002. Surfer for Windows version 8.0. Colorado: Golden.
LIMA, C.G.R.; CARVALHO, M.P.; NARIMATSU, K.C.P.; SILVA, M.G.; QUEIROZ, H.A. 2010. Atributos físico-químicos de um latossolo vermelho do cerrado brasileiro e sua relação com
características dendrométricas do eucalipto. Revista Brasileira de Ciência do Solo, Viçosa, v.34, n.1, p.163-173.
MEDEIROS, J.C.; ALBUQUERQUE, J.A.; MAFRA, A.L.; BATISTELLA, F.; GRAH, J. 2009. Calagem superficial com resíduo alcalino da indústria de papel e celulose em um solo altamente tamponado. Revista Brasileira de Ciência do Solo, Viçosa, v.3, n.3, p.1657-1665.
MONTANARI, R.; CARVALHO, M.P.; ANDREOTTI, M.; DALCHIAVON, F.C.; LOVERA, L.H.; HONORATO, M.A.O. 2010. Aspectos da produtividade do feijão correlacionados com atributos físicos do solo sob elevado nível tecnológico de manejo. Revista Brasileira de Ciência do Solo, Viçosa, v.34, n.6, p.1811-1822.
MONTANARI, R.; ZAMBIANCO, E.C.; CORRÊA, A.R.; PELLIN, D.M.P.; CARVALHO, M.P.; DALCHIAVON, F.C. 2012. Atributos físicos de um Latossolo Vermelho correlacionados linear e espacialmente com a consorciação de guandu com milheto. Revista Ceres, Lavras, v.59, n.1, p.407-410.
PELISSARI, A.L.; CALDEIRA, S.F.; DRESCHER, R.; SANTOS, V.S. 2012. Modelagem geoestatística da dinâmica espacial da altura dominante de Tectona grandis L.f. (Teca). Enciclopédia
Biosfera, Goiânia, v.8, n.15, p.1249-1260.
PIMENTEL-GOMES, F.; GARCIA, C.H. 2002. Estatística aplicada a experimentos agronômicos e
florestais: Exposição com exemplos e orientações para uso de aplicativos. Piracicaba, Fundação
Escola de Agricultura Luiz de Queiroz. Piracicaba: Fealq, 309p.
ROSA FILHO, G.; CARVALHO, M.P. de; MONTANARI, R.; SILVA, J.M.; SIQUEIRA, G.M.; ZAMBIANCO E.C. 2011. Variabilidade espacial de propriedades dendrométricas do eucalipto e de atributos físicos de um Latossolo Vermelho. Bragantia, Campinas, v.70, n.2, p.439-446.
SHAPIRO, S.S.; WILK, M.B. 1965. An analysis of variance test for normality: complete samples.
Biometrika, Oxford, v.52, n.3, p591-611.
STOLF, R. 1991. Teoria e teste experimental de fórmulas de transformação dos dados de penetrômetro de impacto em resistência do solo. Revista Brasileira de Ciência do Solo, Campinas, v.15, p.229-235.
Received in June 10, 2016 Accepted in June 28, 2017