MAPPING OF ENVIRONMENTAL SENSITIVITY INDEX
TO OIL SPILL FROM LANDSAT TM IMAGES:
“A STUDY CASE ON THE AMAZON COASTAL PLAIN”
Suzan Waleska Pequeno Rodrigues
1and Pedro Walfir M. Souza-Filho
1,2Recebido em 6 dezembro, 2011 / Aceito em 16 agosto, 2012 Received on December 6, 2011 / Accepted on August 16, 2012
ABSTRACT.The environmental sensitivity index (ESI) is represented by a scale ranging from 1 to 10, where the intensity of the impact caused by the oil spill is specified and, the higher the value the higher the sensitivity index. Oil spills impact the environment and are not exclusive to certain regions of the world. Therefore, the production of maps representing the ESI has become important for the implementation of contingency and emergency plans. Curuc¸´a city, located in northeastern Par´a state, does not have a map of semi-detailed environmental sensitivity, for that reason, this study aimed to generate a tactical map, scale of 1:100,000, with recognition of coastal environments identified by digital processing of Landsat images and field surveys. The map will help identify the areas more prone to suffer from a possible oil spill. Thus, eight indices were classified as follows: ESI 1B retaining wall, ESI 1C cliffs, ESI 3A sandy beaches and exposed dunes, ESI 7 sandy tidal flat, ESI 9 ebb tide delta, ESI 10A salt marsh, ESI 10B freshwater marsh and ESI 10 mangrove. Finally, the ESI represented in these maps can support the decision making process to prevent and control accidents that may happen during oil production and transportation. Benefits may reflect on lower costs of cleaning and restoration of the impacted areas in case of oil and other potentially harmful load spills.
Keywords: environmental sensitivity index, remote sensing, coastal environment.
RESUMO.O ´ındice de sensibilidade ambiental (ISA) ´e representado por n´umeros que variam de 1 a 10, especificando a escala de impacto causado pelo ´oleo, quanto maior for o seu valor, maior ´e o ´ındice de sensibilidade. O derramamento de ´oleo j´a n˜ao ´e mais um fato isolado e espor´adico no mundo, causando in´umeros impactos ambientais, portanto, a produc¸˜ao de mapas que representam o ISA tornou-se importante para a implementac¸˜ao de planos de contingˆencia e de emergˆencia. O munic´ıpio de Curuc¸´a, regi˜ao nordeste do estado do Par´a, n˜ao possui um mapa de semi-detalhe, assim, este trabalho teve como objetivo a construc¸˜ao de um mapa t´atico na escala de 1:100.000 e o reconhecimento dos ambientes costeiros atrav´es do processamento de imagens Landsat e do levantamento de campo contribuindo para a identificac¸˜ao das ´areas que mais sofrer˜ao com um eventual derramamento de ´oleo. Deste modo foi poss´ıvel classificar oito ´ındices: ISA 1B muro de arrimo, ISA 1C fal´esias, ISA 3A praias de areia fina e dunas expostas, ISA 7 plan´ıcie de mar´e arenosa, ISA 9 delta de mar´e vazante, ISA 10A pˆantano salino; ISA 10B pˆantano de ´agua doce e ISA 10C manguezal. Assim, os ISA’s s˜ao produtos que representados em mapa podem ajudar na tomada decis˜oes na prevenc¸˜ao e no controle de acidentes durante as atividades de produc¸˜ao e no transporte do ´oleo usado pelas companhias produtoras, tornando-se uma boa estrat´egia de prevenc¸˜ao, a qual pode evitar os altos custos das operac¸˜oes de limpeza e recuperac¸˜ao de ambientes impactados no caso de derramamentos de ´oleo e cargas de risco.
Palavras-chave: ´ındice de sensibilidade ambiental, sensoriamento remoto, ambientes costeiros.
1Universidade Federal do Par´a, Instituto de Geociˆencias, Laborat´orio de An´alise de Imagens do Tr´opico ´Umido – LAIT, Av. Augusto Correa, 1, Campus do Guam´a, P.O. Box 8608, 66075-110 Bel´em, PA, Brazil. Phone: +55(91) 3201-8009; Fax: +55(91) 3183-1478 – E-mails: [email protected], [email protected]
INTRODUCTION
In the mid-70s the US started to develop contingency plans that included the recognition and mapping of the areas sensitive to oil spills, based solely on their geomorphological characteris-tics (Hayes & Gundlach, 1975). The authors Gundlach & Hayes (1978) associated the biological with the geomorphological char-acteristics and created the first sensitivity index to oil spills. From then on, sensitivity maps have evolved and were adopted in sev-eral countries, among them, Australia (Thompson & McEnally, 1985), Svalbart Island (Moe et al., 2000) and Brazil (Wieczorek et al., 2007; Souza Filho et al., 2009a).
In March 2002, the standards and specifications for the Envi-ronmental Sensitivity Index (MMA, 2004) were referenced by the Cartography National Commission (Comiss˜ao Nacional de Car-tografia, COMCAR), so that the Charts of Environmental Sensi-tivity to Oil Spills (Cartas SAO) are now considered cartographic documents by the Brazilian government. They are essential to de-velop contingency plans to manage spills of oil and its derivatives, contributing to the localization and mapping of high risk areas.
The environmental sensitivity index (ESI) also known as coastal sensitivity index (CSI) ranges from 1 to 10, representing the scale of the impact caused by the oil (NOAA, 2002; MMA, 2004). The ESI grading system is characterized by the following factors: type of substrate; relative exposure to waves and tidal en-ergy; biological productivity and sensitivity; slope of the coast, and easiness of cleaning (Halls et al., 1997). In recent years, Petrobras (2002) and Souza Filho et al. (2009b) made adjust-ments to the ESI charts of the Amazonian coastal areas.
In Brazil, the environmental sensitivity index has been used to support the measures taken to prevent and contain eventual oil spills on the coast. An important tool that helps to produce the ESI charts is remote sensing which, through satellite data pro-cessing makes the research fast, accessible and effective.
Works on this subject have already been published for the Southern (Santos & Griep, 2007; Bellotto & Sarolli, 2008; Noern-berg et al., 2008), Southeastern (Carmona et al., 2006; Gherardi et al., 2008) and Northeastern (Castro et al., 2003; Alcˆantara & Santos, 2005; Carvalho & Gherardi, 2008) regions. Despite having no oil platform installed in the northern region, the risk of accidents is due to the transportation of oil and its deriva-tives along the coast and Rivers Amazonas, Solimoes and its tributaries. Thus, studies about the ESI have been published for this region, among them we highlight Almeida (2009); Gonc¸alves et al. (2009); Boulhosa & Souza Filho (2009); Rodrigues & Souza Filho (2011).
Landsat TM images of the studied area are going to be used to produce a chart of the sensitivity environmental index to oil spills in a Marine Extractive Reserve, located in the city of Curuc¸´a, in order to support preventive measures against a possible oil spill in the area. Thus, the coastal environments are mapped based on the classification and interpretation of the images from the Landsat-5 Thematic Mapper – TM and field work to produce an ESI chart adapted to the Amazon coastal area (Souza Filho et al., 2009b) in tactical scale (1:100,000).
STUDY SITE
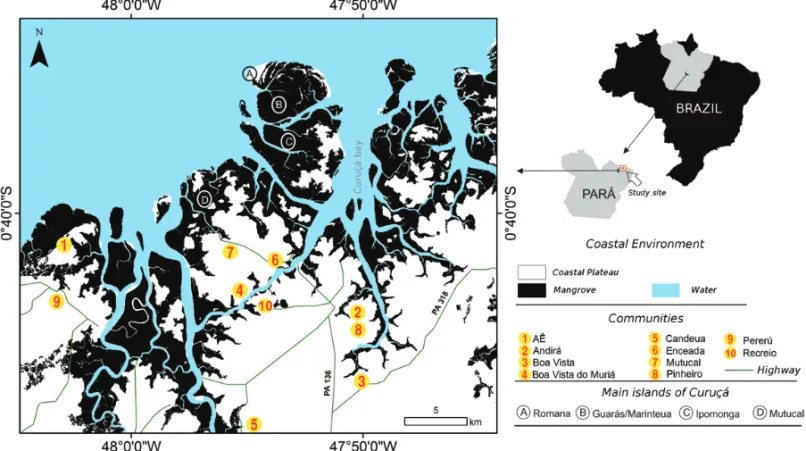
The study site is part of the M˜ae Grande de Curuc¸´a Extractive Re-serve that covers an area of 37,062 hectares on the northeast-ern coast of Par´a state (Fig. 1). This area is dominated by semi-diurnal macro-tides, with 4 m maximum height. The waves hit this area with approximate average height of 2 m, while the NE trade winds reach average speed of 6.6 m/s (CPTEC/INPE, 2005). The climate is rainy tropical (humid), with well-defined dry and rainy seasons and annual rainfall of about 3,000 mm. Accord-ing to El Robrini & M´acola (2004) the islands are held by sedi-ments from the Grupo Barreiras formation. Geomorphologically, the area is compartmentalized into: (1) Coastal Plateau/Plain – dominated by features of hilly relief of irregular shapes with small amplitudes, occurs especially on the Island of Mutucal (mostly on the flooded northern edge), Island of Ipomonga (exclusively on the southeast) and Island of Guar´as/Marinteua and Romana (where it is buried); and (2)Fluviomarine Plain– consists of rel-atively flat terrain, discontinuous on the shoreline. This regional geomorphological unit is compartmentalized into three sub-units or environments: (i) flood plain; (ii) estuarine plain with canal, subdivided into upper course straight segment, meandering seg-ment and estuarine funnel, and (iii) coastal plain, environseg-ments of supra-tidal plain, tidal flat (supra-tidal, inter-tidal and sub-tidal mangroves, sandy plain, barrier-beach ridge, active and inactive coastal dunes, emerged bars, with low tide).
MATERIALS AND METHODS Materials
The characteristics of Landsat-5 Thematic Mapper – TM images used in this study are shown in Table 1. The images were acquired from the catalog of the National Institute for Space Research (Instituto Nacional de Pesquisas Espaciais, INPE – http://www.dgi.inpe.br/CDSR/). The Landsat-7 Enhanced The-matic Mapper plus – ETM+ image was acquired from the site GeoCover (http://glcfapp.umiacs.umd.edu:8080/esdi/index.jsp),
Figure 1 – Map showing the location and boundaries of the mangrove and the main islands along the study site. Table 1 – General characteristics of the images used.
Platform Sensor Acquisitiondate Incidenceangle resolution (m)Spatial Tide Landsat-5 TM 09/07/2008 Nadir 30 high Landsat-7 ETM+ 05/08/2001 Nadir 30-mult./15-Pan high
SRTM v4 InSAR Set. 2008 Off-nadir 90 –
and the Digital Elevation Model (DEM) of the Shuttle Radar To-pography Mission (SRTM) was acquired from the Consortium for Spatial Information (CGIAR-CSI – http://srtm.csi.cgiar.org/). Digital data processing
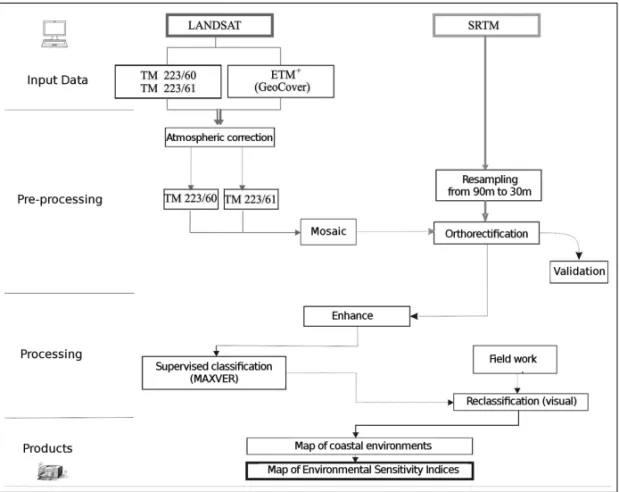
The flowchart in Figure 2 shows the procedure followed to pre-process and pre-process the images from the Landsat-5 TM. Initially, atmospheric correction was performed in the visible and infrared bands by subtracting dark pixels following the methodology pro-posed by Chavez Jr. (1996). Subsequently, the images were en-hanced by the linear transformation of the Look up table (LUT) of the Algorithm Librarian in the software PCI Geomatics 10.3 (PCI, 2010).
The mosaic images, together with the DEM of the SRTM, were orthorectified based on the Lansat-7 ETM+images, using the OrthoEngine tool. Orthorectification was based on the data
point collection from the Landsat-7 ETM+images. The resampling method used was the nearest neighbor, where 30 control points with root mean square (RMS) of 0.06 pixels were collected.
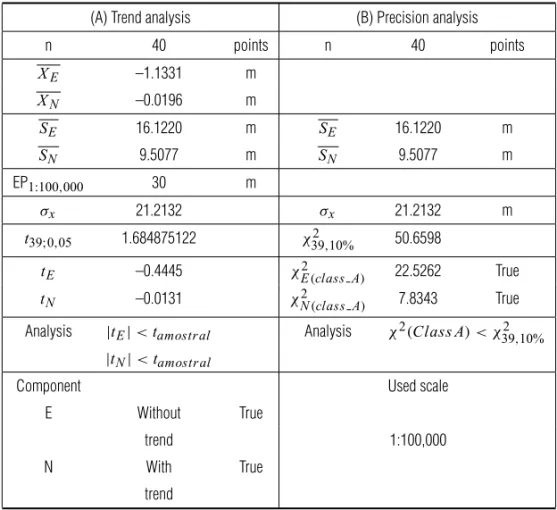
Orthorectification was validated by the Cartographic Accu-racy Standards (CAS) and Standard Error (SE) which classify the generated map (Table 2) according to trend and precision analy-sis. Means were analyzed using t-test and Chi-square test (χ2) to verify, respectively, if mean of the discrepancies is zero and if sampling variance from the standard error is the same, indicat-ing precision. The equations used to calculate positional accu-racy according to Camargo et al. (2007) are shown in Table 3. Planialtimetric validation was calculated using 10 ground con-trol points with RMS of 0.40 pixels for the orthorectified images. Check points were collected in the field using the GPS Garmin 72 with WAAS Receptor (5m precision). Accuracy analysis was performed for a scale of 1:100,000, for t39;0,05 and χ39,10%2 , for a total of 40 samples.
Figure 2 – Flowchart of the methodology used to process the Landsat and SRTM images. Table 2 – Standard planimetric accuracy and error of
the classes A, B and C.
Class PEC (m) EP (m) σx(m) A 0.5 0.3 21.213 B 0.8 0.5 35.355 C 1.0 0.6 42.426
Table 3 – Formulas to analyze PEC (Camargo et al., 2007).
The hypothesis test <<t >> allows checking
if the average discrepancy is zero. The following hypotheses are evaluated
H0: 1X = 0
H1: 1X 6= 0
Confidence interval is calculated by: |tx| < t(n−1,α/2)
Hypotheses evaluated by the chi-square test H0: S
2 1X=σ2X
H1: S12X>σ2X
Statistics calculated from the sample variance X2x = (n − 1)S12X σ12X
Certify whether the calculated value is within the null hypothesis acceptance interval X
2x ≤ X2 (n−1,α)
Obs.: If the value is not within the interval, the null hypothesis is rejected, that is, the chart does not meet the established accuracy
After image orthorectification, supervised classification was performed using the MAXVER algorithm, taking as reference the map produced by Rodrigues & Souza Filho (2011). Thus, it was possible to recognize nine classes representing the follow-ing environments: coastal plateau, mangrove, salt and freshwater marsh, dunes, sandy tidal flat, macro-tidal beach, water with and without suspended sediment, due to similar spectral correspon-dence in several classified environments.
For accurate classification, the kappa index (Cohen, 1960) was calculated. Field surveys were carried out based on a chart generated by previous interpretation of the images. This step was accomplished with ground-truth control point collection using GPS, tracking and field reconnaissance of morphological units.
From the field validation, we identified five new classes as follows: lakes, sandy bars, ebb tide delta, floodplain and
paleo-dunes. Therefore, a total of 13 classes were recognized on the field and classified in the satellite images.
After reconnaissance of the environments, these were grouped according to what was proposed by Souza Filho et al. (2009b) for mapping the environmental sensitivity index to oil spills in coastal Amazon region.
RESULTS AND DISCUSSION
Reconnaissance of coastal environments along the estuary of Rio Curuc¸´a
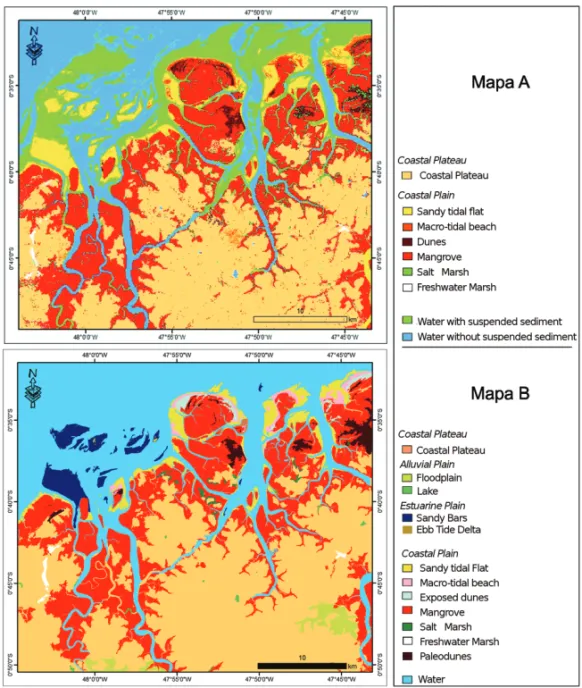
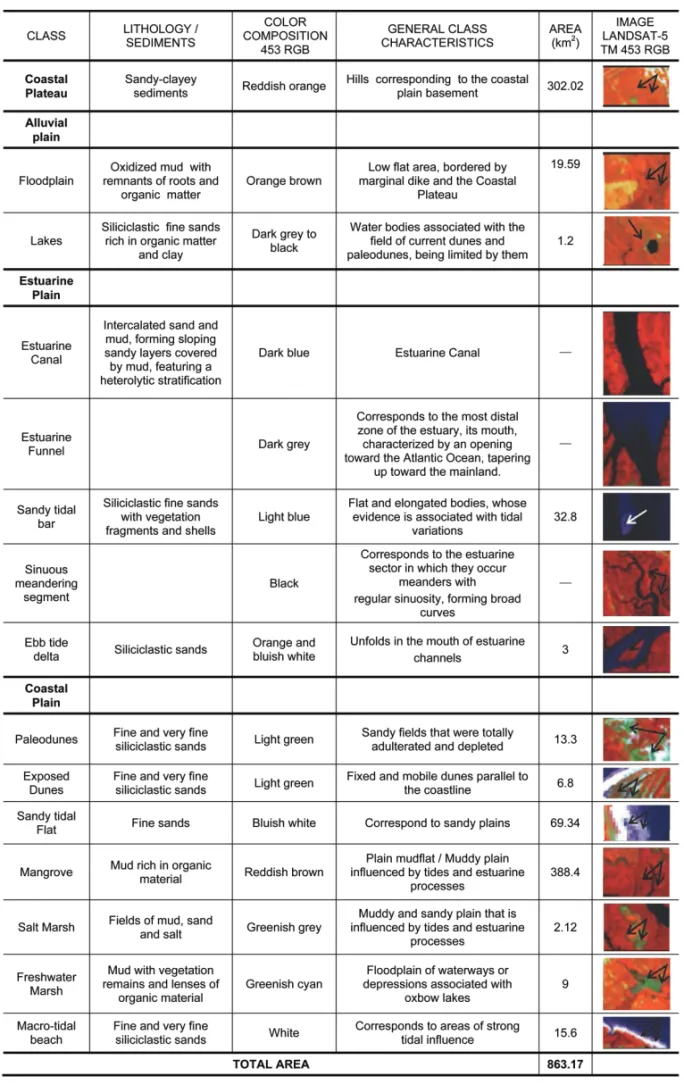
Thirteen classes were recognized (Fig. 3B and Table 4) as follows: coastal plateau (A), floodplain (B), lakes (C), sandy bars (D), ebb tide delta (E), sandy tidal flat (F), macro-tidal beach (G), exposed dunes (H), mangrove (I), salty marsh (J), freshwater marsh (K), paleodunes (L); and last, the two classes water with and without
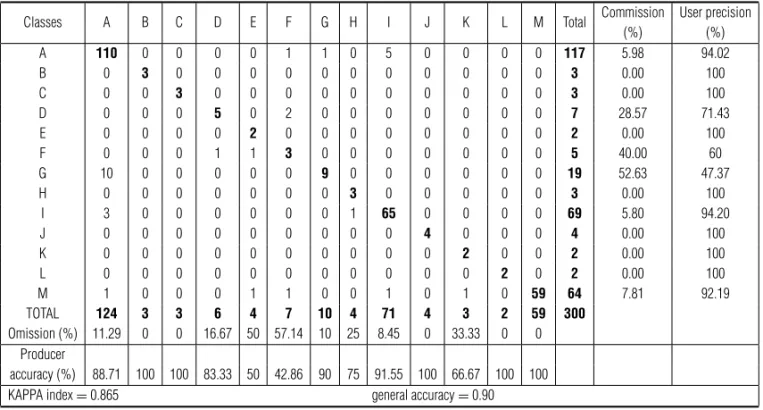
Table 4 – Confusion Matrix and kappa index of the classes generated.
Classes A B C D E F G H I J K L M Total Commission User precision(%) (%)
A 110 0 0 0 0 1 1 0 5 0 0 0 0 117 5.98 94.02 B 0 3 0 0 0 0 0 0 0 0 0 0 0 3 0.00 100 C 0 0 3 0 0 0 0 0 0 0 0 0 0 3 0.00 100 D 0 0 0 5 0 2 0 0 0 0 0 0 0 7 28.57 71.43 E 0 0 0 0 2 0 0 0 0 0 0 0 0 2 0.00 100 F 0 0 0 1 1 3 0 0 0 0 0 0 0 5 40.00 60 G 10 0 0 0 0 0 9 0 0 0 0 0 0 19 52.63 47.37 H 0 0 0 0 0 0 0 3 0 0 0 0 0 3 0.00 100 I 3 0 0 0 0 0 0 1 65 0 0 0 0 69 5.80 94.20 J 0 0 0 0 0 0 0 0 0 4 0 0 0 4 0.00 100 K 0 0 0 0 0 0 0 0 0 0 2 0 0 2 0.00 100 L 0 0 0 0 0 0 0 0 0 0 0 2 0 2 0.00 100 M 1 0 0 0 1 1 0 0 1 0 1 0 59 64 7.81 92.19 TOTAL 124 3 3 6 4 7 10 4 71 4 3 2 59 300 Omission (%) 11.29 0 0 16.67 50 57.14 10 25 8.45 0 33.33 0 0 Producer accuracy (%) 88.71 100 100 83.33 50 42.86 90 75 91.55 100 66.67 100 100
KAPPA index = 0.865 general accuracy = 0.90
A = coastal plateau; B = floodplain; C = lake; D = sandy bars; E = ebb tide delta; F = sandy tide flat; G = macro-tide beach; H = exposed dunes; I = mangrove; J = salt marsh; K = freshwater marsh; L = Paleodunes; M = water.
suspended sediment were grouped into a single water class (M). The Kappa index of 0.86 obtained corresponds to a “very good accuracy” according to the evaluation of Cohen (1960). The over-all accuracy rate obtained from the 300 sampling points collected was 90%.
After the equivalent area of each class was determined, the total area was calculated as 1300.8 km2. The areas of the two classes, coastal plateau and floodplain, corresponding to 58.4% of the studied area, were subtracted from the total area; therefore, the work was restricted to the classes that are susceptible to oil spills and make up for 41.6% (541.6 km2) of the studied area. Based on this information, we highlight the mangrove (388.4 km2) representing 72% of the area of the ESI map, in order to call atten-tion to the sensitivity of an area subjected to a possible oil spill.
Of the other classes, corresponding to 28%, the sandy tidal flat 13% (69.34 km2) and sandy bars 6% (32.8 km2) areas stand out, followed by classes with smaller areas, such as: macro-tidal beaches 2.8% (15.6 km2), paleodunes (13.3 km2) and freshwater marsh (9 km2) with 2% each, exposed dunes 1% (6.8 km2), ebb tide delta 0.6% (3 km2), salt marsh 0.4% (2.12 km2) and lakes 0.2% (1.2 km2).
Regarding environment classification accuracy, the areas floodplain (B), lake (C), ebb tide delta (E), salt (J) and freshwater marsh (K) displayed commission and omission errors equal to
zero, that is, nothing has been commissioned and/or classified as another class, with the exception of class (E), where 50% of the samples were classified as other classes (sandy tidal flat – F and water – M) due to spectral similarity. The mangrove (I) and coastal plateau (A) classes that yielded low commission (5.80 and 5.98%) and omission (8.45 and 11.29%, respectively) errors also obtained good ratings, as opposed to the macro-tidal class (G) that commissioned approximately 53% of its samples to other classes, due to spectral similarity of some collected pixels.
Table 5 shows the classes and the distribution of sampled pixels in the image, identifying how many pixels were commis-sioned and/or omitted to other classes and how many pixels were correctly classified.
Production of the Environmental Sensitivity Index (ESI) map for Curuc¸´a
The statistics results based on “t” and χ2tests validated the post-orthorectification planimetric validation (Table 6) to determine the map scale of 1:100,000 class A, according to the values estab-lished by the Cartographic Accuracy Standards (CAS) at a confi-dence level of 90%. This result places the ESI map produced in the category of tactical maps, with scale varying from 1:150,000 to 1:50,000 according to the MMA.
Table 6 – Trend and precision analysis for the 1:100,000 scale of the Curuc¸´a map.
(A) Trend analysis (B) Precision analysis
n 40 points n 40 points XE –1.1331 m XN –0.0196 m SE 16.1220 m SE 16.1220 m SN 9.5077 m SN 9.5077 m EP1:100,000 30 m σx 21.2132 σx 21.2132 m t39;0,05 1.684875122 χ39,10%2 50.6598 tE –0.4445 χE(class A)2 22.5262 True tN –0.0131 χ2N(class A) 7.8343 True Analysis |tE| < tamostral Analysis χ2(Class A) < χ39,10%2
|tN| < tamostral
Component Used scale
E Without True
trend 1:100,000
N With True
trend
Legend:n: collected points (samples); 1X: represents mean discrepancy; S1X: sample standard deviation;
|tx| < t(amostral): confidence interval; σx: standard deviation (EP); χ2x ≤ χ2(n − 1α): acceptance
interval and confidence level.
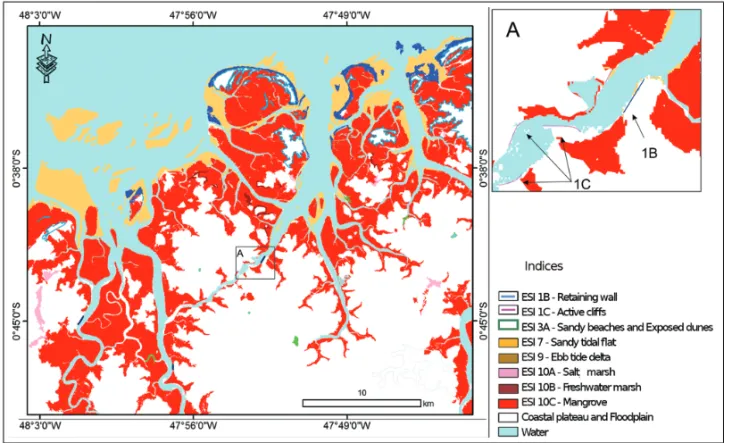
Eight environmental sensitivity indices were recognized and mapped in the studied area (Table 7), as presented in Figure 4. The photographs relevant to each index can be seen in Figure 5.
Table 7 – ESI mapped in the study site and the respective coastal environments.
Environmental
Units sensitivity index
ISA 1B Retaining wall ISA 1C Active cliffs
ISA 3A Sandy beaches and exposed dunes ISA 7 Sandy tidal flat ISA 9 Ebb tide delta ISA 10A Salt marsh ISA 10B Freshwater marsh ISA 10C Mangrove
From the determined indices, the ISA-10C, 10B and 10A are highlighted. The ISA-10C represents 72% of the generated map
and covers the entire coast of the city of Curuc¸´a, especially the Romana islands. In this area, studies have been conducted to evaluate the possibility of leasing an off-shore port for primarily transportation of iron ore.
CONCLUSIONS
The satellite data processing provided good results/data to be used for the generation of the environmental sensitivity index (ESI) map. This map should be used to support contingency plans in order to reduce the possible impact caused by oil spills and its derivatives in the studied area.
The evaluation according to the Cartographic Accuracy Stan-dard classified the produced map as class A, in scale 1:100,000. This meets the guidelines of the Ministry of Environment for the production of Charts of environmental sensitivity index to oil spills (ESI Chart). Thus, it is possible to generate more accurate ESI charts faster and at lower cost.
Therefore, the use of moderate resolution optical sensors allow to analyze the integrated spatial relationships, enabling
re-Figure 4 – Map of environmental sensitivity index to oil spills in Curuc¸´a, zoom in the dotted area highlights the ISA’s 1B and 1C.
connaissance of the environments and its mapping for various purposes, in addition to supplying high quality cartographic prod-ucts. A fact that, along with management and prevention plans contributes to the reduction of the impact caused by possible spills of oil and its derivatives.
ACKNOWLEDGMENTS
The authors thank the Conselho Nacional de Desenvolvimento Cient´ıfico e Tecnol´ogico (CNPq) for the research grants during this study and CAPES for granting financial aid according to Edi-tal Ciˆencias do Mar.
REFERENCES
ALCˆANTARA EH & SANTOS MCFV. 2005. Mapeamento de ´Areas de Sen-sibilidade Ambiental ao Derrame de ´Oleo na Regi˜ao Portu´aria do Itaqu´ı, S˜ao Lu´ıs, MA-Brasil. Anais XII Simp´osio Brasileiro de Sensoriamento Remoto, Goiˆania, Brasil, 16-21 abril 2005, INPE, p. 3605–3617. ALMEIDA EF. 2009. Uso de Dados Multisensor para gerac¸˜ao de Car-tas de Sensibilidade Ambiental a Derramamentos de ´Oleo, nos Ecossis-temas Costeiros da Regi˜ao do Cabo Norte, Amap´a. Anais XIV Simp´osio Brasileiro de Sensoriamento Remoto, Natal, Brasil, 25-30 abril 2009, INPE, p. 4543–4551.
BELLOTTO VR & SAROLLI VMM. 2008. Environmental sensitivity map-ping to oil spill and response actions for shoreline and portuary zone of Imbituba, SC, Brazil. Braz. J. Aquat. Sci. Technol., 12(2): 115–125. ISSN 1808-7035.
BOULHOSA MBM & SOUZA FILHO PWM. 2009. Reconhecimento e mapeamento dos ambientes costeiros para gerac¸˜ao de mapas de ISA ao derramamento de ´oleo, Amazˆonia Oriental. Revista Brasileira de Geof´ısica, 27(Supl. 1): 23–37.
CAMARGO FF, OLIVEIRA CG de, FLORENZANO TG & ALMEIDA CM de. 2007. Avaliac¸˜ao da acur´acia posicional da base cartogr´afica do munic´ıpio de S˜ao Jos´e dos Campos (SP) por an´alises de tendˆencia e precis˜ao. In: XXIII Congresso Brasileiro de Cartografia – I Congresso Brasileiro de Geoprocessamento, 2007, Rio de Janeiro/RJ. Anais... Rio de Janeiro/RJ: SBC, 2007. Artigos, p. 775–780.
CARMONA SL, GHERARDI DFM & TESSLER MG. 2006. Environmen-tal sensitivity mapping and vulnerability modeling for oil spill response along the S˜ao Paulo coastline. Journal of Coastal Research, SI39: 1455– 1458.
CARVALHO M & GHERARDI DFM. 2008. Mapping the environmental sensitivity to oil spill and land use/land cover using, spectrally trans-formed Landsat-7 ETM data. Braz. J. Aquat. Sci. Technol., 12(2): 1–9. ISSN 1808-7035.
CASTRO AF, AMARO VE & VITAL H. 2003. Desenvolvimento de um banco de dados geogr´aficos em um ambiente SIG e sua aplicac¸˜ao na
elaborac¸˜ao de mapas de sensibilidade ambiental ao derramamento de ´oleo em ´areas costeiras do estado do Rio Grande do Norte. Anais XI SBSR, Belo Horizonte, Brasil, 05-10 abril 2003, INPE, p. 1533–1540. CHAVEZ P Jr. 1996. Image-based atmospheric corrections-revisited and improved. Photogrammetric Engineering and Remote Sensing, 62: 1025–1036.
COHEN J. 1960. A coefficient of agreement for nominal scales. Educ. Psych. Meas, 20: 37–46.
CPTEC/INPE. Centro de Previs˜ao de Tempo e Estudos Clim´aticos. 2005. Dados previsionais. Portal oceˆanico. Available on:
<http://tucupi.cptec.Inpe.br/wam>. Access on: Jan. 5, 2006. EL ROBRINI M & M´ACOLA G. 2004. “Ilha dos guar´as (Marinteua) – munic´ıpio de Curuc¸´a (NE do Par´a): aspectos f´ısicos, meteorol´ogicos e oceanogr´aficos”. Relat´orio Final, Companhia docas do Par´a. Available on:<http://www.cdp.com.br/images/espadarte/espadarte estudo figuras.pdf>. Access on: March 6, 2009.
GHERARDI DFM, CABRAL AP, KLEIN AHF, MUEHE DCEH, NOERNBERG MA, TESSLER MG & SARTOR SM. 2008. Mapeamento da sensibili-dade ambiental ao ´oleo da bacia mar´ıtima de Santos. Brazilian Journal of Aquatic Science Technology, 12(2): 11–31.
GONC¸ALVES FD, SOUZA FILHO PWM, PARADELLA WR & MIRANDA FP. 2009. Fus˜ao de dados multisensor para a identificac¸˜ao e o mapea-mento de ambientes fl´uvio-estuarinos da Amazˆonia. Revista Brasileira de Geof´ısica, 27(Supl.1): 57–67.
GUNDLACH ER & HAYES MO. 1978. Vulnerability of coastal environ-ments to oil spill impacts. Journal of Marine Technology Society, 12(4): 18–27.
HALLS J, MICHEL J, ZENGEL S & PETERSEN J. 1997. Environmental sensitivity index guidelines. Version 2.0, Seattle: Hazardous Materials Response and Assessment Division, National Oceanic and Atmospheric Administration, 79 p. (NOAA Technical Memorandum NOS ORCA 115). HAYES MO & GUNDLACH ER. 1975. Coastal geomorphology and sedi-mentation of the Metula oil spill site in the Straits of Magellan. Report to Advanced Environmental Research Technology, NSF. 103 p.
MINIST´ERIO DO MEIO AMBIENTE – MMA. 2004. Especificac¸˜oes e nor-mas t´ecnicas para elaborac¸˜ao de cartas de sensibilidade ambiental para derramamento de ´oleo – Cartas SAO, SQAAH, MMA, Bras´ılia, 107 p. MOE KA, SKEIE GM, BRUDE OW, LOYAS SM, NEDREBO M & WES-LAWISKI JM. 2000. The Svalbard intertidal zone: a concept for the use of GIS in applied oil sensitivity, vulnerability and impact analyses. Spill Science & Technology Bulletin, 6: 187–206.
NOERNBERG MA, ANGELOTTI R, CALDEIRA GA & RIBEIRO DE SOUSA AF. 2008. Environmental sensitivity assessment of Paran´a coast for oil spill. Braz. J. Aquat. Sci. Technol., 12(2): 49–59. ISSN 1808-7035.
NOAA. National Oceanic and Atmospheric Administration. PETERSEN J, MICHEL J, ZENGEL S, WHITE M, LORD C & PLANK C. 2002. Environ-mental sensitivity index guidelines, Version 3.0. Seattle. NOAA Technical Memorandum NOS OR&A 11, 89 p.
PCI Geomatics Enterprises Inc. 2010. EASI/PACE user’s manual, version 10.3. PCI Geomatics Enterprises Inc., Richmond Hill, Ont. 165 p. PETROBRAS – Petr´oleo Brasileiro S.A. 2002. Manual B´asico para Ela-borac¸˜ao de Mapas de Sensibilidade Ambiental a Derrames de ´Oleo no Sistema Petrobras: Ambientes Costeiros e Estuarinos. Rio de Janeiro, 134 p.
RODRIGUES SW P & SOUZA-FILHO PWM. 2011. ´Indice de sensibilidade ambiental (ISA) a partir do processamento de imagens Landsat TM para o nordeste do Par´a (Curuc¸´a – PA, Brasil). Anais XV Simp´osio Brasileiro de Sensoriamento Remoto – SBSR, Curitiba, PR, Brasil, INPE, p. 5070. SANTOS DPD & GRIEP G. 2007. Mapa de sensibilidade ambiental para derrames de ´oleo na porc¸˜ao sul de Santa Catarina: uma aplicac¸˜ao para o manejo e conservac¸˜ao de aves e peixes. 4◦IV PDPETRO, Campinas,
SP. v. 6.2. p. 0177-1.
SOUZA FILHO PWM, GONC¸ALVES FD, RODRIGUES SWP, COSTA FR & MIRANDA FP. 2009a. Multi-sensor data fusion for geomorphologi-cal and environmental.sensitivity index mapping in the Amazonian man-grove coast, Brazil. Journal of Coastal Research, 56: 1592–1596. SOUZA FILHO PWM, PROST MTRDC, MIRANDA FP, SALES MEC, BORGES HV, COSTA FR, ALMEIDA EF & NASCIMENTO JUNIOR WR. 2009b. Environmental sensitivity index (ESI) Mapping of oil spill in the amazon coastal zone: the PIATAM Mar project. Revista Brasileira de Geof´ısica, 27(Supl.1): 7–22.
THOMPSON GB & McENALLY JM. 1985. Coastal Resource Atlas for Oil Spills in Port Jackson. Australian State Pollution Control Commission. Sydney, 27 p.
WIECZOREK A & DIAS-BRITO D, MILANELLI JC. 2007. Mapping oil spill environmental sensitivity in Cardoso Island State Park and surroundings areas, S˜ao Paulo, Brazil. Ocean & Coastal Management, 50(11): 872– 886.
NOTES ABOUT THE AUTHORS
Suzan Waleska Pequeno Rodrigues. Graduated in Geology from the Universidade Federal do Par´a (2006), specialized in Geotechnology: Remote Sensing and Geoprocessing from the Instituto de Estudos Superiores da Amazˆonia (2011) and received a master’s degree in Geology from the Universidade Federal do Par´a (2008). Currently, is a doctoral student in Geology, subarea Marine Geology from UFPA.
Pedro Walfir Martins e Souza Filho. Graduated in Geology from the Universidade Federal do Par´a (1993), specialized in Geology and Marine Geology from the Universidade Federal Fluminense (1993), and received master’s and doctoral degree in Geology in the area of Remote Sensing of the Universidade Federal do Par´a (2000). Currently, holds the position of Associate Professor in the Faculdade de Oceanografia of the Instituto de Geociˆencias da Universidade Federal do Par´a since 2002 and Associate Researcher at the Instituto Tecnol´ogico Vale – Sustainable Development. Has a Productivity Research Grant from CNPq since 2003 and Affiliate Member of the Academia Brasileira de Ciˆencias since 2008.