Braz. J. of Develop.,Curitiba, v. 6, n. 8, p.63606-63617 aug. 2020. ISSN 2525-8761
Development and validation of high-performance liquid chromatography
method for determination of atorvastatin in polymeric nanocapsules
Desenvolvimento e validação de método de cromatografia líquida de alta
eficiência para determinação de atorvastatina em nanocápsulas poliméricas
DOI:10.34117/bjdv6n8-697
Recebimento dos originais:08/07/2020 Aceitação para publicação:31/08/2020
Gabriel Pedroso Viçozzi
Mestrado – Programa de Pós Graduação em Ciências Farmacêuticas – PPGCF/UNIPAMPA Instituição de atuação atual: Universidade Federal do Pampa
Endereço completo: BR 472 KM 585 - CEP: 97501-970 – Uruguaiana/RS E-mail: [email protected]
Luiz Torres Neto
Mestrado – Programa de Pós Graduação em Ciências Farmacêuticas – PPGCF/UNIPAMPA Instituição de atuação atual: Universidade Federal do Pampa
Endereço completo: BR 472 KM 585 - CEP: 97501-970 – Uruguaiana/RS E-mail: [email protected]
Pedro Santos da Silva
Graduando – Curso de Farmácia/UNIPAMPA
Instituição de atuação atual: Universidade Federal do Pampa Endereço completo: BR 472 KM 585 - CEP: 97501-970 – Uruguaiana/RS
E-mail: [email protected]
Luiza Rodrigues Nenê
Graduanda – Curso de Farmácia/UNIPAMPA
Instituição de atuação atual: Universidade Federal do Pampa Endereço completo: BR 472 KM 585 - CEP: 97501-970 – Uruguaiana/RS
E-mail: [email protected]
Letícia Marques Colomé
Doutorado
Instituição de atuação atual: Curso de Farmácia e Programa de Pós Graduação em Ciências Farmacêuticas da Universidade Federal do Pampa – PPGCF/UNIPAMPA
Endereço completo: BR 472 KM 585 - CEP: 97501-970 – Uruguaiana/RS E-mail: [email protected]
Eduardo André Bender
Doutorado
Instituição de atuação atual: Curso de Farmácia e Programa de Pós Graduação em Ciências Farmacêuticas da Universidade Federal do Pampa – PPGCF/UNIPAMPA
Endereço completo: BR 472 KM 585 - CEP: 97501-970 – Uruguaiana/RS E-mail: [email protected]
Braz. J. of Develop.,Curitiba, v. 6, n. 8, p.63606-63617 aug. 2020. ISSN 2525-8761
ABSTRACT
This study aimed to develop and validate a HPLC based analytical methodology for determination of atorvastatin within nanocapsules containing ginger or grape seed essential oils (NCAtG and NCAtU, respectively). Chromatographic separation was achieved by employing a Venusil XBR C18 column as stationary phase and a ternary mixture of acetonitrile, 0.1% phosphoric acid, and methanol (60:30:10) as the mobile phase. The validated method proved to be linear for atorvastatin in the range of both particles were 10 to 50 μg.mL−1. Detection and quantification limits for atorvastatin were, respectively, 30 ng.mL−1 and 300 ng.mL−1 for NCAtG, while for NCAtU the values were 39 ng.mL−1 and 390 ng.mL−1, what assures the methodology sensitivity. The method was also precise (1.28% RSD for NCAtG and NCAtU), besides showing recovery rates close to 100% for both nanocapsules formulations when accuracy was accessed. Minor alterations over chromatographic (pH, mobile phase, flow and detector) setup have confirmed methodology robustness. The present methodology was able to detect and quantify atorvastatin in nanocapsules containing ginger or grape seed essential oils. Thus, proving to be an analytical alternative for the quality control of this dosage form.
Keywords: HPLC method validation,atorvastatin, nanocapsules, essential oils. RESUMO
O objetivo deste estudo foi desenvolver e validar uma metodologia analítica baseada em HPLC para determinação de atorvastatina em nanocápsulas contendo óleos essenciais de semente de uva ou gengibre (NCAtG e NCAtU, respectivamente). A separação cromatográfica foi obtida empregando-se uma coluna Venusil XBR C18 como faempregando-se estacionária e uma mistura ternária de acetonitrila, 0,1% de ácido fosfórico e metanol (60:30:10) como fase móvel. O método validado mostrou-se linear para atorvastatina na faixa de partículas de 10 a 50 μg.mL-1. Os limites de detecção e quantificação para atorvastatina foram, respectivamente, 30 ng.mL−1 e 300 ng.mL−1 para NCAtG, enquanto para NCAtU os valores foram 39 ng.mL−1 e 390 ng.mL−1, o que garante a metodologia sensibilidade.O método também foi preciso (1,28% RSD para NCAtG e NCAtU), além de apresentar taxas de recuperação próximas de 100% para ambas as formulações de nanocápsulas quando a precisão foi determinada. Pequenas alterações na configuração cromatográfica (pH, fase móvel, fluxo e detector) confirmaram a robustez da metodologia. A presente metodologia foi capaz de detectar e quantificar atorvastatina em nanocápsulas contendo óleos essenciais de gengibre ou semente de uva.Desta forma, mostrou-se uma alternativa analítica para o controle de qualidade desta forma farmacêutica.
Palavras-chave: Validação de método HPLC, atorvastatina,nanocápsulas, óleos essenciais.
1 INTRODUCTION
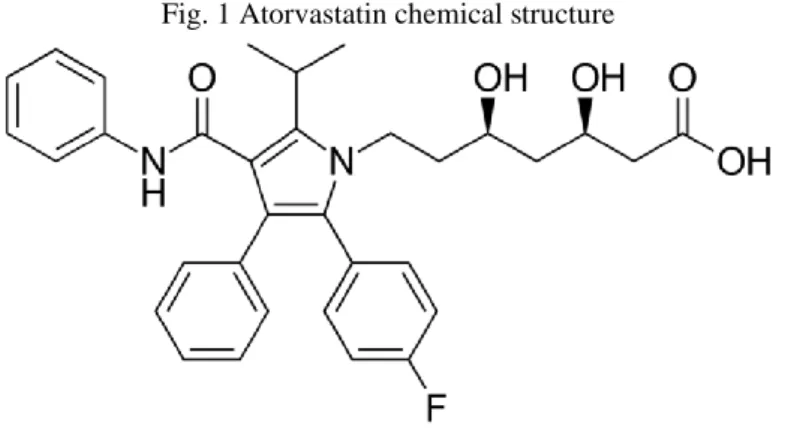
Atorvastatin 3R,5R)-7-[2-(4-fluorophenyl)-3-phenyl-4-(phenylcarbamoyl)-5-propan-2-ylpyrrol-1-yl]-3,5-dihydroxyheptanoic acid) (ATV) (Fig.1) is a very utilized drug in the treatments of dyslipidemia and others cholesterol disorders (Ferreira and Marques da Silva 2016). ATV was launch in the 90’s was a huge commercial success due it new and promising action mechanism for the time. The ATV act by the inhibition of the HMG-CoA reductase enzyme
(3-hidroxi-3-Braz. J. of Develop.,Curitiba, v. 6, n. 8, p.63606-63617 aug. 2020. ISSN 2525-8761
metilglutaril-CoA reductase) in convert the subtract HMG-CoA in mevalonic acid, lowing the hepatic cholesterol production (Arrigoni, Del Re et al. 2017).
Fig. 1 Atorvastatin chemical structure
The ATV demonstrastes a high efficacy and its acceptance by the general public is tolerable (Gomez-Gerique, et al. 2003). However it may cause some side effects as: myalgia, gastrointestinal disorders and in long terms diabetes risk (Joy and Hegele 2009). Beyond that, the plasmatic distribuition of ATV shows some physicochemicals problems such as: low solubility in water and low bioavailability. This fact may lead to less pharmacological effectiveness (J B, et al 2017).
Dyslipidemia and atherosclerosis are chronic pathologies and in many cases are identified too late or when some clinical symptom appears and affect the pacient life (Siqueira et al., 2020; Zidiotti et al., 2020). The use of ATV, when indicated, will be to be use in long periods of the patient life (Peng et al 2018). Thus, the development of carrier systems in order to improving the therapeutic effect of drugs administered, such as ATV, is an interesting alternative. Among these systems, it is possible highlights the polymeric nanoparticles (NPs). NPs are vesicular or matricial colloids based on polymers. These vesicular carriers constituted of an oil core surrounded by a polymeric wall are named nanocapsules (Colomé et al, 2017; Bernardi et al., 2011)
The optimization of ATV in NPs, more specifically in nanocapsules (NC), have for objective formulate new therapeutics systems in the combat of deseases related to cholesterol. For this pourpose, establish a new analitic method capable of quantified the ATV in NC is indispensable. Some analytical methods already exist in the literature for quantification of statins (Patel, Macwana
et al. 2012; J.B. et al 2017), however, none of then about extraction and quantification of ATV in
Braz. J. of Develop.,Curitiba, v. 6, n. 8, p.63606-63617 aug. 2020. ISSN 2525-8761
2 MATERIALS AND METHODS
2.1 REAGENTS
Atorvastatin (98.97% purity) was purchased from Galena (Brazil). Poly(ε-caprolactona) (PCL) (Mw = 80,000), Sorbitan Monostearate and Polysorbate 80 were purchased from Sigma-Aldrich (Brazil). Acetone was obtained from Nuclear (Brazil). HPLC-grade acetonitrile (ACN) and methanol (MeOH) was acquired from Tedia (Brazil). Purified water was prepared using a Mili-Q Plus (Millipore, US). Essential oils from grape seed (Vitis vinifera L.) and ginger (Rosmarinus
officinalis) were purchased from Quinari (Brazil).
2.2 EQUIPMENT AND CHROMATOGRAPHIC CONDITIONS
High performance liquid chromatograph Prominence® (Shimadzu), equipped with quaternary pump, automated injector, photodiode array detector (PDA) and LC software v. 1.22 SP1. For the separation of the compounds we used a C18 reverse phase column (Venusil® XBP, 4.6 × 150 mm, 5 μm) and and mobile phase composed of acetonitrile, 0.1% phosphoric acid (pH 3) and methanol (60:30:10 v / v / v). The flow rate was 1 mL.min-1. Injection volume of 20 μL and ATV detection at 245nm.
2.3 NANOCAPSULES PREPARATION
Atorvastatin nanocapsules (NCAt) containing essential oils from grape seed (Vitis vinifera
L.) (NCAtU) or ginger (Rosmarinus officinalis) (NCAtG) were prepared by the preformed polymer
precipitation method, according to Venturini et al. (2011) and Bender et al. (2012). The technique consists in the preparation of two phases, one of them is organic containing acetone, the polymer PCL, sorbitan monostearate (SPAN 60), grape seed oil (Vitis vinifera L.) or Ginger oil (Zingiber
officinale) and the drug atorvastatin. The aqueous phase is formed by distillated water and
polysorbate 80 (Tween 80). After the total solubilization of both phases of the formulation, the organic phase was poured with magnetic agitation under the aqueous phase using a small funnel. Utilizing a rotary evaporator (Büchi, Switzerland), the organic solvent and a part of the aqueous phase where concentrated.
2.4 SAMPLE AND STANDARD SOLUTIONS
In the drug content evaluation, stock solution of ATV (1000 μg.mL-1) was prepared by dissolving accurately weighed 10 mg of the drug in methanol using 10 mL volumetric flask. Standard solution was prepared by dilution of the diluted stock solution with mobile phase to obtain solutions in a final concentration of 10 μg.mL-1. To prepare the sample solutions, 0.10 mL of NCAtG
Braz. J. of Develop.,Curitiba, v. 6, n. 8, p.63606-63617 aug. 2020. ISSN 2525-8761
or NCAtU (1 mg.mL-1 of ATV in both) were transferred into a 10 mL volumetric flask and completed with acetonitrile, obtaining the final concentration of 10 µg.mL-1. This flask was kept in an ultrasonic bath for 60 min, causing partial dissolution of the polymer and release of the active contained into the nanostructure. The solutions were filtered through a 0.45 µm membrane filter and analyzed by HPLC, determining the total concentration of ATV.
2.5 VALIDATION OF ANALYTICAL METHOD
All validation was performed following the International Conference on Harmonization of Technical Requirements for Registration of Pharmaceuticals for Human Use (ICH, 2005). The parameters evaluated in the development of this work were: Linearity, selectivity, limit of quantification (LQ), limit of detection (LD), precision, accuracy and robustness.
2.6 LINEARITY
The linearity study was evaluated by linear regression using the R2 of the calibration curve (n = 3) which was constructed using the ATV 1000 µg.mL-1 stock solution and NCAtG or NCAtU samples at the dilutions of 10, 15, 20, 25 and 50 µg.mL-1.
2.7 SELECTIVITY
The selectivity of the method has the purpose to evaluated if the constituents of the nanocapsules interfered in the quantification of ATV. The experiment was performed by injecting a midpoint of the ATV calibration curve (15µg.ml-1) with the sample solutions (NCAtG and NCAtU) and of empty nanocapsule suspension (without drug), called (NCUv e NCGe). At the end, the chromatograms obtained in the analysis were compared, observing the drug retention time and the analytical signal intensity.
2.8 QUANTITATION LIMIT (LQ) AND DETECTION (LD)
The limits were calculated by the signal-to-noise ratio comparing the two encapsulated ATV measurements (NCAtG and NCAtU) and the free drug. LD was considered a 3:1 signal-to-noise ratio, while LQ was considered a 10:1 signal-to-noise ratio. All analyzes were performed at least five times (n = 5). Relative standard deviation (RSD) was calculated across all ATV determinations. 2.9 PRECISION
The precision was evaluated by repeatability and intermediate precision. This way six samples from same concentration (15 µg.mL-1 NCAtG and NCAtU), were analyzed in a single day (day 1/n=6). After, the analyses were respited through three dais whit a different analyst (day 2/n=
Braz. J. of Develop.,Curitiba, v. 6, n. 8, p.63606-63617 aug. 2020. ISSN 2525-8761
3 and day 3/n= 3). The results were expressed as percentage of the drugs content (%) and by the relative standard deviation (RSD).
2.10 ACCURACY
The accuracy was evaluated utilizing the drug recovering method. This way, three samples of NCGe and NCUv were utilized as blank NC (without ATV), and after that, concentrations of 10, 20 and 30 µg.mL-1 of the standard solution of ATV were add to the formulations. Each of these concentrations were prepared in triplicate (n=3) and the recuperation of the drug was evaluated. 2.11 ROBUSTNESS
Methodology robustness was evaluated by means of minor and deliberated alterations of chromatographical conditions. Thus, we modified the analysis parameters of NCAtG and NCAtU formulations such as pH (2.8 and 3.1), mobile phase proportions (32.5: 7.5: 60 and 27.5: 12.5: 60), detector (:243 and 247 nm) and flow rate. injection (0.8 and 1.1 mL.min-1). Robustness confirmation was evaluated in terms of the RSD value obtained from determination at each condition when compared to the original setup.
3 RESULTS AND DISCUSSION
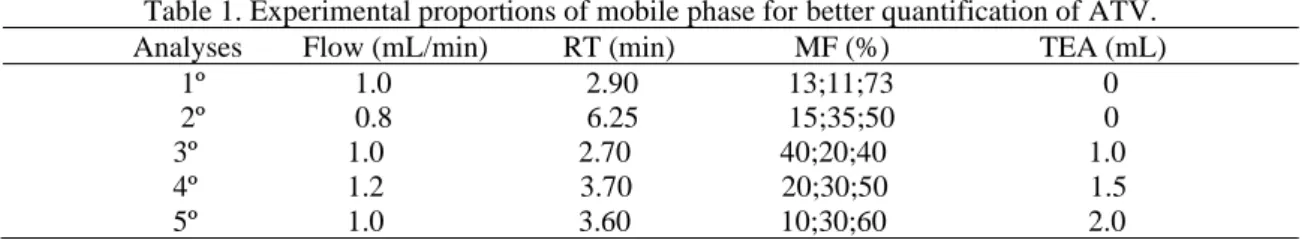
Aiming the reliability in the quantification of encapsulated ATV in polymeric nanocapsules was realized the validation of the analytic method. Other studies that determined the actual ATV content by liquid chromatography were based on the use of the isolated asset. (Silva et al. 2019; Courlet et al 2019). In our study, the process of validation of the analytic method considered the possible interferences of the compounds of the nanocapsules, such as adjuvants of the polymeric wall and the essential oils (grape seed and ginger) in the nucleus. For this purpose, we test some mobile phase proportions aiming to obtain the best chromatographic results (Reolon et al., 2018) (Table 1).
Table 1. Experimental proportions of mobile phase for better quantification of ATV. Analyses Flow (mL/min) RT (min) MF (%) TEA (mL)
1º 1.0 2.90 13;11;73 0 2º 0.8 6.25 15;35;50 0 3º 1.0 2.70 40;20;40 1.0 4º 1.2 3.70 20;30;50 1.5 5º 1.0 3.60 10;30;60 2.0
Braz. J. of Develop.,Curitiba, v. 6, n. 8, p.63606-63617 aug. 2020. ISSN 2525-8761
Using the PDA detector, it was possible to analyze the purity peaks of the ATV, obtaining a purity of 0.9998. This result indicate an adequate chromatographic separation between the ATV and some interferents. The Figure 2 shows a common chromatogram from the ATV analyses.
Fig 2. Typical chromatogram obtained for ATV by utilizing the selected experimental conditions.
3.1 LINEARITY
The linearity of the ATV determination in nanocapsules was demonstrated according the type of nanocarrier. In this case, calibration curves were plotted to NCAtG and NCAtU using two analytic curves. The method showed to be linear in the range of 10 to 50 μg.mL-1 for ATV, with the
linearity coefficient (R2) 0.9987 and 0.9944 for NCAtG and NCAtU, respectively. This confirms that the response of the equipment is indeed proportional to the drug concentrations in the samples. (ICH, 2005). The validity of the assays was verified by ANOVA analysis, which demonstrated significant linear regression and no significant linearity deviation (Table 2).
Table 2: Results concerning methodology linearity by the ANOVA analysis for ATV in NCAtG and NCAtU.
NCAtU NCAtG Correlation coefficients Line equations Linearity range Linear regression 0.9944 Y = 3717*X + 21617 10-50 µg.mL-1 Fcalculated = 565.1 > Fcritical = 1.3 0.9987 Y = 7370*X – 13122 10-50 µg.mL-1 Fcalculated = 2918 > Fcritical = 1.3
Braz. J. of Develop.,Curitiba, v. 6, n. 8, p.63606-63617 aug. 2020. ISSN 2525-8761 3.2 SELECTIVITY
The selectivity is the capacity of evaluate unambiguously the analyte in the presence of compounds whose may be present, and may interfere in the quantification, increasing the tendency of the analyses error (Ermer and Nethercote , 2015). According the chromatograms obtained for all formulations containing ATV (NCAtG and NCAtU) when compared to the without the drug (NCGe and NCUv), it was possible to observe that the different constituents of the nanoformulations do not interfered in the ATV quantification (Fig.3). In both cases there was no overlap of peaks between these formulations with and without ATV, demonstrating the selectivity of the method
Fig 3. Chromatograms of formulations with ATV: NCAtU and NCAtG (A and C) and without ATV: NCUv and NCGe (B and D).
3.3 LIMIT OF DETECTION (LD) AND QUANTIFICATION (LQ)
To determine the methodology sensitivity, LD and LQ were assessed. LD values were 30 ng.mL−1 and 39 ng.mL−1 for ATV in NCAtG and NCAtU, respectively. While LQ values were 300 ng.mL−1 and 390 ng.mL−1 for ATV in NCAtG and NCAtU, respectively. These demonstrating that the method is sensible enough to determine ATV in polimeric nanoparticles.
3.4 PRECISION
Repeatability and intermediate precision results are expressed as percentage of the drug content, and also as RSD (Table 3). Repeatability assessment was conducted by analyzing six different samples (NCAtG and NCAtU) at the same day, and the same experimental conditions.
Braz. J. of Develop.,Curitiba, v. 6, n. 8, p.63606-63617 aug. 2020. ISSN 2525-8761
RSD values were 1.28 % for NCAtG and NCAtU. Intermediate precision was evaluated by a total amount of twelve analyzes for three consecutive days, where RSD values were 1.64% for NCAtG and 1.97% for NCAtU. Recovered content were about 90.23 % and 92.32 % for NCAtG and NCAtU, respectively, in all assays. All RSD values were lower than 2%, what is within the established limits, asserting the methodology precision (ICH, 2005).
Table 3: Content values for NCAtG and NCAtU, expressed as % and RSD, representing repeatability and intermediate precision. NCAtG NCAtU Repeatability Content (%) 98 93 RSD 1 1.28 1.28 Content (%) 98 91 RSD 2 0.78 0.32 Content (%) 105 101 RSD 3 1.11 0.58 Intermediate precision Content (%) 90.2 92.3 RSD Intermediate 1.64 1.97
RSD: relative standard deviation
3.5 ACCURACY
Accuracy has assessed recovery percentage after adding known amounts of ATV at three different concentrations on NCGe or NCUv (NC without active) (Table 4). Values of recovery percentages were satisfactory, since it remained between 91.48 and 100.93 % for NCAtG, as well as 96.45 and 105.36 for NCAtU. The RSDs values was less than 2% for both, asserting the methodology accuracy, according to the established standards (ICH, 2005).
Table 4: Percentage (%) content values and RSD for atorvastatin quantification in polymeric nanocapsules, at the three evaluated concentrations, representing the method accuracy.
NCGe NCUv
ATV (%)*
Low concentration 91.48 ± 1.23 102.41 ± 1.31
Middle concentration 100.93 ± 1.25 105.36 ± 1.16
High concentration 98.58 ± 0.95 96.45 ± 0.07
*Values expressed as mean ± RSD; ATV: atorvastatin; RSD: relative standard deviation; NCGe and NCUv: nanocapsules suspension without ATV.
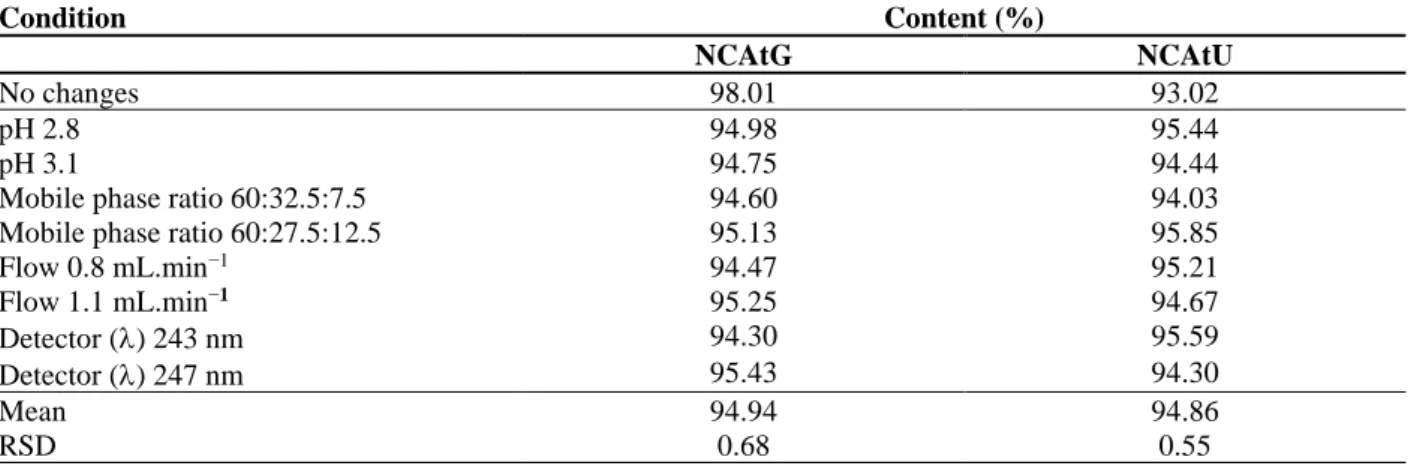
3.6 ROBUSTNESS
The achievement of small and deliberate changes in the conditions of analysis allowed to determine the methodological robustness. We observed that, for the selected chromatographic conditions, there was no impediment affecting the determination of ATV (Table 5). The peak areas
Braz. J. of Develop.,Curitiba, v. 6, n. 8, p.63606-63617 aug. 2020. ISSN 2525-8761
showed no significant changes and, the content stood close to 100%. In addition, RSD values were lower than 2% for all the varied conditions tested (pH, mobile phase ratio, flow and detector). In this case, the data obtained suggest that the methodology is robust according to the variations evaluated for quantify ATV from nanocapsules.
Table 5: ATV content and their respective RSD values obtained by the chromatographic condition variation in the nanocapsules systems. Condition Content (%) NCAtG NCAtU No changes 98.01 93.02 pH 2.8 94.98 95.44 pH 3.1 94.75 94.44
Mobile phase ratio 60:32.5:7.5 94.60 94.03
Mobile phase ratio 60:27.5:12.5 95.13 95.85
Flow 0.8 mL.min−1 94.47 95.21 Flow 1.1 mL.min−1 95.25 94.67 Detector () 243 nm 94.30 95.59 Detector () 247 nm 95.43 94.30 Mean 94.94 94.86 RSD 0.68 0.55 4 CONCLUSIONS
Considering the ICH determined standards, the analytical method for the detection and quantification of the ATV was linear, precise, accurate, robust and specific in the concentration range from 10 to 50 μg.mL-1. The obtained limits of quantification and detection indicated that the
method is effective to quantify the ATV for a minimum concentration of 300 ng.mL−1 and 390 ng.mL−1 in NCAtG and NCAtU, respectively. Thus, the validated method was suitable for quantification of ATV in polymeric nanocapsules based on ginger or grape seed essential oils.
ACKNOWLEDGEMENTS
The authors thank CAPES (Brazil) for providing a master student fellowship. Financial support from the PRONEX FAPERGS/CNPq 12/2014.
Braz. J. of Develop.,Curitiba, v. 6, n. 8, p.63606-63617 aug. 2020. ISSN 2525-8761
REFERENCES
Arrigoni E, Del Re M, Fidilio L, Fogli S, Danesi R, Di Paolo A. Pharmacogenetic Foundations of Therapeutic Efficacy and Adverse Events of Statins. Int J Mol Sci, 2017; 18, 104.
Bender EA, Adorne MD, Colome LM, Abdalla DSP, Guterres SS, Pohlmann AR. Hemocompatibility of poly(epsilon-caprolactone) lipid-core nanocapsules stabilized with polysorbate 80-lecithin and uncoated or coated with chitosan. Int J Pharm, 2012; 426(1–2):271– 279.
Bernardi DS, Pereira TA, Maciel NR, Bortoloto J, Viera GS, Oliveira GC, Rocha-Filho PA. Formation and stability of oil-in-water nanoemulsions containing rice bran oil: in vitro and in vivo assessments. J Nanobiotechnology, 2011; 9, 44.
Briasoulis A, Agarwal V, Valachis A, Messerli FH. Antihypertensive effects of statins: a meta-analysis of prospective controlled studies. J Clin Hypertens (Greenwich), 2013; 15(5): 310-320. Colomé LM, Freitas GM, Bastiani JM, Pereira TCB, Bajerski L, Bender EA, Haas SE. Validation of analytical method by HPLC for determination of dapsone in polymeric nanocapsules based on crude rice brain oil. J App Pharm Sci, 2017; 7(7): 230-233.
Courlet P, Spaggiari D, Desfontaine V, Cavassini M, Saldanha SA, Buclin T, Marzolini C, Csajka C, Decosterd LA. UHPLC-MS/MS assay for simultaneous determination of amlodipine, metoprolol, pravastatin, rosuvastatin, atorvastatin with its active metabolites in human plasma, for population-scale drug-drug interactions studies in people living with HIV. J. Chromatogr. B, 2019; 1125: 121733.
Ermer J, Nethercote, P, 2015. Method Validation in Pharmaceutical Analysis: A Guide to Best Practice. Wiley-VCH, Germany.
Ferreira AM, Marques da Silva P. Defining the Place of Ezetimibe/Atorvastatin in the Management of Hyperlipidemia. Am J Cardiovasc Drugs, 2017; 17(3):169-181.
Gomez-Gerique JA, Alvarez-Sala LA, Armada B, Fernandez-Arias I, Martinez J, Hernandez G, Group CS. A six-month, multicenter, open-label, noncomparative, prospective, observational study of the efficacy and tolerability of atorvastatin in the primary care setting(estudio del control de las hiperlipidemiasen atencion primaria): the cheap study. Curr Ther Res Clin Exp, 2003; 64(6): 338-354.
ICH 2005. Harmonised Tripartite Guideline; Validation of Analytical Procedures: Text and Methodology. Geneva: IFPMA.
Joy TR., Hegele RA. Narrative review: statin-related myopathy. Ann Intern Med, 2009; 150(12): 858-868.
Patel A, Macwana C, Parmar V. Patel S. Simultaneous determination of atorvastatin calcium, ezetimibe, and fenofibrate in a tablet formulation by HPLC. J AOAC Int, 2012; 95(2): 419-423.
Braz. J. of Develop.,Curitiba, v. 6, n. 8, p.63606-63617 aug. 2020. ISSN 2525-8761
Peng S, Xu LW, Che XY, Xiao QQ, Pu J, Shao Q, He B. Atorvastatin Inhibits Inflammatory Response, Attenuates Lipid Deposition, and Improves the Stability of Vulnerable Atherosclerotic Plaques by Modulating Autophagy. Front Pharmacol, 2018; 9:438.
Reolon JB, Brustolin M, Haas SE, Bender EA, Malesuik MD, Colomé LM. Development and validation of high-performance liquid chromatography method for simultaneous determination of acyclovir and curcumin in polymeric microparticles. J App Pharm Sci, 2018; 8 (01): 136-141. Silva J, Basso J, Sousa J, Fortuna A, Vitorino C. Development and full validation of an HPLC methodology to quantify atorvastatin and curcumin after their intranasal co‐delivery to mice. Biomedical Chromatography. 2019; 33(10): e4621.
Siqueira MC, Stutz ETG, Da Silva TC, Alves JNC. Avaliação do efeito hipocolesterolêmico da
cuphea ingrata cham. & schltdl. (sete-sangrias) em camundongos induzidos à hipercolesterolemia.
Braz. J. of Develop. 2020; Curitiba, v.6, n.8, p.60518-60531
Varache M, Powell LC, Aarstad OA, Williams TL, Wenzel MN, Thomas DW, Ferguson EL. Polymer Masked-Unmasked Protein Therapy: Identification of the Active Species After Amylase-activation of Dextrin-Colistin Conjugates. Mol Pharm, 2019; 16: 3199-3207.
Venturini CG, Jäger E, Oliveira CP, Bernardi A, Battastini AMO, Guterres SS, Pohlmann AR. Formulation of lipid core nanocapsules. Colloids and Surf A: Physicochem Eng Aspects, 2011; 375:200–208.
V K JB, Ramakrishna S, Madhusudhan B. Preparation and characterisation of atorvastatin and curcumin-loaded chitosan nanoformulations for oral delivery in atherosclerosis . IET Nanobiotechnol, 2017; 11(1), 96–103.
Zidiotii GR, Eberle MEL, Da Silva GAR, Pittarelli BFS, Da Silva TT, Truite CVR, Barão CE, Marcolino VA. Desenvolvimento de uma bala de gelatina adicionada de resveratrol como alternativa de combate ao colesterol infantil. Braz. J. of Develop., Curitiba, v. 6, n.2, p.8585-8591.