Braz. J. of Develop., Curitiba, v. 5, n. 10, p. 18267-18281, sep. 2019 ISSN 2525-8761
The GAR(1) model with fragment method for hydrological drought risk
assessment in semiarid regions
O modelo GAR(1) com método de fragmento para avaliação de risco de
seca hidrológica em regiões semiáridas
DOI:10.34117/bjdv5n10-086
Recebimento dos originais: 12/09/2019 Aceitação para publicação: 07/10/2019
Marcos Airton de Sousa Freitas
Especialista em Recursos Hídricos Instituição: Agência Nacional de Águas - ANA
Endereço: Setor Policial Sul, Área 5, Qd. 3, Bloco N -Brasília – DF, Brasil E-mail: masfreitas@ana.gov.br
Gabriel Belmino Freitas
Estudante de Economia
Instituição: Departamento de Economia, Universidade de Brasília (UnB) Darcy Ribeiro - Prédio da FACE Asa Norte - CEP: 70910-900 - Brasília – DF
E-mail: gabrielbelminofreitas@gmail.com
ABSTRACT
The Northeast Brazil has been recognized as an area that will suffer greatly from the effects of variability and climate change. This will lead to a reduction of precipitation and streamflow in the region, causing greater pressure on the scarce water resources of the region, especially on the water stored in the reservoirs. Optimization of the design and operation of multipurpose reservoir systems depends on the ability of synthetic streamflow generation models to reproduce the typical intermittent characteristics of semi-arid rivers. A Gamma Autoregressive – GAR(1) model have been tested and applied, for generating annual flows, coupled with the Fragment Method to disaggregate the annual flows to monthly ones. This coupled model was applied to four typical intermittent basins of the NE-Brazil, with drainage area varying from 410 to 5.695 Km². In order to analyze the performance of the model not only the statistical parameters (mean, variance, lag-1 serial correlation, etc.) of the historical and generated series were examined, but also a storage analysis by mean of the Sequent-Peak-Algorithm (SPA) was performed and additionally the preservation of the droughts and floods characteristics (duration, severity and magnitude) of the historical series was analyzed. This model was able to preserve the statistical parameters of the historical time series. However, when the generated synthetic flows were used to a storage analysis the model was not adequate to reproduce, particularly, the persistence (long periods of low and high flow) encountered in the historical series, which is fundamental by the reservoir design and for hydrological drought risk assessment.
Keywords: hydrological drought, intermittent rivers, reservoir operation optimization. RESUMO
Braz. J. of Develop., Curitiba, v. 5, n. 10, p. 18267-18281, sep. 2019 ISSN 2525-8761 O Nordeste do Brasil tem sido reconhecido como uma área que sofrerá muito com os efeitos da variabilidade e das mudanças climáticas. Isso levará a uma redução da precipitação e do fluxo da região, causando maior pressão sobre os escassos recursos hídricos da região, especialmente sobre a água armazenada nos reservatórios. A otimização do projeto e operação de sistemas de reservatórios multiuso depende da capacidade dos modelos de geração de fluxo sintético de reproduzir as características intermitentes típicas de rios semi-áridos. Um modelo gama-autorregressivo - GAR (1) foi testado e aplicado, para gerar fluxos anuais, juntamente com o método de fragmentos para desagregar os fluxos anuais para os mensais. Este modelo acoplado foi aplicado a quatro bacias intermitentes típicas do Nordeste do Brasil, com área de drenagem variando de 410 a 5.695 Km². Para analisar o desempenho do modelo, não foram examinados apenas os parâmetros estatísticos (média, variância, correlação serial lag-1, etc.) das séries históricas e geradas, mas também uma análise de armazenamento por meio do método Sequent-Peak- Foi realizado o algoritmo (SPA) e, adicionalmente, foi analisada a preservação das características de secas e inundações (duração, severidade e magnitude) das séries históricas. Este modelo foi capaz de preservar os parâmetros estatísticos das séries temporais históricas. No entanto, quando os fluxos sintéticos gerados foram utilizados para uma análise de armazenamento, o modelo não foi adequado para reproduzir, particularmente, a persistência (longos períodos de baixo e alto fluxo) encontrada nas séries históricas, fundamental para o projeto do reservatório e para a hidrologia. avaliação de risco de seca.
Palavras-chave: seca hidrológica, rios intermitentes, otimização da operação do reservatório.
1 INTRODUCTION
The Northeast Brazil has been recognized as a drought prone area (Freitas and Billib, 1997). Furthermore, this region will suffer greatly from the effects of rainfall variability and climate change. This will lead to a reduction of precipitation and streamflow in the region, causing greater pressure on the scarce water resources of the region, especially on the water stored in the reservoirs (Martins et al., 2013; Rusteberg and Freitas, 2018).
Several models are described in the literature for the generation of synthetic streamflow series, which make use of different time intervals. In general, they can be arranged into two groups (Freitas, 1995): direct simulation methods and aggregation-disaggregation methods. To the first category belong those models that generate flows simultaneously to different time intervals (Sim, 1987; Claps et al., 1993). By disaggregation models, however, the flows are originally generated for a longer time interval, e.g., one year and then they are broken down into smaller time intervals, such as month, week, day, etc. (Grygier and Stedinger, 1988; Lin and Lee, 1992).
Silva and Portela (2011) have proposed a procedure for generating synthetic series of annual and monthly flows that combines two models, a probabilistic one, applied at an annual level, and at a monthly level, a deterministic disaggregation model. The modeling of the annual flow series was based on the random sampling of the log-Pearson III law of probability. The
Braz. J. of Develop., Curitiba, v. 5, n. 10, p. 18267-18281, sep. 2019 ISSN 2525-8761 disaggregation of annual flows into monthly flows uses the method of fragments. The combination of the two models was tested on a data set of 54 streamflow samples from gauging stations geographically spread over Mainland Portugal. For each gauging station, 1200 synthetic series were generated, with a length equal to that of the corresponding sample. The quality of the generated series was evaluated by their capacity to preserve the most significant statistical characteristics of the samples of annual and monthly flows, namely the mean, standard deviation, and skewness coefficient (Silva and Portela, 2011).
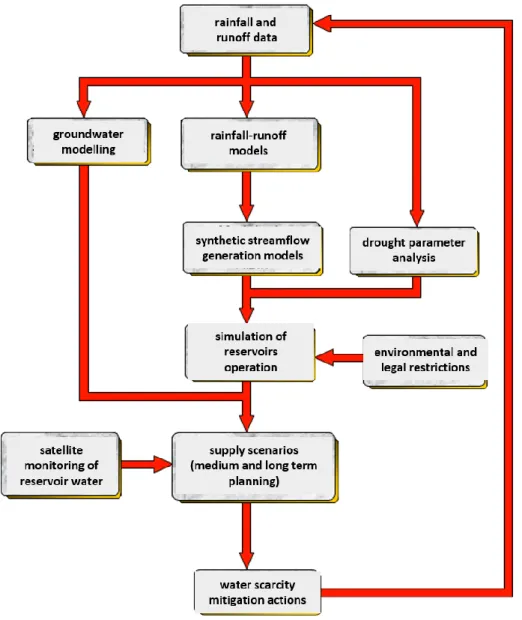
Figure 1: Schematic conception of the Drought Management System (SIGES) subcomponent concerning the hydrological drought risk assessment and reservoir operation (Freitas, 2010).
Braz. J. of Develop., Curitiba, v. 5, n. 10, p. 18267-18281, sep. 2019 ISSN 2525-8761 The Drought Management System (SIGES) subcomponent, referring to the analysis of hydrological droughts (Figure 1) is basically composed of the associated use of rainfall-runoff models and synthetic streamflow generation models, employed in reservoir operation simulation. These models should, however, be able to reproduce the characteristics of the drought and flood periods typical of intermittent rivers of the Brazilian semi-arid (Freitas, 2010).
One problem faced in the streamflow droughts modeling of river belonging to semi-arid regions is the treatment of zero flows in the monthly series, due to the appearance of intermittent rivers. This paper presents a model formed by coupling an annual model (the GAR(1) model) with a monthly disaggregation streamflow model (Fragment Method).
GAR(1) Model
The proposed model is formed by the union of the GAR(1) - 1st order Gamma Autoregressive Model, to generate the streamflow at annual level, with the Fragments Method presented by Svanidze (1980), for disaggregation into monthly flows. A basic property of the GAR(1) model is that it does not need for transformation of the historical data flow.
According to Lawrence and Lewis (1981), a 1st order Gamma Autoregressive Model or GAR(1) model can be described by an additive process as follows:
t t t X X 1 (1) with t
X = streamflow in the time interval t;
= autocorrelation coefficient;
t
= independent random variable.
For the variable X , according to the method of moments: t
(2) 2 2 (3)
Braz. J. of Develop., Curitiba, v. 5, n. 10, p. 18267-18281, sep. 2019 ISSN 2525-8761
2 (4)
1 (5)
where ,
and represent respectively the parameters of position, scale and form of a three parameters gamma probability distribution function, given by:
) ( ) ( exp ) ( ) ( 1 x x x fx (6)The mean (), standard deviation (
), the skewness (), and the lag-1 autocorrelation coefficient (1) of the population can be estimated from the sample by:
N i i X N m 1 1 (7)
N i i m X N s 1 2 2 ) ( 1 1 (8)
N i i m X s N N N g 1 3 3 1 ( ) ) 2 )( 1 ( (9)
1 1 1 2 1 ( )( ) ) 1 ( 1 N i i i m X m X s n r (10)where N is the number of years of annual flow series.
Because it is a variable with non-normal probability distribution, the values estimated by the three previous equations (7 to 9) show bias, so it is necessary to apply corrections to the values calculated above. For the autocorrelation coefficient, Wallis and O'Connell (1972) proposed the following correction:
4 1 1 1 N N r (11)
Braz. J. of Develop., Curitiba, v. 5, n. 10, p. 18267-18281, sep. 2019 ISSN 2525-8761 For standard deviation, according to Matalas (1966):
2 2 1 s K N N (12) where
2
1 1 1 2 1 ) 1 ( ) 1 ( 2 ) 1 ( N N K N (13)The following correction of bias in the estimation of the coefficient of skewness has been proposed by Bobée and Robitaille (1975):
N g N L B A Lg 2 1 2 1 0 (14) where
L = limit value of an independent asymmetric distribution; N = sample size.
For the gamma distribution, for values 0,25 5 and 20N90, Bobée and Robitaille (1975) showed that the following are valid:
2 1 2 , 20 51 , 6 1 N N A (15) 2 1 77 , 6 48 , 1 N N B (16)
For values of N between 10 and 20, that due to the scarcity of streamflow measurements in intermittent rivers of northeastern Brazil is indeed common, Freitas (1995), based on an optimization procedure, proposed the following expressions to estimate the parameters A and B, for the gamma distribution:
2 1 71 , 28 02 , 6 1 N N A (17) 2 1 27 , 7 50 , 1 N N B (18)
Braz. J. of Develop., Curitiba, v. 5, n. 10, p. 18267-18281, sep. 2019 ISSN 2525-8761 For the lognormal distribution and values of N between 10 and 20, Freitas (1995) has proposed: A0,906,70N143,00N2 and B 0,01N1124,00N2. For the Weibull distribution and values of N between 10 and 20, Freitas (1995) has proposed the following:
2 1 00 , 15 50 , 7 88 , 0 N N A e B0,30N138,00N2.
The skewness, however, is not only dependent on sample size N, but also on the autocorrelation coefficient. Fernandez and Salas (1990), based on Monte-Carlo simulation, have proposed a further correction to the expression given by Bobée and Robitaille (1975):
f 0
(19)
Being f the new correction factor to the following conditions 0,5 2,0 and
8 , 0 01 , where: ) 12 , 3 1 ( 13,7 0,49 N f (20)
If 1 0, automatically f 1 , so that there is no need of correction.
For a random number generation with gamma distribution the following scheme has been used: (1 ) (21) where
M j U j M Y M j 1 0 ) ( 0 0 withM = Poisson random variable with mean equal to ln()
j
U = uniform random variable (0,1)
j
Braz. J. of Develop., Curitiba, v. 5, n. 10, p. 18267-18281, sep. 2019 ISSN 2525-8761
2 METHOD OF FRAGMENTS
The Method of Fragments from Svanidze (1980) is based on the disaggregation of annual flows generated by some annually model (in this case, the GAR(1) model) into monthly flows (or shorter time interval). The model is characterized by estimating, for each month j and each year i of the historical flow series, the so-called fragments, given by:
f Q Q i j i j i j j n , , ,
1 (22) where:n = number of months (n = 12); Qi j, = streamflow in month j of year i.
The fragments fi j, correspond to the percentage of annual streamflow (the
denominator of the equation 22) in year i. Following the historic annual flow values are placed in ascending order and separated into classes. The limits of the class intervals are formed by the mean values of successive flows. The total number of classes is equal to the number of years within the flow series measurement. The first class has zero as the lower limit and the last class upper limit of the last class is infinite. The annual streamflows generated are then distributed according to the class intervals and fragmented into monthly values, as follows.
k i k j j i f Q Q, (23) where k i
Q = vazão gerada pelo modelo anual, pertencente a classe k; k
j
f = fragmento correspondente do mês j da classe k.
3 GAR(1) MODEL WITH FRAGMENT METHODS
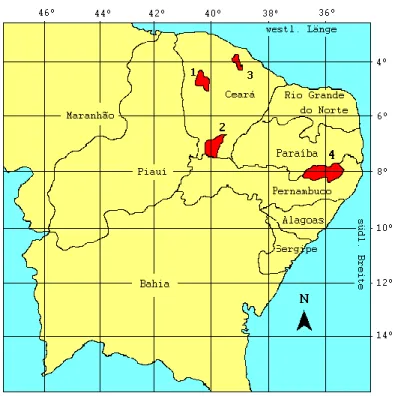
The coupled model GAR (1) / Method of Fragments was applied to 4 semiarid basins northeastern Brazil (Sítio Poço Dantas; Faz. Cajazeiras; Sítio Novos e Limoeira), with drainage area ranging between 410 and 5.695 km² (Figure 2). To analyze the performance of the model in generating synthetic monthly streamflows the following criteria were used: i) comparing the statistical parameters (mean, standard deviation, coefficient of variation, skewness, correlation coefficient and autocorrelation coefficient) of the generated and historical series, ii) analysis of standard capabilities of reservoirs by using the
Braz. J. of Develop., Curitiba, v. 5, n. 10, p. 18267-18281, sep. 2019 ISSN 2525-8761 Algorithm (SPA) and iii) analysis of characteristic parameters (duration, severity and magnitude) of floods and droughts periods.
Figure 2: Location of analyzed basins.
The Sequent-Peak-Algorithm (SPA), presented by Loucks et al. (1981) and applied by Vogel and Stedinger (1987), Adeloye (1993), Freitas (1995, 2010), as well Tallaksen et al. (1996), can thus be formulated as follows:
Let Kt be the storage capacity required at the beginning of period t, Yt be the required release during the period, and Qt be the corresponding inflow during period t. If one defines:
T t for otherwise positive if K Q Y Kt t t t 2 ; 0 ; 1 (24)
then the reservoir capacity Cp required is given by:
Braz. J. of Develop., Curitiba, v. 5, n. 10, p. 18267-18281, sep. 2019 ISSN 2525-8761 To implement equation 24, the reservoir is assumed to be initially full, i.e. K0=0.0.
Also, equation 24 is applied over 2T, where T is the length of data record, to take care of a situation in which the critical period is close to the end of record T; this wrapping round of the streamflow data record also ensures, as was noted earlier, that a steady-state solution to the storage-yield problem is obtained (Vogel, 1987; Adeloye, 1993).
Hence equation 24 is termed the double cycling SPA and the capacity Cp thus obtained represents the minimum storage required over the historic T-year period to supply the desired yield Y without shortages.
For each river basin 100 monthly series of 50-year extension have been generated. There have been calculated the minimum, maximum, median and the 25% and 75% quantile of various parameters of the series generated as well as the historical value corresponding to each month. Each of the 1000 traces (with 50 years of data extension) was routed through the reservoir using the SPA (equation 24) and the capacity required to satisfy the yield Y without failure over the T-year period was determined (equation 25).
Table 1 shows the result of 1000 yearly sets simulation, each with a 50-year extension. The values of the standardized required capacity curve (mean, standard deviation, median, 90% quantile and non-exceedance probability), determined with the series (twice as long) via Index-Sequential-Method (ISM), as Loucks et al. (1981) and the AR(1) model, according to Maass et al. (1962), but with log-gamma distribution according to Freitas (1995) and GAR(1) model, are herein presented. It is seen that the AR(1) model underestimates the standardized required capacity. Furthermore, only 15% of the generated series had more extreme dry periods that exist in the historical serie.
Table 1: Simulation of the reservoir by SPA: Capacity of the model to reproduce extreme
drought periods - Cp statistics (1000 generated series), respectively, for the Sítio Poço Dantas, Faz. Cajazeiras, Sítio Novos and Limoeira stations.
Sítio Poço Dantas station
Model Cp Stand. deviation median Q90% P(%) ISM 4.275 0.000 4.275 4.275 0 AR(1) 4.178 2.707 3.902 6.116 45 GAR(1) 4.486 2.437 4.221 6.530 50
Braz. J. of Develop., Curitiba, v. 5, n. 10, p. 18267-18281, sep. 2019 ISSN 2525-8761 Faz. Cajazeiras station
Model Cp Stand. deviation median Q90% P(%) ISM 6.035 0.000 6.035 6.035 0 AR(1) 3.759 2.008 3.505 5.629 10 GAR(1) 4.101 2.200 3.874 6.203 15
Sítio Novos station
Model Cp Stand. deviation median Q90% P(%) ISM 6.718 0.000 6.718 6.718 0 AR(1) 0.880 0.095 0.827 1.279 0 GAR(1) 3.858 1.665 3.627 5.599 5 Limoeira station Model Cp Stand. deviation median Q90% P(%) ISM 6.676 0.000 6.676 6.676 0 AR(1) 0.594 0.046 0.557 0.873 0 GAR(1) 3.815 1.679 3.552 5.481 5
Table 2 shows the mean statistical parameters for the duration, severity and magnitude of drought periods of the generated time series by AR(1) and GAR(1) models for Sítio Poço Dantas station, Ceará State.
Table 2: Statistical parameters of drought periods of the historical and generated series for
Sítio Poço Dantas station, Ceará State.
Statistical Parameter (Drought duration)
Historical Serie Generated Series with AR(1) model Generated Series with GAR(1) model mean (year) 3,667 3,323 3,041
Braz. J. of Develop., Curitiba, v. 5, n. 10, p. 18267-18281, sep. 2019 ISSN 2525-8761
variation coeff. 0,417 0,824 0,834
skewness coeff. -0,382 1,969 2,588
lag-1 autocorrel. coeff. -0,595 0,002 0,036
Statistical Parameter (Drought severity)
Historical Serie Generated Series with AR(1) model Generated Series with GAR(1) model mean (m³/s*year) 87,480 107,989 159,845
stand. dev. (m³/s*year) 53,866 95,152 148,100
variation coeff. 0,616 0,881 0,927
skewness coeff. -0,160 2,030 2,499
lag-1 autocorrel. coeff. -0,542 0,000 0,035
Statistical Parameter (Drought magnitude)
Historical Serie Generated Series with AR(1) model Generated Series with GAR(1) model mean (m³/s) 22,173 32,290 50,496 stand. dev. (m³/s) 6,080 11,240 18,245 variation coeff. 0,274 0,348 0,361 skewness coeff. -0,261 -0,461 -0,631
lag-1 autocorrel. coeff. -0,567 -0,030 0,039
Table 3 shows the mean statistical parameters for the duration, severity and magnitude of drought periods of the generated time series by AR(1) and GAR(1) models for Faz. Cajazeiras station, Ceará State.
Table 3: Statistical parameters of drought periods (duration, severity and magnitude) of the historical and generated series for Faz. Cajazeiras station, Ceará State.
Statistical Parameter (Drought duration)
Historical Serie Generated Series with AR(1)
model
Generated Series with GAR(1)
Braz. J. of Develop., Curitiba, v. 5, n. 10, p. 18267-18281, sep. 2019 ISSN 2525-8761
mean (year) 4,000 3,162 3,083
stand. dev. (year) 3,000 2,912 2,587
variation coeff. 0,750 0,920 0,839
skewness coeff. 0,000 3,468 1,907
lag-1 autocorrel. coeff. 0,000 -0,003 0,009
Statistical Parameter (Drought severity)
Historical Serie Generated Series with AR(1) model Generated Series with GAR(1) model mean (m³/s*year) 263,568 183,501 258,874
stand. dev. (m³/s*year) 175,737 191,887 250,495
variation coeff. 0,667 1,046 0,968
skewness coeff. -0,033 3,501 1,872
lag-1 autocorrel. coeff. 0,000 -0,017 0,000
Statistical Parameter (Drought magnitude)
Historical Serie Generated Series with AR(1) model Generated Series with GAR(1) model mean (m³/s) 71,832 54,481 78,304 stand. dev. (m³/s) 12,694 22,731 30,312 variation coeff. 0,177 0,417 0,387 skewness coeff. 0,623 -0,383 -0,539
lag-1 autocorrel. coeff. -0,083 -0,043 -0,008
4 CONCLUSIONS
In general, the GAR(1) model was able to satisfactorily reproduce the statistical parameters (mean, standard deviation, etc.) the historical series, when applied to analyzed watersheds. However, as described by Freitas (1995, 2010), this single criterion is not sufficient for analyzing the performance of streamflow generation models to rivers of semiarid regions. In fact, when analyzing the results of reservoir simulation and the reproduction of the characteristics (duration, severity and magnitude) of floods and droughts periods found in the
Braz. J. of Develop., Curitiba, v. 5, n. 10, p. 18267-18281, sep. 2019 ISSN 2525-8761 time series, the GAR(1) model can´t effectively respond to these questions which it is of huge importance to the application of stochastic models in the semiarid intermittent rivers.
REFERENCES
Adeloye, A. J. 1993 Operational assessment of the reliability of single estimates of reservoir
capacity. Extreme Hydrological Events: Precipitation, Floods and Droughts (Proceedings of
the Yokohama Symposium, July 1993). IAHS Publ. no. 213.
Bobée, B., Robitaille, R. 1975 Correction of Bias in the Estimation of the Coefficient of Skewness, Water Resources Research, 11(6), 851-854.
Claps, P., Rossi, F., Vitale, C. 1993 Conceptual-Stochastic Modeling of Seasonal Runoff Using Autoregressive Moving Average Models and Different Scales of Aggregation, Water
Resources Research, 29(8), 2545-2559.
Fernandez, B., Salas, J.D. 1990 Gamma-Autoregressive Models for Stream-Flow Simulation,
Journal of Hydraulic Eng., 116, 11, 1403-1414.
Freitas, M. A. S. 1995 Stochastische Abflussgenerierung in intermittierenden semiariden
Gebieten (NO-Brasilien). Abschlussarbeit Weiterbildendes Studium Bauingenieurwesen,
University of Hannover, Germany.
Freitas, M. A. S. 2010 Que venha a seca: modelos para gestão de recursos hídricos em regiões semiáridas (Drought Risk Analysis: Models for Water Resources Management in Semiarid Regions), 1ª ed., Rio de Janeiro, 413p.
Freitas, M. A. S., Billib, M.H.A. 1997 Drought Prediction and Characteristic in Semi-Arid
Ceará / Northeast Brazil, Symposium “Sustainability of Water Resources Under Increasing
Uncertainty”, IAHS Publ. nº 240, 105-112, Rabat, Marrocos.
Grygier, J. C., Stedinger, J. R. 1988 Condensed Disaggregation Procedures and Conservation Corrections for Stochastic Hydrology, Water Resources Research, 24(10), 1574-1584.
Lawrence, A. J., Lewis, P.A.W. 1981 A New Autoregressive Time Series Model in Exponential Variables NEAR(1), Adv. Appl. Prob., 13(4), 826-845.
Lin, G-F., Lee, F-G. 1992 Multistage Disaggregation Process in Stochastic Hydrology, Water
Resources Management, 6, 101-115.
Loucks, D. P., Stedinger, J. R., Haith, D. A. 1981 Water Resource Systems Planning and
Braz. J. of Develop., Curitiba, v. 5, n. 10, p. 18267-18281, sep. 2019 ISSN 2525-8761 Maass, A., Hufschmidt, M. M., Dorfman, R., Thomas, H. A., Marglin, S. A. & Fair, G. M. 1962 Design of Water Resource Systems, Harvard University Press, Cambridge, Massachusetts.
Martins, E.S.; Braga, C.F.C; Souza, F.A.S.; Moraes, M.M.G.A.; Marques, G.F.; Mediondo, E.M.; Freitas, M.A.S.; Vazquez, V.; Engle, N.L.; De Nys, E. (2013). Adaptation challenges and opportunities in Northeast Brazil. Environment and Water Resources Occasional Paper Series, v. 11, n. 1, p. 1‑6, 2013.
Matalas, N.C. 1966 Time Series Analysis, Water Resources Research, 3(4), 817-829.
Rusteberg, B. and Freitas, M. A. S. 2018. IWRM Implementation in North-East Brazil (Results
from WP 8). In: Abels, A., Freitas, M. A. S., Pinnekamp, J., Rusteberg, B. Bramar Project – Water Scarcity Mitigation in Northeast Brazil, 1. ed. Aachen: Department of Environmental
Engineering (ISA), 2018. v. 1. 155p. ISBN: 978-3-00-059926-2.
Silva, A. T., Portela, M. M. 2011. Generation of monthly synthetic streamflow series based on the method of fragments. WIT Transactions on Ecology and the Environment, Vol 145, 237-247. doi:10.2495/WRM110201.
Sim, C. H. 1987 A Mixed Gamma ARMA(1) Model for River Flow Time Series, Water
Resources Research, 23(1), 32-36.
Svanidze, G.G. 1980 Mathematical Modeling of Hydrologic Series for Hydroelectric and
Water Resources Computations, Water Resources Publications, Fort Collins, Colorado, USA.
Tallaksen, L.M., Madsen, H., Clausen, B. 1996 On the definition and modelling of streamflow drought duration and deficit volume, Hydrological Sciences-]ournal-des Sciences
Hydrologiques, 42(1), 15-33.
Vogel, R. M. 1987 Reliability indices for water supply systems, J. Wat. Resour. Plan.
Manage., ASCE, 113, 563-579.
Vogel, R. M., Stedinger, J. R. 1987 Generalized storage-reliability-yield relationships. Journal
of Hydrology, 89, 303-327.
Wallis, J. R., O´Connell, P.E. 1972 Small Sample Estimation of 1, Water Resources