Received November 12, 2009 and accepted August 6, 2010. Corresponding author: [email protected]
Building consolidated performance indicators for an agribusiness
company: a case study
Adriano Garcia Rosado Júnior1, José Fernando Piva Lobato1, Claúdio Müller2
1PPG- Zootecnia/UFRGS.
2PPG Engenharia de Produção/UFRGS.
ABSTRACT - The objective of this study was to implement an indicator system that allows an overview of the performance at all levels of the company and to evaluate its overall performance using a consolidate general indicator. In the company studied, three business sectors were identified (crops, beef cattle production and viticulture) in addition to management sector, to which strategic objectives were determined. After that, it was mapped the macroprocesses that compose each business activity, a total of 14, and the critical indicators of performance to achieve the objectives, making up 50 indicators whose objectives were definied by the management team. It is possible to build consolidated indicators using the Analytic Hierarchy Process method, which allows weighing the relative importance of the indicators at each hierarchical level, that is, macroprocesses, activities and overall company performance for the achievement of the established goals.
Key Words: management system, multicriteria analysis, process
Construção de indicadores consolidados de desempenho para uma
empresa do agronegócio: um estudo de caso
RESUMO - Esta pesquisa foi realizada com os objetivos de implementar um sistema de indicadores que permita uma visão do desempenho em todos os níveis da empresa e avaliar seu desempenho global por meio de um indicador geral consolidado. Na empresa estudada, foram identificados três ramos de negócio (agricultura, pecuária e vitivinicultura) mais o setor administrativo, para os quais foram determinados objetivos estratégicos. Sequencialmente, foram mapeados os macroprocessos que compõem cada uma das atividades do negócio, num total de 14, e os indicadores críticos de desempenho para o atendimento dos objetivos, perfazendo um total de 50 indicadores, cujas metas foram definidas pela equipe de gestores. É possível a construção de indicadores consolidados utilizando o Analytic Hierarchy Process, o qual permite ponderação da importância relativa dos indicadores em cada nível hierárquico, ou seja, macroprocessos, atividades e desempenho global da empresa em busca dos objetivos traçados.
Palavras-chave: análise multicritério, processos, sistema de gestão
www.sbz.org.br
Introduction
Many companies have been seeking to professionalize their management to survive in the market, increasing the implementation of measurement and control systems using methods that best adapt to their business sector or profile. Those systems, which generate several decision-supporting parameters, often create a situation that company managers have to face: the difficulty of monitoring their business as a whole because of the large number of indicators generated by the control system (Rafaeli & Müller, 2007).
Another aspect that is commonly observed in companies is the lack of clear objectives, making it difficult to prioritize indicators, leading to the loss of focus on the critical results desired by the organizations (Francischini & Cabel, 2003).
Currently, due to the adoption of management tools in agribusiness and to problems caused by managing, a large number of indicators have also emerged. Therefore, a weighing system that considers the relative importance of indicators may help managers to rapidly identify which sectors contribute more significantly to the overall company performance.
This study aimed at building a consolidated performance indicator for agribusiness companies that takes into account the achievement of the proposed strategic goals by using hierarchical analysis as a multi-criteria tool to support decision-making.
Material and Methods
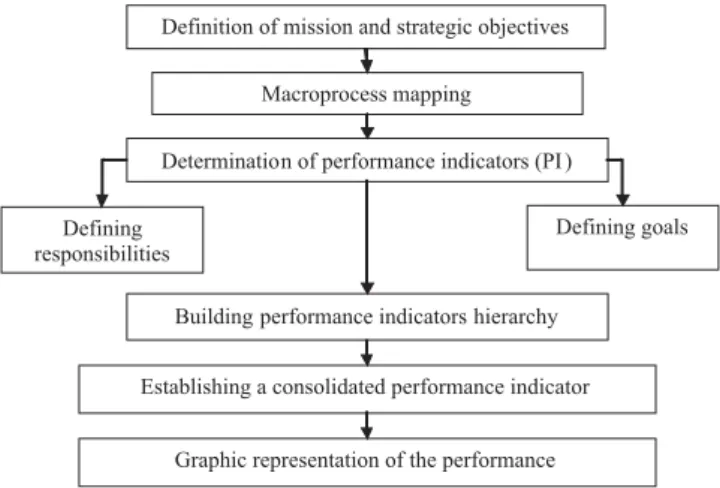
The studied company is classified as a family company and produces beef cattle, irrigate rice (main crop activity), soybeans, corn, sorghum, and more recently, viticulture as a diversification option based on the climate and soil peculiarities of the region. It is located in the south of the state of Rio Grande do Sul, Brazil, and its objective is to “generate agricultural products in an optimized, sustainable, and diversified manner, taking advantage of the natural resources and the aptitudes of the Campanha region in the state of Rio Grande do Sul.” The company was selected because of its very diverse activities and high level of control applied over its processes. In addition, studies for the implementation of process management based on management systems of the company were previously carried out in the company (Rosado Júnior & Lobato, 2009). The method was adapted from the model proposed by Albano et al. (2006). The hierarchical structure was divided in three levels: business, activity, and macroprocess (Figure 1). Macroprocesses were mapped and their critical indicators and respective goals were determined together with the
company board of directors. Defining responsibilities to the control of the indicators is complementary and very important, and it must be carried out during the operational phase of the control.
The establishment of a consolidated performance indicator requires solutions to circumvent certain problems, such as aligning measurement units of the indicators of the organization and attributing the relative importance of these indicators to the achievement of the goals of the company. The first problem was solved with the introduction of the concept of percentage difference between achieved and aimed performance (Francischini & Cabel, 2003). Rafaeli & Müller (2007) added to the method the possibility of working with “lower is better” indicators, such as cost indicators, with deviation of the meaning of the result when a value lower than the established goal is obtained (Figure 2).
This allows eliminating individual units to express indicators obtaining a score that can be used in an unified Figure 1 - Flowchart of the proposed method.
manner by using Equation 1 for situations where ‘higher is better’ and Equation 2 when “lower is better”.
Is= Iav / Igv (1)
Is= (Igv – Iav) / Igv + 1 (2)
in which: Is = indicator score; Iav = indicator actual value; Igv = indicator goal value.
Prioritization was solved by using the multi-criteria decision-making methods, as reported by Francischini & Cabel (2003) and Rafaeli & Müller (2007). According to Ribeiro & Costa (1999), quoted by Wernke & Bornia (2001), the Analytic Hierarchy Process (AHP) method is a multi-criteria decision-making methodology that aims at providing simple solutions to complex choice problems. This method is based on three principles of analytical thinking: a) building hierarchies – in AHP, the problem is decomposed in hierarchical levels in order to obtain better understanding and assessment; b) establishing priorities – in AHP, this is based on the ability of perceiving the relationship among objects and observed situation by pair-wise comparison under the perspective of a determined focus, criterion, and pair judgment; and c) logical consistency – in AHP, the built prioritization model can be evaluated for its consistency. The basic process of AHP application consists on prioritizing the relative importance of n decision-making
elements relative to a goal by making partial evaluations of pairs of elements, thereby making their analyses easier. In the present study AHP was applied according to the proposal of Saaty (1990), starting by the problem definition and determination of the objectives of the application of the method. Then, a hierarchy was established, starting from the main objective, going through evaluation criteria down to the lowest hierarchical level. Subsequently, a “n × n”
matrix was built, starting at the lowest hierarchical level and comparing the importance of each pair of alternatives relative to level immediately above. The parameters for pair-wise comparison followed a 1-9 scale, where: 1 = not a priority; 2 = no to moderate priority; 3 = moderate priority; 4 = moderate to high priority; 5 = high priority; 6 = high to very high priority; 7 = very high priority; 8 = very high to utmost priority; 9 = utmost priority.
Therefore, n(n –1) evaluations of each matrix were
required to compare all possible pairs inasmuch as the inverse assessments among items are automatically
designated. Then, the relative importance of each matrix element was calculated by eigenvectors with the highest eigenvalues (Teknomo, 2006). Eigenvector components establish the priority levels of each element, and the highest eigenvalue (λmax) is used to measure consistency index,
according to Equation 3:
CI=(λmax – n)/(n – 1) (3)
in which: CI = consistency index; λmax = highest
eigenvalue; n = number of matrix elements
Once the random index is calculated, judgment consistency rate is obtained by Equation 4, using an average random index estimated according to the number of matrix elements (Table 1):
CR= CI / RI (4)
in which: CR = consistency rate; CI = consistency index;
RI = average random index.
The above described method was performed using the software program “Expert Choice”. Whenever the
calculated consistency rate (software output) was lower than 0.1, the consistency of the evaluations was considered adequate, and the result was validated. Otherwise, “n × n”
evaluations were performed again. This procedure was repeated for all decision hierarchical levels.
All evaluations were made by one member of the technical team and managers of the company, differently from Amaral et al. (2007), who used the opinion of external consultants to define the best production setup to increase the satisfaction of beef cattle producers in the region of Betim, Minas Gerais, using the method of hierarchical analysis.
Once the relative importance of each indicator within macroprocesses was known, the consolidated indexes were calculated by multiplying the performance indicator index in the period by the prioritization index attributed by AHP to the indicator. Then, the consolidated partial performance indicator was obtained for each macroprocess, evidencing its performance/contribution for the overall company result. The algorithm was repeated in the higher hierarchical levels using the consolidated partial performance indicators of the macroprocesses multiplied by their indexes of importance for the business, thereby obtaining the consolidated overall performance indicator.
Matrix size 1 2 3 4 5 6 7 8 9 1 0
Random index 0 . 0 0 . 0 0.58 0.90 1.12 1.24 1.32 1.41 1.45 1.49
Results and Discussion
After hierarchical levels were established, four business activities were identified: three production activities (crops, beef cattle production, and viticulture), and one that included company management activities, called management activity. Also, 14 macroprocesses mapped in different activities were also identified (Figure 3).
Strategic goals were established for the agricultural year for the four activities, as follows: a) crops: a.1) to increase rice productivity, a.2) to increase the production of certified seeds, and a.3) to increase corn and sorghum production; b) beef cattle production: b.1) to increase the number of finishers in high-value market niches, b.2) to increase beef production (kg/ha), b.3) to increase sire sales volume while maintaining sales price, and b.4) increase sire differentiation in association to an expansion of the competitive scope to a broader market; c) viticulture: c.1) to obtain the highest bonus for quality in grape sales, c.2) to convert 60% of grape production into wine, c.3) to sell 90% of annual wine production, c.4) to classify the company wine among the 30% best wines in the National Wine Evaluation (Avaliação Nacional de Vinhos – ANV), and c.5) to obtain awards in 50% of the international events where the company participates; and d) management: d.1) to increase the qualification level of operational employees and d.2) maintain accounting (fiscal and management) data updated.
Fifty key performance macroprocess indicators were considered by the company board as highly correlated with the achievement of the strategic goals proposed for each activity.
Crops were the activity with the heaviest weight in the business (49%), followed by beef cattle production (34%). This result is related to the fact that crops use only 30% of the land, but contributes with 50% of the income and allows the use of more technology in beef cattle production by integrating resources, such as machinery and human resources. Viticulture, because it is still at its beginning, was the activity with the least impact on overall results (4%), as shown on the weight given by the managers (Figure 4).
For crops, the macroprocess rice production has the highest priority (60.7%), demonstrating its importance for the business inasmuch as its production indicator was considered more critical than the quality of the grains produced, represented by the percentage of rice classified within “standard 417”. This was a result of the perception of the managers that the price received for quality still does not compensate the lower productivity of rice varieties that produce better quality grains (Table 2).
In beef cattle production, feedstuff production was the macroprocess with the greatest weight (41.3%). The dependence of highly intensive systems, such as that developed by the company (Beretta et al., 2002; Pilau & Lobato, 2008; Vaz & Lobato, 2010), on the production of good quality forages justified the priority of the indicator number of pasture hectares established per year (Table 3). In viticulture, winemaking macroprocess had significantly higher weight when compared to grape production, whose final result is the sales of fresh grapes, showing the importance of adding value to grape production through wine making (Table 4). This strategy aims at increasing the profitability of the company and consolidating its name in the domestic and international market as a producer of high-quality fine wines. The most important indicators to achieve the goals of this activity are the wine-making percentage and production percentage sold in the market.
Activity priority Macroprocess Macroprocess priority Indicator Indicator priority in
for the business for the activity the macroprocess
Rice production 0.607 % classified as standard 417 0.11
Gross margin on production costs (%) 0.48
Rice productivity (kg/ha) 0.41
Seed production 0.054 % of value added 0.17
% of approved batches 0.83
0.49 Soybean production 0.052 Soybean planted area 0.07
Gross margin on production costs (%) 0.64
Soybean productivity (kg/ha) 0.28
Corn production 0.231 Corn productivity (kg/ha) 0.12
Corn production cost (% margin) 0.55
Irrigated corn area (ha) 0.33
Sorghum production 0.056 Sorghum productivity (kg/ha) 0.26
Sorghum production cost (%margin) 0.63
Sorghum area (ha) 0.11
Table 2 - Prioritization of crop indicators
Activity priority Macroprocess Macroprocess priority Indicator Indicator priority in
for the business for the activity the macroprocess
Feedstuff production 0.413 Number of fertilized ha/year 0.09
Number of established pasture ha/year 0.77
Tons available corn/sorghum 0.14
Production of finishers 0.215 Gross margin per ha (R$) 0.57
Percentage animals sold to niche markets 0.07 Productivity – beef (kg/ha/year) 0.36
Production of pasture seeds 0.029 Ryegrass productivity (kg/ha) 0.63
Birdsfoot trefoil productivity (kg/ha) 0.26 White clover productivity (kg/ha) 0.11
0.34 Calf production 0.215 Cow body condition score at calving (1-5) 0.06
Cow body condition score beginning of 0.12 the breeding season (1-5)
Weaning rate 0.30
Pregnancy rate 0.47
Average calf weaning weight (kg) 0.05
Production of sires 0.127 Gross margin per sire (R$) – cost % 0.10
Number of sires sold per year 0.23
Percentage of new sire customers (portfolio %) 0.05 Percentage of sire customer retention 0.15 (portfolio %)
Target weight of 24-month-old sires (kg) 0.24
Awards in breed competitions – 0.03
champion in participating categories (%)
General satisfaction of sire customers (%) 0.19 Table 3 - Prioritization of beef cattle production indicators
Activity priority Macroprocess Macroprocess priority Indicator Indicator priority in
for the business for the activity the macroprocess
Grape production 0.167 Sugar concentration (Babo degrees) 0.37
Operational cost per produced kg 0.04
0.04 Health index 0.46
Gross margin/ha 0.12
Winemaking 0.833 % of the annual production sold 0.58
% awards 0.25
Classification in ANV 0.09
Margin/produced bottle 0.09
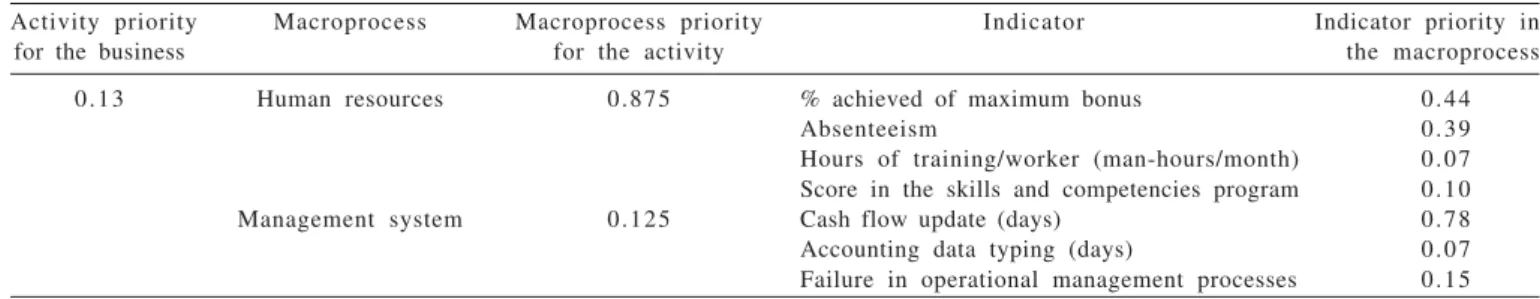
In the management activity, prioritization reflects the awareness of the managers that, in order to achieve the goals of this activity, human resources require special attention (Table 5). The company has an in place evaluation system that awards employees for their performance (bonus) according to an assessment made by the team supervisors. It was then decided to use performance bonus percentage relative to the highest possible bonus as the indicator with the highest weight in the human resources macroprocess, assuming that this percentage indicates the quality of the performed processes. On the other hand, in order to evaluate team performance, this method also indirectly evaluates employee selection and training programs, which are under the responsibility of the manager.
When the importance of all indicators was classified by multiplying priority indexes at all levels, it was observed that the first 20 indicators (40% of the total number) respond for 85% of the “responsibility” of achieving the company goals (Figure 5), and therefore, the indicators of the rice production macroprocess come first, followed by the main indicator of beef cattle production, which is monitoring pasture establishment.
Activity priority Macroprocess Macroprocess priority Indicator Indicator priority in
for the business for the activity the macroprocess
0.13 Human resources 0.875 % achieved of maximum bonus 0.44
Absenteeism 0.39
Hours of training/worker (man-hours/month) 0.07 Score in the skills and competencies program 0.10
Management system 0.125 Cash flow update (days) 0.78
Accounting data typing (days) 0.07
Failure in operational management processes 0.15 Table 5 - Priorities of the indicators of management activity
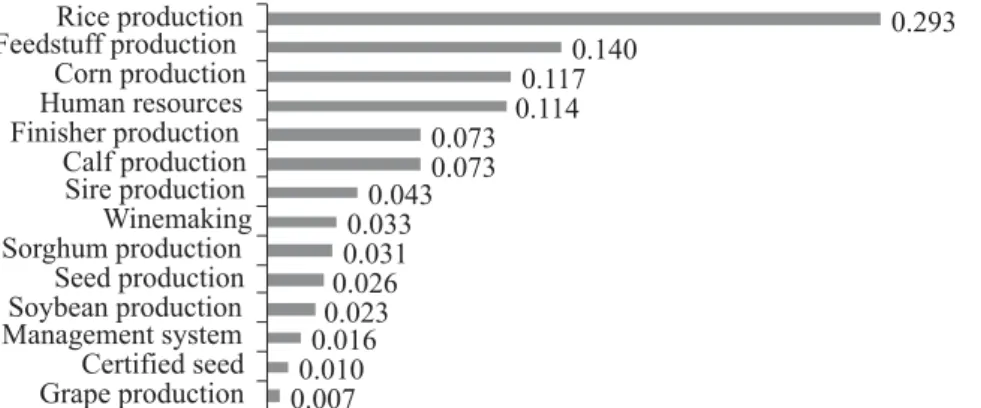
In the general prioritization of macroprocesses in the business, in addition to the marked position of rice, the importance of feedstuff production is also stressed. Despite being a way of generating beef cattle products, its priority was higher than the final products of this activity (Figure 6). The opposite occurred for the production of grapes, which are the raw materials for wine making, but are also considered by the managers as a product that can be traded, differently from most feedstuffs used in beef cattle production, particularly in the case of pastures. Sire production, despite its relevance and tradition in the company, currently, according to the prioritization performed, has lower priority than animal production.
Corn and sorghum production are considered important macroprocesses inasmuch as they generate flexible products for the business because they can be both directly sold or be used as inputs in beef cattle production. When directly compared, corn was prioritized over sorghum because the company has central-pivot irrigation systems, which provide higher corn production safety, with advantages in productivity, nutritional value, and trade relative to sorghum.
Soybeans presented low priority for the business as the region is considered marginal for the production of this grain owing to the low rainfall during the planting period. Therefore, soybeans are strategically used by the company as a tool for pasture renewal.
Once priority values of all hierarchical levels were obtained by AHP, it was possible to build consolidated partial and overall performance indicators from simulated performance data of the 50 previously chosen indicators. This allowed to clearly see the performance of the hierarchical levels (macroprocess, activity, and business) and their individual contribution to the overall company result (Table 6). This integrated overview of performance provided by the consolidated performance indicator adds information to the traditional monitoring systems, such as the Balanced Score Card, proposed by Kaplan & Norton (1997) and tested in agribusiness by Oliveira Neto et al. (2007) and Brisolara (2008). Therefore, consolidated performance
indicators can be used a complementary tool –not as a replacement – of other methods, inasmuch as one of its prerequisites is the establishment of a group of indicators that are closely linked to the goals and main objectives of a company.
The generation of a consolidated performance indicator is a step further in the prioritization of processes and/or activities of a business through hierarchical analysis, as carried out by Amaral et al. (2007), because it also allows monitoring the established goals as a whole.
When establishing a consolidated indicator, caution must be taken not to allow the good results of important indicators to hide the mediocre results of less relevant indicators. The determination of a minimal independent level of performance may aid this task. In order to maintain the system updated, both critical indicators and their priority levels need to be reviewed whenever new strategic objectives are determined.
Activity Macroprocess Consolidated partial Macroprocess Consolidated partial Activity Consolidated performance indicator priority in performance process in performance macroprocess the activity indicator activity the business indicator business
Beef cattle Feedstuff production 0.91 0.413 0.98 0.340 0.93
production Calf production 1.06 0.215
Finisher production 1.02 0.215
Sire production 1.06 0.127
Pasture seed production 0.78 0.029
Crops Rice production 0.88 0.597 0.90 0.489
Soybean production 0.76 0.046
Corn production 0.94 0.238
Sorghum production 1.01 0.064
Seed production 1.06 0.054
Viticulture Grape production 0.92 0.167 0.85 0.044
Wine 0.84 0.833
Management Human resources 0.94 0.875 0.94 0.126
Management system 0.98 0.125
Conclusions
The studied company has many diverse and integrated activities that make the management and monitoring of the processes that influence the achievement of proposed goals very complex. The technique of building consolidated performance indicators using the Analytic Hierarchy Process is efficient to develop a system that easily identifies the performance in hierarchical levels, and also allows the evaluation of the overall performance. The method can be used to complement other existing indicator systems in the company.
References
ALBANO, F.M.; JORNADA, D.H.; ALBANO, J.F. Aplicação e validação de uma sistemática para o desenvolvimento e implementação de um sistema de indicadores de desempenho. In: SEPROSUL - SEMANA DE ENGENHARIA DE PRODUÇÃO SUL-AMERICANA, 6., 2006, Florianópolis. Anais... Florianópolis, 2006. v.6, p.1-11.
AMARAL, J.F.S.; SILVA, J.T.M.;TEIXEIRA, L.A.A. Aplicação do Processo Analítico Hierárquico como suporte à decisão na produção bovina de corte na região de Betim/MG. Contabilidade Vista & Revista, v.18, n.3, p.133-159, 2007.
BERETTA, V.; LOBATO, J.F.P.; NETTO, C.G.M. Produtividade e eficiência biológica de sistemas de produção de gado de corte de ciclo completo no Rio Grande de Sul. Revista Brasileira de Zootecnia, v.31, n.2, p.991-1001, 2002.
BRISOLARA, C.S. [2008]. Balanced Scorecard em uma propriedade pecuária. In: CONGRESSO DA SOCIEDADE BRASILEIRA DE ECONOMIA, ADMINISTRAÇÃO E SOCIOLOGIA RURAL, 46., 2008, Rio Branco. Anais eletrônicos... Rio Branco:
Sociedade Brasileira de Economia, Administração e Sociologia Rural. Disponível em: <http://www.sober.org.br/palestra/9/ 967.pdf>. Acesso em: 5/5/2010.
CANZIANI, J.R.F. Assessoria Administrativa a Produtores Rurais no Brasil. 2001. 224f. Tese (Doutorado em Ciências –
Economia Aplicada) - Escola Superior de Agricultura Luiz de Queiroz/Universidade de São Paulo, Piracicaba.
FRANCISCHINI, P.G.; CABEL, G.M. Proposição de um indicador geral de desempenho utilizando AHP. In: ENCONTRO NACIONAL DE ENGENHARIA DE PRODUÇÃO, 2003, Ouro Preto. Anais... Ouro Preto: Universidade Federal de Ouro Preto, 2003. (CD-ROM). KAPLAN, R.S.; NORTON, D.P. A estratégia em ação: balanced
scorecard. 5.ed. Rio de Janeiro: Campus, 1997. 360p. OLIVEIRA NETO, O.J.; DREES, C.; SOUZA, E.M.S. et al. [2007.]
Balanced Scorecard: indicadores e medidas de desempenho aliados a gestão estratégica na bovinocultura de corte. In: CONGRESSO DA SOCIEDADE BRASILEIRA DE ECONOMIA, ADMINISTRAÇÃO E SOCIOLOGIA RURAL, 45., 2007, Londrina. Anais eletrônicos... Brasília: Sociedade Brasileira de Economia, Administração e Sociologia Rural. Disponível em: <http:// www.sober.org.br/palestra/6/54.pdf>.Acesso em: 15/5/2010. PILAU, A.; LOBATO, J.F.P. Manejo de novilhas prenhes aos 13/15
meses de idade em sistemas a pasto. Revista Brasileira de Zootecnia, v.37, n.7, p.1271-1279, 2008.
RAFAELI, L.; MÜLLER, C.J. Estruturação de um índice consolidado de desempenho utilizando o AHP. Gestão e Produção (UFSCar), v.14, p.363-377, 2007.
RIBEIRO, A.C.; COSTA, H.G. Emprego do método de análise hierárquica (AHP) na distribuição de custos indiretos: uma proposta para a pequena e média empresa. In: ENCONTRO NACIONAL DE ENGENHARIA DE PRODUÇÃO, 19., 1999, Rio de Janeiro. Anais... Rio de Janeiro: UFRJ, 1999. (CD-ROM). ROSADO JÚNIOR, A.G.R.; LOBATO, J.F.P. Application of a model of management by macroprocesses to a beef cattle enterprise: a case study. Revista Brasileira de Zootecnia, v.38, n.11, p.2280-2288, 2009.
SAATY, T.L. How to make a decision: the analytic hierarchy process. European Journal of Operational Research, v.48, p.9-26, 1990.
TEKNOMO, K. [2006]. Finding eigen value of symmetric matrix using Microsoft Excel. Disponível em: <http:// people.revoledu.com/kardi/tutorial/Excel/EigenValue.html>. Acesso em: 15/04/2010.
VAZ, R.Z.; LOBATO, J.F.P. Efeito da idade do desmame no desenvolvimento de novilhas de corte até os 14/15 meses de idade.