Revista
www.geama.ufrpe.br
________________________________________________________________________________________________________________________
Geotechnologies in mapping on land use and cover in agricultural watershed
Suzana Costa Wrublack1, Erivelto Mercante2, Marcus Metri Correa3*, Victor Hugo Rohden Prudente4,Jefferson Luiz Gonçalves Silva5 and Marcio Antonio Vilas Boas6
1Campus Francisco Beltrão, Universidade Tecnológica do Paraná, Francisco Beltrão, Brasil.
2,6Centro de Ciências Exatas e Tecnológicas, Universidade Estadual do Oeste do Paraná, Cascavel, Brasil.
3Departamento de Tecnologia Rural, Universidade Federal Rural de Pernambuco, Recife, Brasil.*marcus.metri@gmail.com 4Pós-Graduação em Sensoriamento Remoto, Inst. Nacional de Pesquisas Espaciais, São José dos Campos, Brasil.
5Centro Internacional de Hidroinformática, Fundação Parque Tecnológico Itaipu, Foz do Iguaçu, Brasil. Artigo recebido em 14/01/2017 e aceito em 25/02/2017
ABSTRACT
Through the use of geotechnologies many surveys can be performed with data processing as geographical and environmental variables, resulting in new information and products and providing a detailed study about an specific area. This paper’s objective is present a case study example where visual classification appears as an opportunity for mapping heterogeneous areas, especially in agricultural zones occupied by small rural properties classified as family. This mapping type presents advantages to the automatic classifiers, since the heterogeneity of small areas can cause pixels miscellany, damaging the classification results. This study was performed in Salto do Lontra’s watershed, located in Paraná’s southwestern, Brazil. Images from Google Earth, obtained in 2014, were used for a visual classification, with 8 regions of interest (ROIs). For a supervised classification Landsat-8 images were used, path/row 223/78, acquired in 02/12/2013. The classifier applied was Spectral Angle Mapper (SAM) with 5 ROIs. Using such type of technologies, what is expected is that these can provide a broader view over environmental reality, allowing the recognition of different surface features and enabling a correct land management based on adequate information.
Keywords: geographical area, georeferenced information, land use, management tools
Geotecnologias no mapeamento do uso e cobertura do solo Na bacia
hidrográfica agrícola
RESUMO
Através do uso de geotecnologias, muitas pesquisas podem ser realizadas com o processamento de dados como variáveis geográficas e ambientais, resultando em novas informações e produtos e fornecendo um estudo detalhado sobre uma área específica. O objetivo deste trabalho é apresentar um exemplo de estudo de caso onde a classificação visual aparece como uma oportunidade para mapear áreas heterogêneas, especialmente em zonas agrícolas ocupadas por pequenas propriedades rurais classificadas como familiares. Este tipo de mapeamento apresenta vantagens para os classificadores automáticos, uma vez que a heterogeneidade de pequenas áreas pode causar miscelânea de pixels, prejudicando os resultados da classificação. Este estudo foi realizado na bacia hidrográfica de Salto do Lontra, localizada no sudoeste do Paraná, no Brasil. As imagens do Google Earth, obtidas em 2014, foram utilizadas para uma classificação visual, com 8 regiões de interesse (ROIs). Para uma classificação supervisionada utilizaram-se imagens Landsat-8, caminho / linha 223/78, adquiridas em 02/12/2013. O classificador aplicado foi o Módulo de ângulo espectral (SAM) com 5 ROIs. Usando esse tipo de tecnologias, o que é esperado é que estes podem fornecer uma visão mais ampla sobre a realidade ambiental, permitindo o reconhecimento de diferentes recursos de superfície e permitindo um gerenciamento correto da terra com base em informações adequadas.
Introduction
Geotechnologies include the study of geographical space and its environmental aspects, which can be easily and quickly provided by technology advance. A research development, an action planning, a management process and other studies related to geographical space where the objective is the same, working directly with spatial issues in different areas of knowledge, it becomes essential to interdisciplinary (Fitz, 2008). They denote an use of different techniques and tools that enable processing
of georeferenced information, where the
geographical location attribute is essential and guide all processes comprehension, procedures, analysis and other techniques intended for the georeferenced information processes. As a tool capable to provide systematic information, geotechnology represents an important strategy and can offers valuable contributions, especially by the periodicity, storage capacity, data processing and cross-checks, making possible a data acquisition from large areas with a quickly and effective way, allowing a better
exploration on different approaches and
performances, as a support task, contributing to a
planned and sustainable environmental
management (García et al., 2013; Zanardo et al., 2016).
Geotechnology encompasses tools with enormous potential to process spatial data as an instrument to support management and decision making. It allows the manipulation and organization of large volumes of spatial and tabular data and information, making it possible to obtain new interpretive information (Gusmão et al., 2016).
The environmental monitoring at the watersheds spots seeks to analyze relevant aspects to characterize the changes that occur in the land use and occupation, making it possible to evaluate the effects of human activities on ecosystems (BERTOSSI et al., 2013). The water resources management on a small watershed has been showed as a growing interest subject, especially in agricultural areas, which represent the largest volume of water needed, when compared to industrial and home activities. Also, obtaining such accurate information has been a critical need in water resources management (Folhes et al., 2009).
The ability to measure land use and cover patterns, considering the coverage scale, has increased significantly, especially with the advancement of remote sensing methods and new analytical techniques development using GIS and Spatial Statistics. In Brazil, the adoption of these tools in natural resources management has been
promoted in order to incorporate a strategy that includes planning, monitoring, controlling and, this way, helping management decisions.
This study aimed to contribute about applying geotechnologies for land use mapping in an agricultural watershed and about environmental space studies, focusing on the contribution of this tools in water resources management.
Materials and Methods
This study was conducted in Rio da Lontras's watershed, located on Paraná's southwestern in Brazil. A visual classification was processed using mosaicked images from 2014, obtained from Google Earth. This process was executed with the QGIS 2.0 Dufour, an opensource GIS software. Also, for supervised classification, a Landsat-8 image was used, with path/row 223/78 and date acquitition from 12/02/2013. The supervised classification method adopted was the Spectral Angle Mapper (SAM) for mapping land use and cover. After the classifications, all information generated was processed for thematic maps generation in a GIS enviroment. For these processes we used the ArcGIS 9.3 - ESRI software. Using a GIS requires a georeferenced database and all data management occurs through a Database Management System, which made able relate a data to each other. How the
database structure comprising spatial an
alphanumeric data, spatial data can be spatially represented, in a vector or matrix structure.
To characterize the land use and cover in Rio das Lontras's watershed, mosaics were prepared using satellite images from Google Earth, which were georeferenced according the base map from Salto do Lontra and Nova Esperança do Sudoeste, two cities located in the state of Paraná. For this analysis, considering a visual classification, was generated a thematic map with the land use and cover in the watershed. In this type of classification, the vector structure is composed by points, lines and polygons, using a coordinate system for its representation. The points are represented by one coordinate pair, the lines and polygons are represented by a set of coordinate pairs.
Using a Landsat-8 satellite image a supervised classification was performed, process that requires a prior knowledge about target classes. This prior knowledge was necessary to enable the analyst to define the regions of interest which directed the image classification. How the algorithm needed to be trained before be able to distinguish one specific class among the other, was necessary collect on the field, according the study area, some information
about such type of land use and cover. After that, small sample areas were selected in the image, containing representative pixels with patterns or features that were the same as the targets. So, five thematic classes were defined: temporary crops, pasture, forest, water and urban areas. The data structure was represented by a matrix rows and columns, where each cell, called pixel, has a value which can indicate, for example, a color or gray tone assigned to it (Fitz, 2008).
Results and Discussion
<Mapping land use and cover through a visual image classification
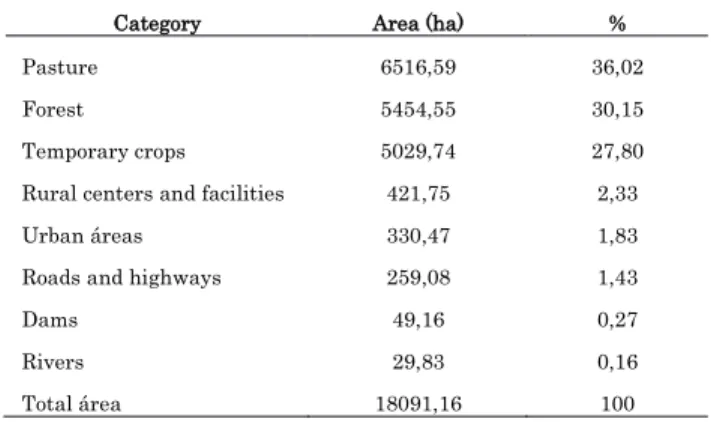
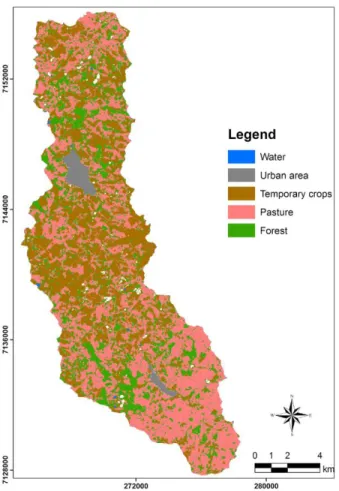
In Figure 1 shows the land use and cover map containing the respective categories obtained through visual classification using the Google Earth's mosaic. Table 1 contains the covery percentage according each category defined.
Figure 1 - Land use in Salto do Lontra's watershed. Mapping obtained by visual classification on satellite images
The areas occupied by pasture and forest have the highest cover percentage on the map, followed by areas with temporary crops where predominate soybean, corn, tobacco and horticulture. Corn and soybeans deserve special attention in an agroecosystem context because they represent a serious threat to ecosystems when inadequate soil management practices are used, contributing to increase risk of soil erosion, and when fertilizer and defensives are applied excessively, constituting an scattered source of water pollution, especially by nitrogen and phosphorus.
Table 1 – Land use categories (ha) in Salto do Lontra’s watershed, obtained by visual classification on satellite images
Category Area (ha) %
Pasture 6516,59 36,02
Forest 5454,55 30,15
Temporary crops 5029,74 27,80
Rural centers and facilities 421,75 2,33
Urban áreas 330,47 1,83
Roads and highways 259,08 1,43
Dams 49,16 0,27
Rivers 29,83 0,16
Total área 18091,16 100
Mapping land use and cover through a supervised image classification
In Figure 2 is shown the thematic map resulted from the supervised classification by SAM (Spectral Angle Mapper) classifier on Landsat-8 image and Table 2 shows the respective percentages for each thematic class in Salto do Lontra's watershed.
The supervised classification on a Landsat-8 image brought the largest category of land use as the areas covered by pasture with 48.69% of total area. The second highest cover was represented by the temporary crops with 25.15% and then came forests with 22.82%.
Visual classification of Google Earth images allowed identify a greater number of land use categories when compared to the supervised classification in a Landsat-8 image. This happened due the image resolution and because the study area was heterogeneous (Wrublack et al., 2013).
The visual classification is an interesting option for land use mappings and must be supported with a prior knowledge about the area by the professional who will execute the process. Noteworthy is the ease of performing this type of mapping, combined with the relatively affordable cost.
Figure 2 - Land use in Salto do Lontra's watershed. Mapping obtained by supervised classification on satellite images
Table 2 – Land use categories (ha) in Salto do Lontra’s watershed, obtained by supervised classification on satellite images
Category % Pasture 48,69 Temporary crops 25,15 Forest 22,82 Urban areas 3,13 Water 0,21 Total area 100,00
Although the visual classification can be widely used, there is a tendency to use supervised and unsupervised classifications, as a computational classification approach, due the quickly and easily way to obtain mapping results with the possibility of carrying out complex operations in GIS. These methods aim to associate each pixel from a image to a class or category, based on statistical characteristics of grayscale pixels.
Supervised classification requires a greater knowledge from the professional who will define the
of "pure pixels" to increase the chances of success on a classifying process. Another possibility of image classification is an unsupervised which works grouping targets with similar characteristics and separating groups distincts, using a statistical method for pixels analysis. Thus it is not necessary provide to the classifier prior knowledge about the attributes of the classes related to the scene.
The choice of classification method (visual, supervised or unsupervised) to be used to map Earth's surface areas, should take into account the advantages and disadvantages that each method can offer. Also need to be considered the researcher's interest in the information which can be extracted. From this perspective, geotechnologies have allowed the study of geographical space and environmental aspects which can be worked more agile, easily and quickly with new technologies (Fitz, 2008).
Using geotechnologies is a way to systematize, analyze and represent data that contain georeferenced information and serve to implement water management tools. Through the intersection and superposition of georeferenced data in a digital database, these tools have been used in computer processes and simulations, assisting environmental
Conclusions
Especially about land use and occupation, geotechnologies allows to analyze the form that they occurs, detecting possible interference arising from human presence on site.
Geotechnologies are a breakthrough for environmental monitoring and land management, allowing a faster and accurate diagnoses with thematic maps associated to qualitative and quantitative information.
Over Rio das Lontras watershed, the use of satellite images allowed the detailed reconnaissance about study area and can serve as a support tool for natural resources management. Including other meteorological variables, water quality parameters and soil properties, it can broaden the chances of understanding and establishing recommendations for a sustainable use of the area.
Acknowledgements
To CAPES, CNPq and Ministry of Science, Technology and Higher Education for financial support.
References
BERTOSSI, A.P.A.; CECILIO, R.A.; NEVES, M.A.; GARCIA, G.O. Qualidade da água em
microbacias hidrográficas com diferentes
coberturas do solo no sul do Espírito Santo. Rev. Árvore [online], v. 37, p. 107-117, 2013.
<http://dx.doi.org/10.1590/S0100-67622013000100012 >.
FITZ, P. R. Geoprocessamento sem complicação. São Paulo: Oficina de Textos, 2008. 160p.
FOLHES, M.T.; RENNÓ, C.D.; SOARES, J.V. Remote sensing for irrigation water management in the semi-arid Northeast of Brazil. Agricultural Water Management. 96 p. 1398 – 1408, 2009. < http://dx.doi.org/10.1016/j.agwat.2009.04.021 >. GARCÍA, M.; SANDHOLT, I.; CECCATO, P.;
RIDLER, M.; MOUGIN, E.; KERGOAT, L.; MORILLAS, L.; TIMOUK, F.; FENSHOLT, R.; DOMINGO, F. Actual evapotranspiration in drylands derived from in-situ and satellite data:Assessing biophysical constraints. Remote Sensing of Environment, (131), 103-118, 2013. < http://dx.doi.org/10.1016/j.rse.2012.12.016 >. GUSMÃO, L.H.A.; HOMMA, A.K.O.; WATRIN, O.S.
Análise cartográfica da concentração do cultivo de mandioca no estado do Pará, Amazônia brasileira. Geografia, Ensino & Pesquisa, v. 20, p.
51-62, 2016. http://dx.doi.org/
10.5902/2236499420962.
WRUBLACK, S. C.; MERCANTE, E.; VILAS BOAS, M. A. Water quality parameters associated with soil use and occupation features by Thiessen polygons. Journal of Food, Agriculture & Environment, vol. 11, n. 2, p. 846-853, 2013. ZANARDO, F. H.; RODRIGUES, R. A. F.; SILVA, H.
R.; MARQUES, A. P. FARIA, G. A. Geotechnology application for data acquisition for agricultural and environmental management of the municipality of Vitória Brazil-SP. Eng. Agríc. [online], vol. 36, n. 4, p. 684-695, 2016.