UNDERSTANDING THE MOBILE HOSPITALITY SERVICES
ADOPTION: A UTAUT2 AND PERCEIVED VALUE
APPLICATION IN A HOTEL CONSUMER CONTEXT
António Pedro da Cruz e Silva Estorninho
Project submitted as partial requirement for the conferral of Master in Business Administration
Supervisor:
Prof. Paulo Rita, Professor Catedrático, ISCTE Business School, Departamento de Marketing, Operações e Gestão Geral
Co-supervisor:
Prof. Tiago Oliveira, Professor Assistente, Instituto Superior de Estatística e Gestão de Informação
ii U N D ER ST A N D IN G TH E MOB ILE H O SP ITA LITY SE R V IC ES A D O PT IO N : A U TA U T2 A N D PE R C EIVE D V A LU E A P PL IC A TION I N A H O TE L C O N SU MER C O N TE X T A ntóni o P edro da C ruz e Sil va E st o rni nh o
iii
Resumo
Com o intuito de atrair os novos utilizadores de tecnologias moveis, algumas cadeias hoteleiras começaram a lançar Serviços Moveis Hoteleiros (SMH). Os SMH, referem-se ao uso de telemóveis como ferramentas de acesso e compra de serviços hoteleiros. Através de aplicações para telemóvel, os hóspedes podem ter acesso a serviços como reserva de quartos, check-in/out, concierge, serviço de quartos e de limpeza. OS SMH permitem aos hóspedes acederem aos serviços dos hotéis de forma rápida, onde e quando quiserem, apenas precisando de uma ligação à internet para desempenharem essas tarefas. Sendo que, a aceitação dos SMH pelos utilizadores é crucial para o sucesso da implementação destes sistemas, é imperioso para os profissionais e académicos, compreenderem os factores que influenciam a adopção dos SMH. Foi então desenvolvido um modelo conceptual que combina a extensão da teoria unificada de aceitação e uso da tecnologia (UTAUT2) com o factor de valor percepcionado, com vista a explicar a intenção de uso e recomendação dos SMH. Para testar o modelo conceitual foram reunidos dados de 348 casos validados, e observou-se que o modelo explica 62 por cento da variação na intenção de uso dos SMH, e 51 por cento da variação na recomendação. Os resultados suportam que a expectativa de performance, expectativa de esforço, condições facilitadoras e o factor valor percepcionado explicam a intenção de uso dos SMH. Por sua vez, a recomendação dos SMH é influenciada pela intenção de uso e pelo factor de valor percepcionadas. As implicações teórico-práticas dos nossos resultados são discutidas.
Palavras-chave: Extensão da teoria unificada de aceitação e uso da tecnologia
(UTAUT2); valor percepcionado; adopção de tecnologias de informação; serviços móveis hoteleiros (SMH)
iv
Abstract
In order to attract new consumers, stay competitive, and increase revenues, some hospitality corporations have started to launch Mobile Hospitality Services (MHS). MHS refer to using cell phones as a tool to access, request, and buy services related to hotels. For this reason we developed a conceptual model that combines the extension of unified theory of acceptance and use of technology (UTAUT2) with perceived value to explain behavior intention and recommendation of MHS. To test the conceptual model we collected data from 348 cases, and found that the model explains 62 percent of the variation in behavior intention to use MHS, and 51 percent of the variation in recommendation. Our findings support the belief that performance expectancy, effort expectancy, facilitating conditions, and perceived value explain behavior intention of MHS. Recommendation of MHS is explained by behavioral intention and perceived value. Theoretical and managerial implications of our results are discussed.
Keywords: Extending the unified theory of acceptance and use of technology
(UTAUT2); perceived value; information technology adoption; Mobile Hospitality Services (MHS)
v Table of Contents Resumo ... iii Abstract ... iv List of Figures ... vi List of Tables ... vi List of Abbreviations ... vi
Sumário executivo ... viii
1. Introduction ... 9
2. Theoretical background ... 10
2.1 Internet and obile technology in the hospitality industry ... 10
2.2 Mobile hospitality services (MHS) ... 11
2.3 Theoretical frameworks of technology acceptance ... 12
2.4 Earlier studies on perceived value ... 13
3. Research model... 14 4. Methods ... 19 4.1 Measurement instruments ... 19 4.2 Data collection ... 19 5. Results ... 21 5.1 Measurement model ... 21 5.2 Structural Model ... 24 6. Discussion ... 27 6.1 Theoretical Implications ... 27 6.2 Managerial Implications ... 28
6.3 Limitations and Future Research ... 29
7. Conclusions ... 30
References ... 31
vi
List of Figures
Figure 1 – Research Model of Venkatesh et al. (2012) ... 13
Figure 2 – Research Model of Wang (2010) ... 14
Figure 3 – Research Model ... 15
Figure 4 – Structural model with path coefficients and r-squares ... 26
List of Tables Table 1 – Demographic data of responses ... 20
Table 2 – Loadings of the measurement model. ... 21
Table 3 – Means, standard deviations, correlations, reliability and validity measures (CR, CA, and AVE) of latent variables ... 23
Table 4 – Structural model results for UTAUT2 and UTAUT2+PercV ... 25
Table 5 – Hypotheses Testing ... 27
Table 6 – The Items ... 36
List of Abbreviations
AVE – Average Variance Extracted
CA – Composite Reliability
CR – Cronbach’s Alpha
GNSS – Global Navigation Satellite System
MHR – Mobile Hotel Reservation
MHS – Mobile Hospitality Services
TAM – Theory of Acceptance Model
TPB – Theory of Planned Behavior
TRA – Theory of Reasoned Action
URL – Uniform Resource Locator
vii
Sumário executivo
A natureza e a dimensão do turismo apresentam claramente um potencial considerável para o uso de novas tecnologias de informação, pelo que não é nenhuma surpresa o facto de a indústria hoteleira estar a enfrentar uma renovação que está, em grande parte, impulsionada pelas tecnologias da informação. Em muitos hotéis, serviços de alta tecnologia já são exigidos e esperados pelos clientes mais sofisticados, o que faz com que a tecnologia gradualmente se esteja a tornar numa fonte crucial de vantagem competitiva sustentável na indústria. É, portanto, um requisito para os gestores hoteleiros tirar proveito das tecnologias da informação e integrá-las de modo a fornecer novos e variados serviços nas suas unidades hoteleiras.
Simultaneamente, a crescente popularidade dos dispositivos móveis, juntamente com a proliferação da internet sem fios, apresenta uma oportunidade para o desenvolvimento de serviços móveis inovadores para as organizações turísticas, que têm aqui, uma possibilidade de aumentar cota de mercado e de melhorar a qualidade percepcionada, por parte dos turistas, dos seus serviços de informação. O comércio feito com recurso a dispositivos móveis, denominado m-commerce, começa a oferecer novos e vantajosos serviços, pois permitem que tanto consumidores como prestadores de serviços construam ligações e negócios a qualquer momento e em qualquer lugar.
Os Serviços Móveis Hoteleiros (SMH) surgem exactamente como resposta à mudança radical provocada no turismo pela rápida evolução das tecnologias de informação. No seu esforço de actualização, as empresas hoteleiras necessitam de assumir uma postura pró-activa na implementação dos avanços tecnológicos, com um esforço continuado de criação de níveis altos de qualidade de serviço e de fidelização de clientes. Os SMH, referem-se ao uso de dispositivos móveis como ferramentas de acesso e compra de serviços hoteleiros tais como reserva de quartos, check-in/out,
concierge, serviço de quartos e de limpeza
Com a introdução dos serviços móveis no turismo, é imperativo que todas as partes envolvidas compreendam as necessidades dos potenciais utilizadores destes serviços. Deste modo, é essencial compreender que factores são relevantes para motivar os clientes na sua intenção de utilizar os SMH. Só desta forma será possivel tomar medidas pró-activas para estimular aqueles que estejam menos inclinados na implementação/uso dos SMH.
viii Este estudo, baseia-se num novo quadro conceptual que explica os factores que influenciam a aceitação dos SMH por parte dos turistas. Para isso, desenvolvemos um modelo conceptual que combina a extensão da teoria unificada de aceitação e uso da tecnologia (UTAUT2) com o factor de valor percebido, para explicar a intenção de uso e recomendação dos SMH. Para testar o modelo, foram recolhidos dados de 348 casos validados, em que constatámos que o modelo explica 62 por cento da variação na intenção de de uso, e 51 por cento da variação na recomendação dos SMH.
Os resultados deste estudo revelam que o valor percebido é um factor determinante que afecta a intenção de uso dos SMH pelos turistas. O foco dos sistemas deverá então estar na qualidade da informação, do serviço e do próprio sistema. Para impulsionar a intenção de uso dos SMH, os gestores devem garantir que o sistema possibilite aos clientes obter informações completas, detalhadas, oportunas, precisas, fiáveis e selectivas, de modo a que respondam às potenciais necessidades dos mesmos.
Os resultados revelam igualmente que tanto as expectativas de desempenho e de esforço, como as condições facilitadoras têm um papel importante na intenção de uso dos SMH. Logo, os gestores hoteleiros devem promover que o sistema é de facto útil para os clientes e, que o esforço que os mesmos possam fazer para o utilizar é claramente inferior aos benefícios que advém do seu uso. Adicionalmente, visto que as condições facilitadoras também devem ser tidas em conta, a facilidade de uso e a compatibilidade das tecnologias deverão ser uma das prioridades. Consequentemente, os gestores devem reunir esforços para criar aplicações móveis que sejam intuitivas, compatíveis com a maioria dos dispositivos móveis e, devem garantir a assistência técnica necessária aos usuários, sempre que necessário.
9
1. Introduction
Although the hospitality industry is not technology oriented by nature, the increasing demands from sophisticated customers and the information-intensive characteristics of the industry are prompting managers to embrace information technologies (IT) to meet present and future business needs (Law et al., 2013). Hoteliers are a perfect example and have responded to the opportunities offered by the Internet to reduce costs and provide real time information to promote and sell their products to consumers (Kim et al., 2006). However, another step has been taken in the era of m-commerce, bringing more mobility and accessibility (Wang, 2010). To stay competitive and increase revenues, hospitality practitioners are starting to develop mobile hospitality services (MHS) to bring the world’s hotels into our hands. The MHS is a form of a m-commerce service, and so is delivered in a more convenient and flexible manner due to the wireless proliferation and limited screen size of mobile devices, allowing clients with mobile phones to access hotel services with just a few clicks whenever and wherever they wish and to gain timely beneficial information services.
As these services gain traction in the tourism domain, it is imperative that application developers and other stakeholders understand the needs of the potential users of these services. Hence, we need to understand what is relevant to clients who intend to use the MHS in order to reach out to those who will be less inclined to implement/use them. Unfortunately, there is very little research reporting the types of services that consumers desire in hotels (Goh et al., 2009). Such information would be very helpful in developing and evaluating mobile hotel applications to match tourist needs and behavior.
This study proposes new variables seeking to determine user attitudes toward using the MHS and, consequently, influencing user intention and willingness to adopt the system. It sits at the crossroads of several sub-streams related to technology acceptance and use research such as, UTAUT (Venkatesh et al., 2003), UTAUT2 (Venkatesh et al., 2012) and the Prospect Theory (Kahneman & Tversky, 1979) and we expect it to make three key contributions. First, by incorporating new constructs and relations into UTAUT2, it expands the overall nomological network related to technology use, which has a greater importance in the hospitality industry since there is a paucity of studies performed on information technologies in hotels (Kim et al., 2008). Second, by aiming to adapt and extend UTAUT2 to include new constructs and altering existing
10 relationships, it takes an important step in advancing theory (Johns, 2006). Finally, from a practitioner standpoint the rich understanding gained can help organizations in the hotel industry to better design technological solutions for their customers.
The paper begins by presenting in the next section the concept of IT in tourism related organizations, the concept of m-commerce, its applicability in hotels, the current mainstream theories that explain customers’ technology acceptance, and the definition of perceived value. The research model is then conceptualized. The paper then presents the research design, methodology, and results. In the end, the results are discussed along with the implications for theory and practice, and further possible research directions are outlined.
2. Theoretical background
2.1. Internet and mobile technology in the hospitality industry
Innovation is at the heart of hospitality organizations (Chang et al., 2011) and innovative mobile services have a huge potential in terms of both increased market share, and tourists’ perceived quality of information and services (Goh et al., 2010). Such services are already fast emerging, and examples include maps, personal navigation systems, location-based mobile guides, booking/reservation services for cars, hotels, airline tickets, and tourist attractions (Werthner & Ricci, 2004). In recent years hotels have been taking advantage of the enormous opportunities generated by the Internet for online promotions and purchases to differentiate themselves from their competitors in the market environment (Bai et al., 2008; Kim & Kim, 2004; Kim et al., 2006).
Tourists appear to be ready for m-commerce. However, Hinze and Buchanan (2005) emphasize that current mobile tourist information systems typically do not consider users’ interests, and argue that such systems should provide user-oriented contextual tourism information. Therefore, there is a need to move from a system-centered design for mobile tourism services, such as hotel services, addressing the quantity and technical superiority of services, to a user-centered approach, addressing what users will actually use (Goh et al., 2010). This is challenging, as an understanding of tourist behavior is required (Fodness & Murray, 1999), including their actual needs (Nielsen, 2004) and the problems they face.
11
2.2. Mobile hospitality services (MHS)
With recent advances in mobile technologies, m-commerce is having an increasingly profound impact on our daily lives. According to Au and Kauffman (2008) m-commerce involves the sale of goods, services, and contents via wireless devices, without time or space limitations. Barnes (2002) defined it as any transaction with a monetary value either direct or indirect that is conducted over a wireless telecommunication network. In terms of business potential, m-commerce offers many promising market opportunities. Offering unlimited information, entertainment, and transactions, m-commerce gives users the ability to access the Internet from any location at any time, the capability to pinpoint an individual user’s mobile terminal location, the functionality to access information at the point of need, and a need-based data and information update capability (Kim et al., 2008).
Verma et al. (2012) revealed that the mobile device innovations recent travelers would most like to see were all applications that are location based, communication based, and hotel services based. Location based innovations include information about directions to, and the ability to make reservations at, local attractions; communication based innovations include text messages or alerts from hotels; and hotel services include the ability to order and schedule, through a mobile phone, housekeeping, room-service, or other hotel complimentary service such as spas, shopping, and video on demand. There is evidence reported in the literature that a great number of hotel services can be enhanced using mobile technology, such as hotel reservation (Wang, 2010), check-in/out (Carlsson et al., 2005), location based services (Carlsson et al., 2005) concierge services (Wang, 2010), and services requests such as room service or extra amenities (Crowell, 2009).
To answer this call hotel managers started to develop MHS as a form of m-commerce. Our definition of MHS comprises three parts. First, it is a location based online service. Second, it is obtained by using a mobile device through wireless Internet and GNSS. Third it is used as a tool to access, request, and buy services related to hotels. In the end this is a mobile technology that provides the hospitality corporations a powerful tool that enables customers a simpler and faster way to order and purchase hotel services.
12
2.3. Theoretical frameworks of technology acceptance
Understanding individual acceptance and use of information technology is one of the most mature streams of information systems research (Venkatesh et al., 2007) and has been the subject of much research, with several theories in recent years that offer new insights in this field (Martins et al., 2014). Some of these studies include the theory of reasoned action (Fishbein & Ajzen, 1975), theory of planned behavior (Ajzen, 1991), theory acceptance model (Davis, 1989), the unified theory of acceptance and use of technology (UTAUT) (Venkatesh et al., 2003), and more recently the UTAUT2 (Venkatesh et al., 2012).
The UTAUT resulted from the combinations of eight theories/models of acceptance technology. Since its original publication, UTAUT has served as a baseline model and has been applied to the study of a variety of technologies in both organizational and non-organizational settings. UTAUT proposes four key constructs (performance expectancy, effort expectancy, social influence, and facilitating conditions) as direct determinants of behavior intention and use behavior. They also introduce moderating constructs (gender, age, experience, and voluntariness of use) which are posited to moderate the impact of the four key constructs on dependent variables.
UTAUT2 extends the earlier model, adapting it by adding constructs and definitions to UTAUT, thereby extending it from an organizational point of view to the consumer point of view. UTAUT2 incorporates three constructs into UTAUT: hedonic motivation, price value, and habit. These constructs are added with the argument that Hedonic motivation, such as enjoyment, is very important in consumer product and/or technology use, and that by integrating it, it complements UTAUT’s strongest predictor, which emphasizes utility. Furthermore, Venkatesh and co-authors argue that by adding a construct related to price/cost, UTAUT2 complements UTAUT’s existing resource considerations, which focus only on time and effort. Finally, integrating habit into UTAUT complements the theory’s focus on intentionality as the overarching mechanism and key driver of behavior. The UTAUT 2 model is shown in Figure 1.
13 .
Figure 1 – UTAUT 2: Research Model of Venkatesh et al. (2012).
Even with the wealth of currently available research involving the TAM, UTAUT, and UTAUT2, the models continue to be explored and improved in new research, which is the case of this study, which expands UTAUT2 into a new consumer context in the hotel industry.
2.4. Earlier studies on perceived value
Customer perceived value plays an important role in customer loyalty (e.g., Kuo et
al., 2013) in predicting purchase and achieving sustainable competitive advantage (e.g.
Bolton & Drew, 1991). Therefore, it has gained much attention in the fields of economics and marketing at both academic and practitioner levels. In the past decade perceived value has been emphasized by researchers in the information technology field to explore and understand users’ adoption of emerging technologies, and by researchers in the the tourism and hospitality field. Both have obtained similar findings indicating that customer perceived value is crucial in attracting and retaining customers (e.g. Hutchinson et al., 2009).
Value is typically described from the consumer’s perspective. The most widely accepted conceptualization of value in marketing defines it in terms of performance/quality and price (Patterson & Spreng, 1997). This means that, usually, when consumers have to make a decision, they often decide by comparing the difference between the sacrifice/costs and benefits. If the benefit is greater than the sacrifice, there comes consumer surplus, which may lead to a purchase decision (Wang,
14 2010). Nonetheless, according to Bolton and Drew (1991), viewing value as a mere trade-off between quality and price is too simplistic. In todays’ modern business society, the seeable cost may not be the main determinant upon which consumers base their final decision, while some other intangible costs like convenience, time, security, and effort spent would be the more crucial factors (Hoyer & Maclnnis, 2003). Ryu et al. (2008, p. 461) describe value as the customer’s overall appraisal of the net worth of the
service, based on the customer’s assessment of what is received (benefits provided by the service), and what is given (costs or sacrifice in acquiring and utilizing the service.
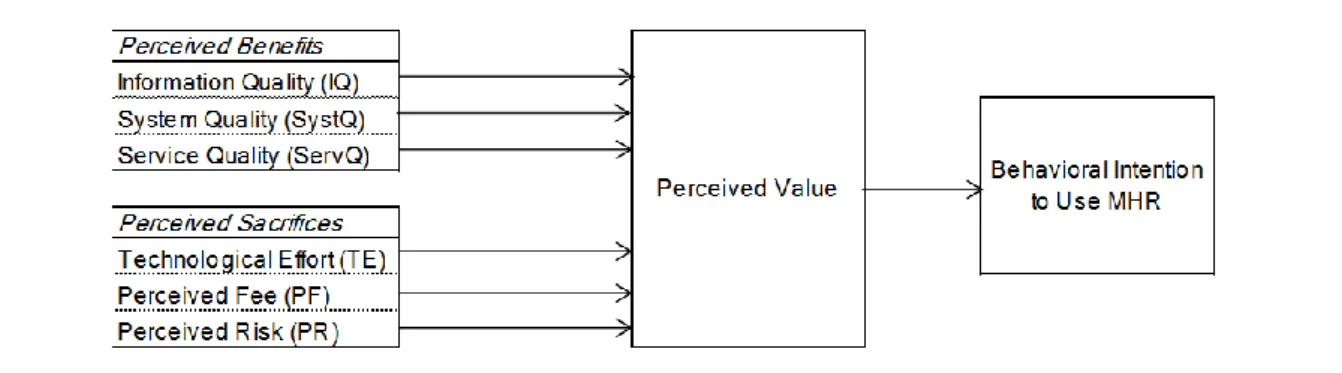
In the context of MHS, we adapt the definition given by Wang (2010, p: 600) and define perceived value as a customer’s overall value perception of MHR based on the
comparison of its benefits and sacrifice factors when using it. In Figure 2 we reproduce
the research model for Wang's (2010) mobile hotel reservation (MHR) system, in which it is postulated that perceived value is a strong predictor of behavioral intention to use MHR and that it is positively influenced by perceived benefits and negatively influenced by perceived sacrifices.
Figure 2 - Research Model of Wang (2010).
3. Research model
Even though mobile phones are now more commonly used, there are few people having experienced using MHS, as it is still in its early infancy. Thus, we adapt the UTAUT2 model and choose behavioral intention, which allows a timely investigation of customers’ acceptance in this early stage of MHS and seems to be more meaningful. Regarding the moderating effects, experience of use lies outside the scope of this research because only one moment in time is being observed. On the other hand, gender and age may have a considerable influence on users’ acceptance of MHS, and so both are considered.
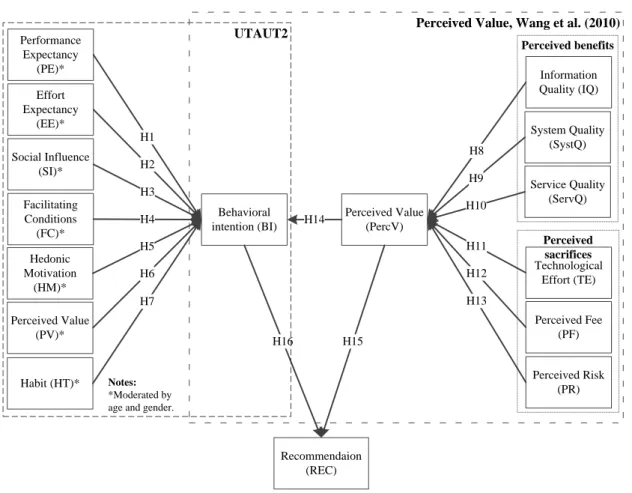
15 Our investigation is about a newly adopted service technology (MHS) and as with most newly introduced services, customers tend to assess the benefits of using the new services compared to the existing ones. This is consistent with our perceived value definition stating that hotel customers assess the value of adopting MHS by considering all the relevant benefits and sacrifice factors. Additionally, and taking into account that MHS is still in its early stages, we will test the possibility of recommending the service only by having the behavior intention to use it, and so we will add recommendation (Rec) as a dependent variable. We therefore propose to test the UTAUT2 in MHS, adding a perceived value model to the model (see Figure 3).
Performance Expectancy (PE)* Effort Expectancy (EE)* Social Influence (SI)* Facilitating Conditions (FC)* Behavioral intention (BI) Recommendaion (REC) H2 H3 H4 H16 H8
Perceived Value, Wang et al. (2010) UTAUT2 H1 Hedonic Motivation (HM)* Perceived Value (PV)* H5 H6 Habit (HT)* H7 Information Quality (IQ) System Quality (SystQ) Service Quality (ServQ) Technological Effort (TE) Perceived Fee (PF) Perceived Risk (PR) Perceived Value (PercV) H9 H10 H11 H12 H13 H14 H15 Perceived benefits Perceived sacrifices Notes: *Moderated by age and gender.
Figure 3 - Research Model.
Next we define each of the determinants of UTAUT2 and the perceived value factors. Performance expectancy (PE) reflects user perception of performance improvement by using MHS on tasks. For example it is the degree to which an individual believes that using MHS will help to attain gains in performing hotel services ordering tasks (Venkatesh et al., 2003). Effort expectancy (EE) is the degree of ease associated with the use of MHS. When users feel that MHS is easy to use and does not require much effort, they will have a high expectation toward acquiring the expected
16 performance. Social influence (SI) reflects the effect of environmental factors such as the opinions of the user’s friends, relatives, and hierarchic superiors on user behavior and is similar to the subjective norm of TRA (Venkatesh et al., 2003). Their opinions will affect the user’s intention to adopt MHS. Facilitating conditions (FC) reflect the effect of organizational and technical infrastructure to support the use of MHS, such as the user’s knowledge, ability, and resources (Venkatesh et al., 2003) and influence behavior directly.
However, in a consumer context the facilitation in the environment that is available to each consumer can vary considerably across application vendors, technology generations, mobile devices, and so on (Venkatesh et al., 2012). Facilitating conditions will act more like perceived behavioral control in the TPB and influence behavior intention (Ajzen, 1991). Hedonic motivation (HM) is defined as the fun or pleasure derived from using a technology (Venkatesh et al., 2012). There is evidence that it plays an important role in determining technology acceptance and use (Brown & Venkatesh, 2005). In the consumer context, hedonic motivation has also been found to be an important determinant of technology acceptance and use (e.g. Brown & Venkatesh, 2005). This means that pleasure and fun derived from using MHS will increase consumers’ intention to use it. Price value (PV) is defined as consumers’ cognitive tradeoff between the perceived benefits of the applications and the monetary cost of using them (Dodds et al., 1991). The price value is positive when the benefits of using a technology are perceived to be greater than the monetary cost and such price value has a positive impact on intention (Venkatesh et al., 2012). In the case of MHS, consumers usually bear the monetary cost of the data transferred over the internet.This factor must therefore be taken into account. Habit (HT) is defined as the extent to which people tend to perform behaviors automatically because of learning (Limayem et al., 2007) or through automacity (Kim et al., 2005). Fishbein and Ajzen (2005) also noted that feedback from previous experiences influences various beliefs and, consequently, future behavioral performance. Habit is thus a perceptual construct that reflects the results of earlier experiences. After defining each of the determinants of UTAUT2 and according to the model, we postulated that:
H1. The influence of Performance Expectancy (PE) on Behavioral Intention (BI) is
positive and moderated by age and gender.
H2. The influence of Effort Expectancy (EE) on Behavioral Intention (BI) is
17
H3. The influence of Social Influence (SI) on Behavioral Intention (BI) is positive
and moderated by age and gender.
H4. The influence of Facilitating Conditions (FC) on Behavioral Intention (BI) is
positive and moderated by age and gender.
H5. The influence of Hedonic Motivation (HM) on Behavioral Intention (BI), is
positive and moderated by age and gender.
H6. The influence of Price Value (PV) on Behavioral Intention (BI), is positive and
moderated by age and gender.
H7. The influence of Habit (HT) on Behavioral Intention (BI), is positive and
moderated by age and gender.
As mentioned above, perceived value is positively influence by perceived benefits and negatively influenced by perceived sacrifices. We therefore briefly illustrate both and indicate their constructs. Perceived benefits are directly correlated with product quality. Kerin et al. (1992) and Zeithaml (1988) assert that product quality refers to the customer’s cognitive appraisal of the excellence or superiority of a product. There is evidence, through earlier research on internet systems (similar to our own), that its quality can be assessed through information, system, and service quality (e.g. Ahn et al., 2007). In our investigation we define information quality (IQ) as the degree to which utilizing MHS can help customers to obtain complete, detailed, timely, accurate, reliable, and selective information to compare hotel services alternatives, in order to make better purchase decisions. System quality (SystQ) is defined as the degree to which using MHS meets customers’ needs in several aspects such as instant connection with web, fast response, good functionality, error-free transactions, and appropriate hypermedia presentation. Service quality (ServQ) is defined as the degree to which using MHS can provide customers with prompt, promised, follow-up, and professional personalized services.
The perceived sacrifice factor is directly correlated to monetary and non-monetary costs (Wang, 2010). Earlier research has identified technological effort as a significant barrier to mobile Internet adoption (Kim et al., 2007), and the worry and fear of disclosing sensitive personal information has shown significant influence on individual online hotel purchase decisions (Kim et al., 2006). We therefore propose that technological effort, perceived fee, and perceived risk of using MHS to be the sacrifice
18 components of perceived value. Technological effort (TE) is defined as the degree to which an individual believes that using MHS would expend physical and mental effort. Perceived fee (PF) is defined as the monetary transaction costs when customers conduct hotel services purchase through the MHS system. In this study we include only mobile Internet subscription-based costs since, for the use of MHS, clients must be connected to the internet and in most cases the costs are borne by them. Perceived risk (PR) is defined by the degree of financial, product performance, psychological, physical, security, and privacy risks when customers make transactions through the MHS system. After defining each of the determinants of the perceived value model, and according to Wang’s (2010) model, we postulate that:
H8. Information Quality (IQ) has a positive effect on Perceived Value (PercV). H9. System Quality (SystQ) has a positive effect on Perceived Value (PercV). H10. Service Quality (ServQ) has a positive effect on Perceived Value (PercV). H11. Technological Effort (TE) has a negative effect on Perceived Value (PercV). H12. Perceived Fee (PF) has a negative effect on Perceived Value (PercV). H13. Perceived Risk (PR) has a negative effect on Perceived Value (PercV).
Earlier research using the customer choice perspective and testing perceived value as a predictor of behavioral intention indicates that users’ perceived value could be a predictor of behavioral intention to accept wireless short messaging service (Turel et al., 2007), internet shopping (Lee et al., 2004), e-commerce (Chen & Dubinsky, 2003), and mobile hotel reservations (Wang, 2010). We therefore expect that high evaluation of perceived value will cause an increase in the behavioral intention to use MHS such that the following can be hypothesized:
H14. The overall Perceived Value (PercV) of MHS has a positive effect on
Behavioral Intention (BI) to use MHS.
As mentioned above, earlier studies have linked high levels of perceived value with customer satisfaction and loyalty. Similarly, other relevant studies have linked those with high levels of recommendation (e.g., Kuo et al., 2009; Sweeney & Soutar, 2001; Zeithaml et al., 1996). As a result, we also hypothesize that:
H15. The overall Perceived Value (PercV) will have a significant positive influence
19 Finally, according to recent marketing trends, recommendation is taken into account by many studies as a very powerful tool of disseminating new technologies and services (e.g., Cho & Kim, 2004; Hung, 2005; Lancelot Miltgen et al., 2013; Weng & Liu, 2004). Thus, maintaining our goal of testing behavioral intention as a positive influence to recommend MHS, we hypothesize that:
H16. Behavioral Intention (BI) has a positive influence on Recommendation (Rec).
4. Methods
4.1. Measurement instruments
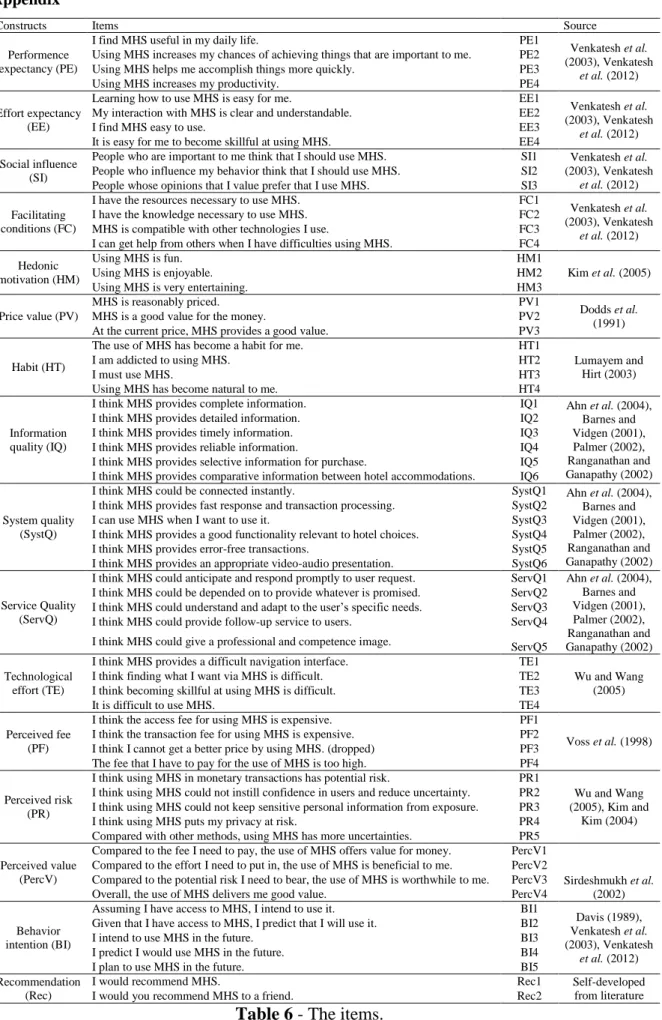
All measurement items except Rec, which was self-developed, were adopted with slight modifications from the literature – PE, EE, SI, and FC, were adopted from Venkatesh et al. (2003); HM from Kim et al. (2005); PV from Dodds et al. (1991); HT from Lumayem and Hirt (2003); BI from Venkatesh et al. (2003) and Davis (1989); IQ, SystQ, ServQ were adopted from Ahn et al. (2004), Barnes and Vidgen (2001), Palmer (2002), Ranganathan and Ganapathy (2002); TE from Wu and Wang (2005); PF from Voss et al. (1998), and PercV from Sirdeshmukh et al. (2002); The items for all constructs are included in the Appendix.
The questionnaire was initially developed in English, based on the literature, and reviewed by three academics. After testing its validity the final version was translated into Portuguese by a professional translator. Finally, to ensure translation equivalence (Brislin, 1970), a different translator translated it back into English. The items were measured using seven-point Likert scales, ranging from strongly disagree (1) to strongly agree (7). We also included two demographic questions relating to age and gender. Age was measured in years. Gender was coded using a 0 or 1 dummy variable, where 0 represented women.
4.2. Data collection
First, a pilot survey (with 30 respondents, not included in the main survey) was conducted in order to refine the questions and gain additional comments on the content and structure. The results were satisfactory and therefore no changes were made. The questionnaire was uploaded to the Web through a Web hosting service, which the respondents could access by clicking on the URL provided in the message delivered through social media platforms. After clicking on the URL a page would appear with a
20 message stating the purpose of this study and a video describing the MHS. At the end of the questionnaire the respondents were invited to leave their email address if interested in receiving further information about the results of the study.
In the main survey we obtained 409 respondents, of which 348 responses were validated. The majority of respondents (58 percent) answered that they had already used MHS at least once. The 348 responses were obtained after one follow-up for the individuals that did not respond the first time. In the first e-mail we obtained 231 valid responses, in the second round we obtained 117 valid responses. We compared the sample distribution of the first and second respondent groups to test for nonresponse bias. First, to compare the sample distributions of the two groups we used the Kolmogorov–Smirnov (K–S) test (Ryans, 1974), and the results suggest that the sample distributions of the two independent groups do not differ statistically (Ryans, 1974), meaning that nonresponse bias is not present. Second, we tested for the common method bias using Harman’s one-factor test (Podsakoff et al., 2003) and found no significant common method bias in our dataset.
Concerning demographic data (Table 1), we can see that most respondents are between 21 and 30 years old and 51.4 percent are female. More than half (57.5%) have an undergraduate degree, 25.6% have a graduate degree, while the respondents with elementary or high school are approximately 15%. This is in line with Yang (2005), who postulates that higher education influences positively the possibility to adopt mobile commerce. Regarding the respondents’ occupation, most were employed professionals (46.55%), followed by students (42.24%).
Table 1 - Demographic data of respondents.
Age Gender Education Jobs
[18-21[ 24 6.89% Male 169 48.6% Elementary and
High School 52 14.9% Student 147 42.24%
[21-25[ 170 48.85% Female 179 51.4% Undergraduate degree 200 57.50% Retired 2 0.57% [25-30[ 80 22.99% Graduate degree 89 25.6% Unemployed 6 1.72% [30-40[ 25 7.18% Other 7 2% Professional 162 46.55% [40-70[ 49 14.08% Freelancer 13 3.74% Self-employed 18 5.17%
21
5. Results
We use partial least squares (PLS), which is a variance-based technique, since not all items in our data are distributed normally (p<0.01 based on Kolmogorov-Smirnov’s test). The research model has not been tested in the literature and is considered to be complex. To analyze the relationships defined in our theoretical model we used Smart PLS 2.0 M3 (Ringle et al., 2005). In the following subsections the measurement model is examined and the structural model is tested.
5.1. Measurement Model
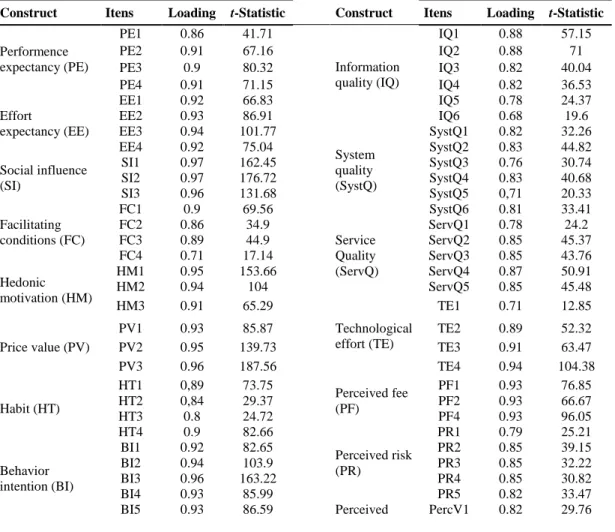
According to Henseler et al. (2009), in order to analyze the indicator reliability, loadings should initially be statistically significant and greater than 0.7. Table 2 reports the loadings and t-statistic values of the items measured. The t-statistic obtained from bootstrapping (500 iterations) shows that all loadings are statistically significant at 1%. The PF3 item was excluded due to its low loading and lack of statistical significance. All other items were retained and we can state that all data suggest internal consistency since all items have loadings greater than 0.7.
Table 2 – Loadings of the measurement model.
Construct Itens Loading t-Statistic Construct Itens Loading t-Statistic Performence expectancy (PE) PE1 0.86 41.71 Information quality (IQ) IQ1 0.88 57.15 PE2 0.91 67.16 IQ2 0.88 71 PE3 0.9 80.32 IQ3 0.82 40.04 PE4 0.91 71.15 IQ4 0.82 36.53 Effort expectancy (EE) EE1 0.92 66.83 IQ5 0.78 24.37 EE2 0.93 86.91 IQ6 0.68 19.6 EE3 0.94 101.77 System quality (SystQ) SystQ1 0.82 32.26 EE4 0.92 75.04 SystQ2 0.83 44.82 Social influence (SI) SI1 0.97 162.45 SystQ3 0.76 30.74 SI2 0.97 176.72 SystQ4 0.83 40.68 SI3 0.96 131.68 SystQ5 0,71 20.33 Facilitating conditions (FC) FC1 0.9 69.56 SystQ6 0.81 33.41 FC2 0.86 34.9 Service Quality (ServQ) ServQ1 0.78 24.2 FC3 0.89 44.9 ServQ2 0.85 45.37 FC4 0.71 17.14 ServQ3 0.85 43.76 Hedonic motivation (HM) HM1 0.95 153.66 ServQ4 0.87 50.91 HM2 0.94 104 ServQ5 0.85 45.48 HM3 0.91 65.29 Technological effort (TE) TE1 0.71 12.85 Price value (PV) PV1 0.93 85.87 TE2 0.89 52.32 PV2 0.95 139.73 TE3 0.91 63.47 PV3 0.96 187.56 TE4 0.94 104.38 Habit (HT) HT1 0,89 73.75 Perceived fee (PF) PF1 0.93 76.85 HT2 0,84 29.37 PF2 0.93 66.67 HT3 0.8 24.72 PF4 0.93 96.05 HT4 0.9 82.66 Perceived risk (PR) PR1 0.79 25.21 Behavior intention (BI) BI1 0.92 82.65 PR2 0.85 39.15 BI2 0.94 103.9 PR3 0.85 32.22 BI3 0.96 163.22 PR4 0.85 30.82 BI4 0.93 85.99 PR5 0.82 33.47
22
Construct Itens Loading t-Statistic Construct Itens Loading t-Statistic Recommendation
(Rec)
Rec1 0.99 653 value (PercV) PercV2 0.91 75.58
Rec2 0.99 616.08 PercV3 0.9 57.37
PercV4 0.91 76.08
To evaluate the constructs’ reliability, two indicators were used – composite reliability (CR) and Cronbach’s alpha (CA). As seen in Table 3, CR and CA for each construct are above the expected threshold of 0.7, showing evidence of internal consistency.
In order to evaluate the convergent validity we used the average variance extracted (AVE). According to Henseler et al. (2009) if the AVE is greater than 0.5 it means that the latent variable explains more than half of the variance of its indicators. As we can see in Table 3 each constructs’ AVE is above the expected threshold of 0.5, confirming convergent validity.
Finally, to grant discriminant validity of the constructs, we must analyze the data through the cross-loadings and the Fornell-Larker criterion. The first criterion requires that the loading of each indicator should be greater than all cross-loadings (Chin, 1998), while the second postulates that the square root of AVE should be greater than the correlations between the construct (Henseler et al., 2009). Our findings reveal that not only are patterns of loadings greater than the cross-loadings, but also that the square root of AVE is greater than the correlation between each of the pair factors, thus confirming discriminant validity. Table 3 shows the loading, cross-loading and square root of AVE values for each construct.
23
Table 3 - Means, standard deviations, correlations, and reliability and validity measures (CR, CA, and AVE) of latent variables.
Mean SD CR CA PE EE SI FC HM PV HT IQ SystQ ServQ TE PF PR PercV BI Rec Age Male
PE 4.31 1.32 0.94 0.92 0.89 EE 4.97 1.15 0.96 0.94 0.53 0.93 SI 3.91 1.46 0.98 0.96 0.58 0.35 0.97 FC 5.01 1.33 0.91 0.86 0.35 0.61 0.35 0.84 HM 4.42 1.38 0.95 0.93 0.55 0.52 0.43 0.49 0.94 PV 4.66 1.33 0.97 0.95 0.37 0.61 0.34 0.61 0.51 0.95 HT 3.04 1.47 0.92 0.89 0.57 0.34 0.52 0.33 0.42 0.33 0.86 IQ 4.80 0.99 0.92 0.90 0.44 0.54 0.36 0.45 0.47 0.46 0.26 0.81 SystQ 4.77 1.04 0.91 0.88 0.49 0.57 0.41 0.48 0.49 0.44 0.26 0.76 0.80 ServQ 4.88 1.09 0.92 0.90 0.47 0.49 0.34 0.46 0.51 0.41 0.22 0.68 0.73 0.84 TE 2.95 1.19 0.92 0.89 -0.23 -0.47 -0.04 -0.38 -0.29 -0.35 -0.10 -0.35 -0.37 -0.32 0.87 PF 3.32 1.42 0.95 0.92 -0.05 -0.27 0.03 -0.29 -0.08 -0.40 -0.08 -0.13 -0.19 -0.10 0.46 0.93 PR 3.68 1.20 0.92 0.89 -0.28 -0.28 -0.20 -0.20 -0.21 -0.25 -0.16 -0.27 -0.27 -0.29 0.50 0.44 0.83 PercV 4.72 1.10 0.94 0.91 0.58 0.62 0.40 0.53 0.55 0.62 0.37 0.57 0.59 0.55 -0.42 -0.28 -0.34 0.88 BI 5.13 1.33 0.97 0.96 0.55 0.60 0.42 0.61 0.53 0.54 0.44 0.50 0.51 0.51 -0.41 -0.30 -0.29 0.63 0.94 Rec 5.02 1.41 0.99 0.98 0.51 0.58 0.40 0.49 0.53 0.51 0.42 0.47 0.49 0.47 -0.39 -0.20 -0.27 0.58 0.69 0.99 Age 28.11 10.14 NA NA 0.04 -0.10 -0.03 -0.12 -0.01 -0.08 -0.07 0.01 0.06 0.06 0.08 0.07 0.03 -0.01 -0.09 -0.04 NA Male 0.49 0.50 NA NA 0.07 0.03 0.10 0.06 -0.02 0.06 0.06 0.11 0.10 0.07 0.11 -0.02 0.01 0.08 0.12 0.05 -001 NA Notes: (i) Diagonal elements are the square root of the average variance extracted (AVE). (ii) PE: performance expectancy; EE: effort expectancy; SI: social influence; FC: facilitating conditions; HM: hedonic motivation; PV: price value; HT: habit; IQ: information quality; SystQ: system quality; ServQ: service quality; TE: technological effort: PF: perceived fee; PR: perceived risk; PercV: perceived value; BI: behavioral intention; Rec: recommendation. (iv) NA = not applicable.
24
5.2. Structural model
Having assessed construct reliability, indicator reliability, convergent validity, and discriminant validity of the constructs and found them satisfactory, we proceed to the analysis of the structural model. We chose to analyze four models: (i) UTAUT2 without interaction effects (D), (ii) UTAUT 2 with interaction effects (D+I), (iii) UTAUT2 and perceived value (PercV) (UTAUT2+PercV – the main model) without interaction effects (D), and (iv) UTAUT2 and perceived value (PercV) with interaction effects (D+I). We tested the models with and without the interaction effects to understand if age and gender had an influence on the intention and recommendation of the system. Path coefficients and r-squares for each model tested are presented in Table 4, where we see that all r-squares of the structural model are in the limits recommended by Chin (1998), i.e. above 0,2. Comparison of the estimated models reveals that on intention, moderating effects always have an impact on r-square, increasing it (0.54 vs. 0.60 in UTAUT2 and 0.56 vs. 0.62 in UTAUT2+PercV). In a similar way, when we add perceived value to the UTAUT2 model, r-square also increases (0.54 vs. 0.56 with direct effects only and 0.60 vs. 0.62 with direct and interaction effects). For recommendation, when we add perceived value to the UTAUT2 model, r-square increases (0.48 vs 0.51).
25
Table 4 - Structural model results for UTAUT2 and UTAUT2+PercV.
UTAUT2 UTAUT2+PercV D D+1 D D+1 Perceived Value R2 0.45 0.45 Information Quality 0.22*** 0.22*** System Quality 0.20** 0.20** Service Quality 0.19*** 0.19** Technological Effort -0.14* -0.14* Perceived Fee -0.11* -0.11** Perceived Risk -0.06 -0.06 Behaviour Intention R2 0.54 0.60 0.56 0.62 Performance Expectancy 0.22*** 0.19*** 0.15** 0.13** Effort Expectancy 0.15** 0.18*** 0.11* 0.14** Social Influence 0.02 0.01 0.02 0.01 Facilitating Conditions 0.29*** 0.27*** 0.27*** 0.25*** Hedonic Motivation 0.09* 0.11** 0.06 0.09 Price Value 0.11* 0.06 0.04 0.01 Habit 0.08* 0.06 0.09* 0.07 Age -0.05 -0.06 Male 0.00 -0.04 Age*Male 0.09 0.11 Age * PE 0.09 0.08 Age * EE 0.04 0.06 Age * SI -0.17*** -0.17*** Age * FC -0.08 -0.10 Age * HM 0.04 0.05 Age * PV 0.09 0.08 Age * HT 0.05 0.04 Male * PE 0.19 0.20 Male * EE 0.09 0.12 Male * SI -0.15 -0.13 Male * FC -0.07 -0.49 Male * HM -0.21 -0.16 Male * PV 0.07 0.09 Male * HT -0.14 -0.18 Age*Male * PE -0.18 -0.19 Age*Male * EE -0.05 -0.08 Age*Male * SI 0.14 0.14 Age*Male * FC 0.05 -0.09 Age*Male * HM 0.23 0.17 Age*Male * PV 0.05 -0.19 Age*Male * HT -0.19 0.08 Perceived Value 0.23*** 0.21*** Recommendation R2 0.48 0.48 0.51 0.51 Perceived Value 0.24*** 0.24*** Behavioral Intention 0.69*** 0.69*** 0.54*** 0.54***
Notes: *p < 0.10; **p < 0.05; ***p < 0.01; all other path coefficients are insignificant.
It is now possible to conclude that our model that added perceived value (PercV) to the UTAUT2 model, with moderating effects, surpasses all its predecessors as it improves its explanatory power. As a result, from now on we focus our analysis on the main model (UTAUT2+PerV) with moderating effects.
For this model we calculated t-statistics derived from bootstrapping (250 iterations) and found that not all direct effects are statistically significant. For instance,
26 performance expectancy (β̂=0.13; p<0.05), effort expectancy (β̂=0.14; p<0.05), facilitating conditions (β̂=0.25; p<0.01), and perceived value (β̂=0.21; p<0.01) were statistically significant in explaining behavior intention of MHS, while social influence, hedonic motivation, price value, and habit were not. Concerning interaction effects, the only one that is statistically significant (Table 4) is age on social influence (β̂= -0.17; p<0.01).
In explaining the perceived value, all but perceived risk were statistically significant (Figure 4), i.e., information quality (β̂=0.22; p<0.01), system quality (β̂=0.20; p<0.05), service quality (β̂ = 0.19; p<0.05), technological effort (β̂= -0.14; p<0.1) and perceived fee (β̂= -0.11; p<0.05).
Both behavioral intention (β̂ = 0.54; p<0.01) and perceived value (β̂=0.24; p<0.01) were statistically significant in explaining recommendation.
Performance Expectancy (PE)* Effort Expectancy (EE)* Social Influence (SI)* Facilitating Conditions (FC)* Behavioral intention (BI) R2=62% Recommendaion (REC) R2=51% 0.14** 0.01 0.25*** 0.54*** 0.22***
Perceived Value, Wang et al. (2010) UTAUT2 0.13** Hedonic Motivation (HM)* Perceived Value (PV)* 0.09 0.01 Habit (HT)* 0.07 Information Quality (IQ) System Quality (SystQ) Service Quality (ServQ) Technological Effort (TE) Perceived Fee (PF) Perceived Risk (PR) Perceived Value (PercV) R2=45% 0.20** 0.19** -0.14* -0.11** -0.06 0.21*** 0.24*** Perceived benefits Perceived sacrifices Notes: *Moderated by age and gender.
Note: In order to simplify, the figure presents only direct effects; *p < 0.10; **p < 0.05; ***p < 0.01; dashed lines indicate no statistical significance.
Figure 4 - Structural model (UTAUT2+PercV – D+I) with path coefficients and
27
6. Discussion
6.1. Theoretical implications
Regarding theory, our results suggest that perceived value increases the predictive power of the UTAUT2 model in explaining behavior intention of MHS and also that the overall model explains recommendation rather well. Since this is a pioneer research on MHS we do not have other studies to which we can compare our results. Nevertheless, our results are sound and encouraging. The research model proposed explains 45 percent of variation in perceived value of MHS, 62 percent of the variation in behavior intention of MHS, 51 percent of the variation in recommendation of MHS.
Table 5 shows the outcomes of hypotheses tested. The results of the model show that the effect of social influence (SI), as was the case in of UTAUT2, was not statistically significant (Hartwick & Barki, 1994). Moreover, hedonic motivation (HM), price value (PV), and habit (HT) (also constructs from UTAUT2 over behavioral intention - BI) were not statistically significant. This suggests that our respondents are not concerned about the opinion of others (family, friends, peers), nor about the price or the habit of usage to influence their use of MHS. Older people moderate the effect of social influence on behavior intention of MHS, such that the effect is negative and stronger among the elderly, meaning that they are less likely have the intention to use the system when others have a good opinion of it. The effects of performance expectancy (PE), effort expectancy (EE), and facilitating conditions (FC) over behavioral intention (BI) were significant, meaning that individuals take into account the results of using MHS, the necessary effort to expend in order to use it, and the technical and organizational support they have. The remaining interaction effects were not statistically significant, which is consistent with earlier research in other areas, such as internet and mobile banking (e.g. Martins et al., 2014; Oliveira et al., 2014; Riffai et
al., 2012).
Table 5 - Hypotheses Testing.
Hypotheses Independent Variable →
Dependent
Variable Moderators Findings Conclusion
H1 Performance
Expectancy → Behavior Intention Age, Gender
Positive and statistically significant (β̂=0.13; p<0.05).
Partially supported
H2 Effort
Expectancy → Behavior Intention Age, Gender
Positive and statistically significant (β̂=0.14; p<0.05).
Partially supported
H3 Social
Influence → Behavior Intention Age, Gender
Only age negatively and statistically significant moderates SI to explain BI (β̂=-0.17; p<0.01).
Not supported
H4 Facilitating
Conditions → Behavior Intention Age, Gender
Positive and statistically significant (β̂=0.25; p<0.01).
Partially supported
28 Perceived value shows evidence of positively influencing intention to use MHS. The perceived benefit constructs (IQ, Syst, ServQ) proved to be more salient than the perceived sacrifice constructs (TE, PF, PR), which demonstrates that consumers are more concerned with the benefits of using MHS than with the risks of using it. Moreover, perceived risk (PR) influence was not significant, which might indicate that potential users are not concerned about the risks (i.e. financial, privacy) of using MHS.
Finally, the impact of behavioral intention (BI) and perceived value (PercV) on recommendation (Rec) were also considerable, which indicates that prospective MHS users are more likely to recommend the system if they have the intention to use it and perceive the value of the MHS.
6.2. Managerial implications
The findings of this study reveal that perceived value is an important factor affecting end-user intention to use MHS. The focus should be on information, service, and system quality. To boost the intention to use MHS, managers should make efforts to help customers obtain complete, detailed, timely, accurate, reliable, and selective hotel services information to fulfill their needs. For example, MHS can provide a variety of information that is already provided by traditional channels, but enhanced by mobile technology like special packages for mobile users. Moreover, by utilizing flexible MHS
Motivation
H6 Price Value → Behavior Intention Age, Gender Non-significant effect. Not Supported
H7 Habit → Behavior Intention Age, Gender Non-significant effect. Not Supported
H8 Information
Quality → Perceived Value None
Positive and statistically significant
(β̂=0.22; p<0.01). Supported
H9 System
Quality → Perceived Value None
Positive and statistically significant
(β̂=0.20; p<0.05). Supported
H10 Service
Quality → Perceived Value None
Positive and statistically significant
(β̂=0.20; p<0.01). Supported
H11 Technological
Effort → Perceived Value None
Negative and statistically
significant (β̂=-0,14; p<0.1). Supported
H12 Perceived Fee → Perceived Value None Negative and statistically
significant (β̂=-0,11; p<0.05). Supported
H13 Perceived
Risk → Perceived Value None Non-significant effect. Not Supported
H14 Perceived
Value → Behavior Intention None
Positive and statistically significant
(β̂=0.21; p<0.01). Supported
H15 Perceived Value → Recommendation None Positive and statistically significant
(β̂=0.24; p<0.01). Supported
H16 Behavior
Intention → Recommendation None
Positive and statistically significant
29 systems, hotels can provide customers with additional timely information, like location based services, to make it more convenient for travelers to find maps and directions, local attractions, or information on other hotels of the same chain.
Hotels should also announce the benefits of using the platform, such as speed, quality of service, and effective information, assuring that the right information will be available in a timely way everywhere the client desires. The compatibility of technologies is a major issue. Therefore, managers should join efforts to create applications that are compatible with most mobile devices and ensure technical help to users if needed. Managers should also focus on platforms that are as user-friendly as possible, since facilitating conditions are an important factor in the intention to use MHS. If deeming it to be difficult, most users will not have the intention to use MHS.
Since service quality is so important, hoteliers should focus on follow-up and high quality services. For instance, the system could be configured in such a way as to maintain follow-up connection with clients by asking for a review or by presenting a questionnaire at the end of their stay. Moreover, the system could identify where customers are, and when powering their mobile phones in a specific area, the hotel would send a message asking if the client would be interested in a specific service which would help to improve customers’ service quality perception.
6.3. Limitations and future research
Even though rigorous research procedures were used, this study has some limitations that could be addressed in future studies. First, data collection was limited to Portugal, and the vast majority of respondents were college educated, and therefore more open to new technology and services. If future researchers wish to make generalizations from the data, they should randomize their sample to include other nationalities and geographical areas outside of Portugal. Additional research is needed to make the findings of this study generalizable. Second, the model is cross-sectional in that it measures perceptions and intentions at a single point of time. However, perceptions change over time as individuals obtain experience. When the MHS technology becomes more mature, researchers interested in usage of advanced information technology will be able to investigate this issue more thoroughly by adding more factors that might influence user intention and, in this more mature state, actual usage of MHS.
30
7. Conclusions
Tourism is one of the fastest growing industries on the planet and its pace is matched only by IT development. Therefore, we propose an adoption model of an information technology in a tourist context. Adoption models and frameworks are increasingly applied to various individual and organizational contexts to explore factors affecting a specific technology’s intention for use and to its recommendation for use. However, in the case of its adoption in tourism, the influence that perceived value may exert on adoption decisions has received limited attention. To address this weakness, we contribute to adoption theory by offering a conceptual framework that sheds more light on the influence of perceived value on end-user adoption of an IT in tourism. Our research sought to understand the determinants of MHS adoption. We combined the UTAUT2 model with a perceived value model. Interestingly, the data describe a more complex picture than what might have been anticipated. We found that individual expectations regarding information quality, service information, and service quality were the most important in explaining users’ perceived value of MHS; that their expectations toward performance expectancy, effort expectancy, and facilitating conditions were determinants in explaining users’ intention to use MHS; and that both the behavioral intention to use MHS and its perceived value have an important influence on the system recommendation. By including perceived value in the proposed framework, we added a strong determinant to predict intention to use and recommend mobile hospitality services (MHS), and thus provided a more predictive power to the existing extension of UTAUT2.
31
References
Ahn, T., Ryu, S., & Han, I. (2007). The impact of Web quality and playfulness on user acceptance of online retailing. Information & Management, 44(3), 263-275. Ajzen, I. (1991). The theory of planned behavior. Organizational behavior and human
decision processes, 50(2), 179-211.
Au, Y. A., & Kauffman, R. J. (2008). The economics of mobile payments: Understanding stakeholder issues for an emerging financial technology application. Electronic Commerce Research and Applications, 7(2), 141-164. Bai, B., Law, R., & Wen, I. (2008). The impact of website quality on customer
satisfaction and purchase intentions: Evidence from Chinese online visitors.
International Journal of Hospitality Management, 27(3), 391-402.
Barnes, S. J. (2002). The mobile commerce value chain: analysis and future developments. International Journal of Information Management, 22(2), 91-108.
Bolton, R. N., & Drew, J. H. (1991). A Multistage Model of Customers' Assessments of Service Quality and Value. Journal of Consumer Research, 17(4), 375-384. Brislin, R. W. (1970). Back-Translation for Cultural Research. Journal of
Cross-Cultural Psychology, 1(3), 185-216.
Brown, S. A., & Venkatesh, V. (2005). Model of adpotion of technology in housholds: A baseline model test and extension incoporating household life cycle. MIS
QUARTERLY, 29(3), 399-426.
Carlsson, C., Carlsson, J., & Walden, P. (2005). Mobile services for the hospitality industry.
Chang, S., Gong, Y., & Shum, C. (2011). Promoting innovation in hospitality companies through human resource management practices. International
Journal of Hospitality Management, 30(4), 812-818.
Chen, Z., & Dubinsky, A. J. (2003). A conceptual model of perceived customer value in e‐commerce: A preliminary investigation. Psychology & Marketing, 20(4), 323-347.
Chin, W. W. (1998). Issues and opinion on structural equation modeling. MIS
QUARTERLY, 22(1), -vii-xv.
Cho, Y. H., & Kim, J. K. (2004). Application of Web usage mining and product taxonomy to collaborative recommendations in e-commerce. Expert Systems
32 Crowell, C. (2009). Give guests control on mobile devices. Hotel & Motel Management,
224(9), 18-18.
Davis, F. D. (1989). Perceived usefulness, perceived ease of use, and user acceptance of information technology. MIS QUARTERLY, 319-340.
Dodds, W. B., Monroe, K. B., & Grewal, D. (1991). Effects of price, brand, and store information on buyers' product evaluations. Journal of Marketing Research
(JMR), 28(3).
Fishbein, M., & Ajzen, I. (1975). Belief, attitude, intention and behavior: An
introduction to theory and research.
Fishbein, M., & Ajzen, I. (2005). The influence of attitudes on behavior. The handbook
of attitudes, 173-222.
Fodness, D., & Murray, B. (1999). A model of tourist information search behavior.
Journal of Travel Research, 37(3), 220-230.
Goh, D. H., Ang, R. P., Lee, C. S., & Lee, C. K. (2009). A factor analytic approach
towards determining mobile tourism services. Paper presented at the
Proceedings of the 11th International Conference on Electronic Commerce, Taipei, Taiwan.
Goh, D. H., Ang, R. P., Lee, C. S., & Lee, C. K. (2010). Determining services for the mobile tourist. Journal of Computer Information Systems, 51(1), 31.
Hartwick, J., & Barki, H. (1994). Explaining the role of user participation in information system use. Management Science, 40(4), 440-465.
Henseler, J., Ringle, C. M., & Sinkovics, R. R. (2009). The use of partial least squares path modeling in international marketing. Advances in international marketing,
20, 277-319.
Hinze, A., & Buchanan, G. (2005). Context-awareness in mobile tourist information systems: challenges for user interaction.
Hoyer, W. D., & Maclnnis, D. J. (2003). Consumer Behavior 3rd ed. Boston: Houghton Mifflin.
Hung, L.-p. (2005). A personalized recommendation system based on product taxonomy for one-to-one marketing online. Expert Systems with Applications,
29(2), 383-392.
Hutchinson, J., Lai, F., & Wang, Y. (2009). Understanding the relationships of quality, value, equity, satisfaction, and behavioral intentions among golf travelers.
33 Johns, G. (2006). The essential impact of context on organizational behavior. Academy
of Management Review, 31(2), 386-408.
Kahneman, D., & Tversky, A. (1979). Prospect theory: An analysis of decision under risk. Econometrica: Journal of the Econometric Society, 263-291.
Kerin, R. A., Jain, A., & Howard, D. J. (1992). Store shopping experience and consumer price-quality-value perceptions. Journal of Retailing.
Kim, D. Y., Park, J., & Morrison, A. M. (2008). A model of traveller acceptance of mobile technology. International Journal of Tourism Research, 10(5), 393-407. Kim, H.-W., Chan, H. C., & Gupta, S. (2007). Value-based Adoption of Mobile
Internet: An empirical investigation. Decision Support Systems, 43(1), 111-126. Kim, S. S., Malhotra, N. K., & Narasimhan, S. (2005). Two Competing Perspectives on
Automatic Use: A Theoretical and Empirical Comparison. Information Systems
Research, 16(4), 418-432.
Kim, W. G., & Kim, D. J. (2004). Factors affecting online hotel reservation intention between online and non-online customers. International Journal of Hospitality
Management, 23(4), 381-395.
Kim, W. G., Ma, X., & Kim, D. J. (2006). Determinants of Chinese hotel customers’ e-satisfaction and purchase intentions. Tourism Management, 27(5), 890-900. Kuo, N.-T., Chang, K.-C., Cheng, Y.-S., & Lai, C.-H. (2013). How service quality
affects customer loyalty in the travel agency: The effects of customer satisfaction, service recovery, and perceived value. Asia Pacific Journal of
Tourism Research, 18(7), 803-822.
Kuo, Y.-F., Wu, C.-M., & Deng, W.-J. (2009). The relationships among service quality, perceived value, customer satisfaction, and post-purchase intention in mobile value-added services. Computers in Human Behavior, 25(4), 887-896.
Lancelot Miltgen, C., Popovič, A., & Oliveira, T. (2013). Determinants of end-user acceptance of biometrics: Integrating the “Big 3” of technology acceptance with privacy context. Decision Support Systems, 56, 103-114.
Law, R., Leung, D., & Au, N. (2013). Progress and Development of Information Technology in the Hospitality Industry Evidence from Cornell Hospitality Quarterly. Cornell Hospitality Quarterly, 54(1), 10-24.
Lee, E.-J., Uniremidy, C.-A., & Overby, J. W. (2004). Creating value for online shoppers: Implications for satisfaction and loyalty. Consumer Satisfaction,