Molecular Ecology (2007) 16, 3592–3605 doi: 10.1111/j.1365-294X.2007.03405.x
Blackwell Publishing Ltd
Genetic divergence in the Atlantic–Mediterranean
Montagu’s blenny,
Coryphoblennius galerita
(Linnaeus 1758)
revealed by molecular and morphological characters
V E R A S . D O M I N G U E S ,*† C L Á U D I A F A R I A ,* S E R G I O S T E F A N N I ,† R I C A R D O S . S A N T O S ,† A L B E R T O B R I T O‡ and V I T O R C . A L M A D A**Instituto Superior de Psicologia Aplicada, Unidade de Investigação em Eco-Etologia, R. Jardim do Tabaco 34, 1149-041 Lisboa, Portugal, †Departamento de Oceanografia e Pescas, Universidade dos Açores, 9901-862 Horta, Acores, Portugal, ‡Universidad de La Laguna, Dpto. Biología Animal (Ciencias Marinas), Avenida Astrofísico Francisco Sánchez s/n, 38206 La Laguna, Tenerife, Islas Canarias, Spain
Abstract
Coryphoblennius galerita is a small intertidal fish with a wide distribution and limited dispersal ability, occurring in the northeastern Atlantic and Mediterranean. In this study, we examined Atlantic and Mediterranean populations of C. galerita to assess levels of genetic divergence across populations and to elucidate historical and contemporary factors underlying the distribution of the genetic variability. We analyse three mitochondrial and one nuclear marker and 18 morphological measurements. The combined dataset clearly supports the existence of two groups of C. galerita: one in the Mediterranean and another in the northeastern Atlantic. The latter group is subdivided in two subgroups: Azores and the remaining northeastern Atlantic locations. Divergence between the Atlantic and the Mediterranean can be the result of historical isolation between the populations of the two basins during the Pleistocene glaciations. Present-day barriers such as the Gibraltar Strait or the ‘Almeria-Oran jet’ are also suggested as responsible for this isolation. Our results show no signs of local extinctions during the Pleistocene glaciations, namely at the Azores, and contrast with the biogeographical pattern that has been observed for Atlantic– Mediterranean warm-water species, in which two groups of populations exist, one including the Mediterranean and the Atlantic coast of western Europe, and another encompassing the western tropical coast of Africa and the Atlantic islands of the Azores, Madeira and Canaries. Species like C. galerita that tolerate cooler waters, may have persisted during the Pleistocene glaciations in moderately affected locations, thus being able to accumulate genetic differences in the more isolated locations such as the Azores and the Mediterranean. This study is one of the first to combine morphological and molecular markers (mitochondrial and nuclear) with variable rates of molecular evolution to the study of the relationships of the Atlantic and Mediterranean populations of a cool-water species.
Keywords: Coryphoblennius galerita, Mediterranean, morphology, mt/nDNA, northeastern Atlantic, population structure
Received 13 January 2007; revision accepted 27 April 2007
Introduction
The study of genetic divergence and speciation in the marine environment represents a great challenge. Marine populations tend to be large and marine species often
have high fecundity and larvae that can disperse over long distances. Thus, marine species are usually expected to show high levels of gene flow and low geographical differentiation. However, increasing evidence indicates that at least partially isolated populations may occur quite commonly in marine systems (e.g. Doherty et al. 1995; Shulman & Bermingham 1995; Bernardi 2000; Riginos & Nachman 2001; Stefanni & Thorley 2003; Taylor & Hellberg Correspondence: Vera S. Domingues, Fax: +351 218860954; E-mail:
G E N E T I C D I V E R G E N C E O F C O R Y P H O B L E N N I U S G A L E R I T A 3593
2003; Baus et al. 2005). Several mechanisms have been proposed by which marine species with high dispersal potential can diverge genetically. These include vicariance processes caused by past barriers; oceanographic currents; habitat discontinuities; local adaptation; larval behaviour; isolation by distance and limited dispersal to new areas promoting genetic differentiation (Palumbi 1994; Riginos & Nachman 2001 and references therein).
In this regard, the northeastern Atlantic, including the Macaronesian islands, together with the Mediterranean constitute very interesting study cases. Different areas within these regions were differentially affected by drops in sea surface temperature associated with the Pleistocene glaciations. The shores of west Europe endured polar conditions during the glacial maxima, with very cold waters also present along the northwestern African coast (Crowley 1981; Dias et al. 1997) and, to some extent, the Canary Islands (Lamb 1977; Crowley 1981). At the Azores, temperature drops were moderate (about 2–3 °C; Crowley 1981), while Madeira, the tropical western coast of Africa and some southern Mediterranean areas were little affected (Thiede 1978). These fluctuations led to local extinctions and latitudinal shifts of many taxa, namely those that are only capable of living in warmer waters (Almada et al. 2001; Domingues et al. 2006). After warmer conditions were restored, recolonization probably occurred from some less affected regions that may have acted as refugia. Thus, vicariance and dispersal have very likely played an important role in the evolutionary history of the marine fauna of the northeastern Atlantic and the Mediterranean.
Oceanic currents should also be taken in consideration when identifying the factors that influence the distribution of the genetic variability in a particular region, especially when studying coastal organisms whose dispersal capabilities are restricted to their planktonic larval phases. The northeastern Atlantic current system is dominated by a multibranch complex system that has its origin in the Gulf Stream (Stramma 1984). The circulation flows predominantly to the east and northeast, bringing warm water to Europe. However, one branch of the system turns south originating the cold water Canaries current which runs parallel to the shores of southwest Europe and northwest Africa, reaching Madeira and the Canaries (Stramma 1984; Santos et al. 1995) (Fig. 1). However, meanders and eddies also cause sporadic transport of water and plankton from Madeira to Azores (Santos et al. 1995). The impact of currents in the Canary Islands also generates a complex system of eddies that promotes transport towards the north in the western islands (Molina et al. 1996). These eddies make the con-nection between the Canaries and Madeira possible, with the Salvage Islands possibly acting as a stepping-stone. Between the West African shore and the Canary Islands, upwelling filaments can also cause sporadic transport towards the islands (Barton et al. 1998; Rodríguez et al. 1999;
Bécognée et al. 2006). The Atlantic and the Mediterranean communicate by the Gibraltar Strait, which is characterized by a two-layer flow regime. Atlantic waters inflow in the upper layer and Mediterranean waters outflow in the lower layer (Malanotte-Rizzoli & Bergamasco 1989; Özgökmen
et al. 2001). Close to the Gibraltar Strait, the water in the Alboran Sea describes a quasi-permanent anticyclonic gyre that generates another oceanographic barrier known as the ‘Almerian-Oran jet’ (Millot 1999) (Fig. 1).
The effects of the Pleistocene glaciations together with the circulation patterns described above for the Atlantic and the Mediterranean have been suggested to be responsible for a major biogeographical break between the two regions. Results, however, are not conclusive since the extent of the differentiation varies across species. Indeed, some species such as the seabream Diplodus puntazzo
(Bargelloni et al. 2005), the sea bass Dicentrarchus labrax
(Lemaire et al. 2005), the cuttlefish Sepia officinalis (Pérez-Losada et al. 2002) and the sponge Crambe crambe (Duran
et al. 2004) show high levels of genetic differentiation between Atlantic and Mediterranean populations, while others like the damselfish Chromis chromis (Domingues
et al. 2005), the seabream Diplodus sargus (Bargelloni et al. 2005; Domingues et al. 2007a), the wrasse Thalassoma pavo
(Costagliola et al. 2004) and the Norway lobster Nephrops norvergicus (Stamatis et al. 2004) show no genetic partition between the Atlantic and the Mediterranean.
The phylogeographical patterns of Atlantic–Mediterranean fishes described in recent studies have revealed genetic signatures of the effects of Pleistocene glaciations on the different populations. Incidentally, these patterns are consistent with transport of eggs and larvae that are possible with the current regime described for these water masses. Warm-water species such as Tripterygion delaisi
(Domingues et al. 2007b), Chromis chromis/ Chromis limbata
(Domingues et al. 2006) and Parablennius sanguinolentus/ Parablennius parvicornis (Almada et al. 2005) show two groups of populations: one including the Mediterranean and adjacent European Atlantic coast and another that comprises the western coast of Africa and the Macaronesian islands. According to the studies mentioned above, this dual pattern can be explained by local extinctions at the time of the glacial peaks in the more affected regions (Azores, Canaries and European Atlantic coast) followed by postglacial colonization from warmer refugia such as Madeira and the tropical coast of Africa, in the case of the Azores, and the southern regions of the Mediterranean, in the case of the Atlantic Europe. The differentiation between these two groups is not only supported by molecular diver-gences but also by differences in morphologic characters.
P. parvicornis/P. sanguinolentus differ in the number of spines in the dorsal fin, presence or absence of extra teeth in the upper jaw and pigmentation (Almada et al. 2005 and references therein). Although the two groups of T. delaisi
3594 V . S . D O M I N G U E S E T A L .
have not been described as distinct species, differences in the number of rays of the second dorsal, and in the number of scales in the lateral line have been described, as well as colour and behavioural variation between the two forms (Domingues et al. 2007b and references therein). Interest-ingly, cool-water species such as Liphophrys pholis (Stefanni
et al. 2006) and Parablennius ruber (Almada et al. 2007) seem to have been able to survive the cooler periods in the Azores. In the case of L. pholis, the Azorean population shows a strong genetic differentiation that is accompanied by meristic differences in the number of rays of the dorsal and anal fins (Stefanni et al. 2006).
Coryphoblennius galerita (Linnaeus 1758), the single member of its genus, is a small benthic fish living in exposed rocky shores in the littoral zone (Zander 1986). The species is
present in the eastern Atlantic (from the southwestern coast of Britain to Cape Juby in the Saharian coast, including the Azores, Madeira and Canary Islands) and in the Mediterranean including the Black Sea (Zander 1986; Quéro et al. 1990; Falcón et al. 2002). This species breeds from spring to summer in the Atlantic, although the extent of the breeding season varies with latitude (Almada et al. 1996). In the Mediterranean, breeding can also take place in winter (Richtarski & Patzner 2000). Females spawn demersal eggs that are cared for by the males until hatching (Almada
et al. 1983; Milton 1983). Dispersal is restricted to the planktonic larval phase of about 26–27 days (Raventós & Macpherson 2001). The large distribution range of C. galerita,
together with its limited dispersal ability, suggests the existence of population structure for this species. Bath (1978),
Fig. 1 Coryphoblennius galerita’s sampling locations. Samples were collected in the Atlantic archipelagos of Azores (Fayal, Azo); Madeira
(Madeira, Mad) and Canaries (Tenerife, Can); in Plymouth (England, Ply); and in the Atlantic coast of Portugal in C. Mundo (CM), S. Pedro (SP) and Luz. Samples from the Mediterranean were collected from Cape of Gata (CG), Spain; Chioggia (Chi), Italy; Rovinj (Rov), Croacia; and one location in Lebanon (Leb). Numbers of individuals sequenced for each of the markers are shown in the table. Arrows indicate major current flow patterns. The Canaries Current is indicated by ‘CC’, the Gibraltar Strait is indicated by ‘GS’ and the Almeria-Oran jet′ is indicated by ‘AOJ’.
G E N E T I C D I V E R G E N C E O F C O R Y P H O B L E N N I U S G A L E R I T A 3595
based on morphological data (fin rays and colouration), found differences in the Atlantic and Mediterranean populations, and also between fishes from Madeira and Canaries. Indeed, Almada et al. (2005), in a study of the phylogeny of the northeastern Atlantic and Mediterranean blenniids, found substantial divergence between conserved mitochondrial DNA (mtDNA) sequences of C. galerita from the Mediterranean and the Atlantic. The same authors also found that in the Atlantic there was a clear genetic diver-gence between mainland shores of Europe and Madeira on one hand and the Azores on the other. However, sample sizes were small and no definitive conclusions were attempted on this issue.
Several factors make the study of C. galerita very promising. It inhabits areas that experienced very distinct glacial effects and differ in present-day ecological and oceanographic conditions. In this study we examined Atlantic and Mediterranean populations of C. galerita, including the eastern Atlantic archipelagos of the Azores, Madeira and Canaries, to assess the levels of genetic divergence of this widely distributed blenniid. Since it is well known that the combined analysis of patterns seen in different loci is very informative when studying spatial and temporal genetic structure (Slatkin & Maddison 1989), we employed three mitochondrial and one nuclear markers with different rates of molecular evolution. Additionally, we combined the molecular survey with an analysis of morphological characters. Judging from the geographical distribution of
C. galerita, which has its northern limit in the southwestern coast of Britain, this species must have been able to survive the cold temperatures of the Pleistocene glaciations in moderately affected regions such as the Azores Islands. We thus expect the distribution of C. galerita genetic diversity to conform to the scenario described for the cooler-water species, where strong genetic differentiation between populations is found. This may also be accompanied by some degree of morphological differentiation. This is one of the first studies to apply a comparative analysis of molecular and morphological traits to a cool-water species. We believe that this approach will shed light on the evolu-tionary history of the species and will also contribute to the elucidation of the biogeographical scenarios that are now emerging for the northeastern Atlantic and the Mediterranean.
Materials and methods
Sampling
A total of 132 Coryphoblennius galerita were collected from seven locations in the Atlantic and four locations in the Mediterranean (Fig. 1). Samples were collected in tide-pools using hand nets. Fin clips were cut immediately after collection of the individuals and stored at ambient temperature in 95% ethanol.
Molecular analysis
DNA extraction, amplification and sequencing. Total genomic DNA was extracted by SDS proteinase K procedure and purified by standard chloroform and isopropanol precipitation (Sambrook et al. 1989). Fragments of the conserved 12S and 16S ribosomal DNA (rDNA) mitochondrial genes were amplified for a subset of our samples using primers and polymerase chain reaction (PCR) conditions described in Almada et al. (2005). Amplification of the 5′ hypervariable portion of the mitochondrial control region (also called D-loop) was performed for a larger number of individuals, using primers and PCR conditions described in Ostellari
et al. (1996). In addition, we amplified the first intron of the S7 ribosomal protein gene, using primers S7RPEX1F and S7RPEX2R (Chow & Hazama 1998), and an annealing temperature of 56 °C. After purification following the manufacturer’s protocol (Applied Biosystems), direct sequencing was performed with an ABI 3100 automated sequencer (Applied Biosystems).
For the first intron of the S7 ribosomal protein gene, the two strands of each individual were recovered using one of two methods. (i) For the individuals that showed hetero-zygous indels, we used double peaks in chromatograms generated as artefacts in the vicinity of the heterozygous indels to identify the specific sequences present in individual strands, following the approach described by Sousa-Santos et al. (2005). (ii) Both strands of the individuals that did not possess heterozygous indels, but that showed heterozygous positions, were recovered using a set of specific amplifications. Heterozygous positions were identified as double peaks in the chromatograms obtained with S7RPEX1F and S7RPEX2R primers, and specific primers were designed for the amplification of only one of the sequences of each individual. The last base of each of these primers consisted of one of the bases in the first or last heterozygous positions of the individual. Amplifications were then made using the specific primer in combination with S7RPEX1F or S7RPEX2R under high annealing temperatures in order to assure specificity. A total of 14 primers were required to obtain the two strains of all the individuals (primer sequences and PCR conditions available from authors upon request). Direct sequencing was then performed using S7RPEX1F or S7RPEX2R primers.
DNA sequences and phylogenetic analyses. Sequences were aligned using the program clustal v (Higgins et al. 1991) implemented by sequence navigator (Applied Biosystems). Diversity indexes were calculated using the software package arlequin (version 2.000; Schneider et al. 2000). The computer program modeltest version 3.7 (Posada & Crandall 1998) was used to determine a model of sequence evolution that best fitted each gene. The Akaike Information Criterion (AIC) was chosen since it yields more reliable
3596 V . S . D O M I N G U E S E T A L .
results (Posada & Buckley 2004). Phylogenetic relationships within C. galerita were assessed using Bayesian inference, performed in mrbayes 3.0b4 (Huelsenbeck & Ronquist 2001). The blenniid Lipophrys trigloides was used as outgroup. The data set was divided into four gene partitions (12S, 16S, D-loop and S7), which were assigned separate (unlinked) parameters to accommodate gene-specific differences in evolutionary rate. The general model selected by modeltest was used for the analysis, allowing mrbayes to estimate the parameters in that model. The general-time-reversible (GTR) model with equal rates was chosen for 12S and 16S and the GTR model with gamma rates was used for D-loop and S7. Monte Carlo Markov chains were run for 5000 000 generations saving a tree every 100 generations. To help ensure that stationarity was reached, we discarded the first 15 000 generations (150 sampled trees) as burn-in and used the remaining 4985 000 genera-tions (49 850 sampled trees) in all subsequent analysis. A majority-rule consensus tree calculated from the 49 850 remaining trees was constructed and used to determine the posterior probabilities of clades. Phylogenetic trees were also obtained using the mitochondrial and the nuclear sequences separately.
Gene flow and population structure. Individuals were grouped forming five samples (see Fig. 1): Azores, Madeira, Canaries, Portugal (including samples from C. Mundo, S. Pedro, Luz and also the sample from Plymouth) and western Mediterranean (C. Gata). Samples from the re-maining locations of the Mediterranean belonged to the eastern basin and were only included in the phylogenetic analysis. Gene flow (FST) between the five locations was estimated. Corrections for simultaneous multiple comparisons were applied using sequential Bonferroni correction (Rice 1989). Population structure was determined by an analysis of molecular variance (amova; Excoffier et al. 1997) using the program arlequin (version 2.000; Schneider et al. 2000). Population average pairwise differences were estimated and results were visualized using a multidimensional scaling analysis implemented by statistica(version 7.0; Statsoft Inc.). These analyses were performed for a combined dataset including the two slow evolving mitochondrial genes (12S and 16S rDNA) and for the D-loop and S7 intron separately.
Historical demography. Sequences were pooled forming three groups of populations (Group 1, Azores; Group 2, Madeira, Canaries and Portugal; Group 3, Mediterranean) according to the phylogeny results. The historical demo-graphy of the three populations was examined using mismatch distributions analysis performed in arlequin 2.0. Theoretical studies have shown that populations in long stable demographic equilibrium show a chaotic mismatch distribution, while rapid population expansions
or bottlenecks are reflected in a unimodal (approximately Poisson) profile (Rogers & Harpending 1992; Rogers 1995). Mismatch distributions were established and their fit to Poisson distributions was assessed by Monte Carlo simulations of 1000 random samples. The sum of square deviations (SSD) between observed and expected mismatch distributions was used as a test statistics, its P value representing the probability of obtaining a simulated SSD larger or equal to the observed one (Schneider & Excoffier 1999). The parameters of the expansion θ0,θ1, and τ were estimated and the time of the expansion (t) was estimated using the formula τ = 2tµ, where µ is the mutation rate. In the absence of an estimate of µ for the mitochondrial control region of blenniids, we used µ = 8.24 × 10⁻⁸ that
was estimated using an internally calibrated molecular clock for two pomacentrid sister species separated by the closure of the Isthmus of Panama (Domingues et al. 2005). We did not attempt to estimate the time of the expansion using the S7 intron data, since there is not any estimation of the mutation rate of this intron.
In addition, Tajima’s D neutrality test (Tajima 1989) was used to detect possible population expansions.
Morphological analysis
Measurements. A total of 84 fish were measured: 25 from
Azores; 11 from Madeira; 21 from Canaries; 11 from C. Mundo (Portugal) and 16 from the Mediterranean. A total of 18 measurements were taken for each fish, using callipers to a precision of 0.1 mm: total length (TL); standard length (SL); head length (HL, from the tip of the snout to the rear edge of the opercular bone); snout length (SnL, pre-orbital); pre-anal length (PreAL, from the tip of the snout to the base of the first ray of the anal fin); predorsal length (PreDL), ibidem to the base of the first ray of the dorsal (fin); length of the ventral fin (LV, from the base to the end of the longest ray); length of the pectoral fin (LP, from the base to the end of the longest ray); head height (HH, measured at the level of the opercular bone); pre-orbital width (PreOW); eye diameter (YD); body width at the insertion of the pectoral fin (WIP); body width at the level of the anus (WA); body height at the insertion of the pectoral fin (HIP); mouth perimeter (MP); mouth width (MW); crest width (CW, measured at the base of the crest); crest height (CH). The number of rays of the different fins was also counted. Sex was determined by direct observation of the genital papilla.
Statistical analysis. To compare the populations discriminant
analysis was performed on the residuals obtained from log-log regressions of each continuous measure over the standard length. upgma cluster analysis was used to build a phenogram based on the Squared Mahalanobis Distances obtained in the discriminant analysis. upgma cluster
G E N E T I C D I V E R G E N C E O F C O R Y P H O B L E N N I U S G A L E R I T A 3597 analysis was conducted using the phylip software package
(Felsenstein 1989). As crest width and height residuals were the features with the highest contribution to the separation of populations, they were separately analysed using anova with the Tukey HDS test for post hoc comparisons among populations. Differences on meristic data were tested using actus (Estabrook & Estabrook 1989), a simulation statistic procedure designed to analyse contingency tables that is not limited by the assumptions of conventional χ2 tests and that apart from assessing the
overall significance of the table, allows assessment of the significance of deviations between observed and expected frequencies for each individual cell.
Results
Molecular analysis
DNA sequences and phylogenetics analyses. A total of 61 12S
rDNA sequences, 66 16S rDNA sequences, 108 D-loop sequences and 218 S7 first intron sequences (corresponding to 109 individuals) were obtained (Fig. 1). Some of the 12S and 16S sequences were available in GenBank (accession nos: AY098816–AY098816 and AY098749–AY098755). The remaining sequences were registered in GenBank (accession nos: EF520774–EF520790, EF521602–EF521813 and EF527585– EF527802). The 12S and 16S rDNA sequences were 395-bp and 568-bp long, respectively, and no gaps were required for their alignment. Ribosomal DNA (12S) sequences showed a total of eight polymorphic sites, while 32 polymorphic sites were found for 16S rDNA sequences. Sequences of the mitochondrial control region showed a complex pattern composed by sequence motifs of variable length, which were repeated several times. The motif TATATGTACTA was found in every sequence. However, variations of this motif were found to be characteristic of each geographical
region. Sequences from the Mediterranean were composed by a variable number of TATATGTACTAGG repeats, while the motif TATATGTACTATACAC was only found in the Azores and the motif TATATGTACTATACAG-TATATGTATGGGTACA was characteristic of Portugal, Canaries and Madeira. These motifs occurred in the central region of the sequences and, because of the variable times that they are repeated, the alignment was very difficult. Thus, we opted to exclude the central region of the sequences and decided to base our analysis on the remaining 312 bp. For the first intron of the S7 ribosomal protein gene, a fragment of 636 bp was obtained. There was one fixed difference between Mediterranean and Atlantic individuals and 76 heterozygous positions. Of these, 73 positions were only heterozygous in individuals from the Atlantic or the Mediterranean and the remaining three showed heterozygosity in the two locations.
Diversity indexes based on the four genes sequences are shown in Table 1. The Bayesian phylogeny built using the combined dataset of the four genes shows the existence of two strongly supported monophyletic groups, one including the Mediterranean samples and another comprehending the Atlantic haplotypes (Fig. 2). Within the Atlantic group, Azores haplotypes cluster together in a strongly supported monophyletic clade, while another very well-supported clade groups fish from mainland Portugal, England, Madeira and Canaries. Phylogenetic reconstructions based on the mitochondrial genes only showed the same pattern (Fig. S1, Supplementary material). The tree based on the nuclear intron groups the Atlantic haplotypes in a mono-phyletic clade, which includes the Azorean haplotypes. The haplotypes from the Mediterranean did not form a monophyletic clade (Fig. S2, Supplementary material).
Gene flow and population structure. Gene flow (FST) between
Coryphoblennius galerita locations was determined (Table 2).
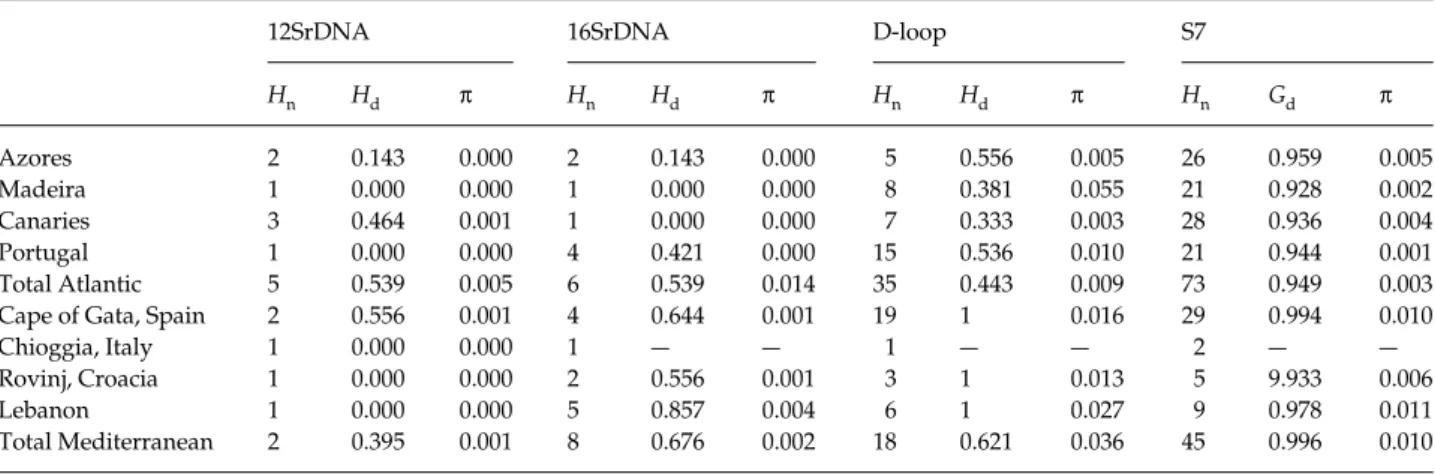
Table 1 Collection localities of Coryphoblennius galerita used in the present study and diversity indexes for 12srDNA, 16SrDNA, D-loop and S7 intro sequences. Number of haplotypes (Hn), haplotype/gene diversity (Hd/Gd), and nucleotide diversity (π) for each population are
shown
12SrDNA 16SrDNA D-loop S7
Hn Hd π Hn Hd π Hn Hd π Hn Gd π Azores 2 0.143 0.000 2 0.143 0.000 5 0.556 0.005 26 0.959 0.005 Madeira 1 0.000 0.000 1 0.000 0.000 8 0.381 0.055 21 0.928 0.002 Canaries 3 0.464 0.001 1 0.000 0.000 7 0.333 0.003 28 0.936 0.004 Portugal 1 0.000 0.000 4 0.421 0.000 15 0.536 0.010 21 0.944 0.001 Total Atlantic 5 0.539 0.005 6 0.539 0.014 35 0.443 0.009 73 0.949 0.003
Cape of Gata, Spain 2 0.556 0.001 4 0.644 0.001 19 1 0.016 29 0.994 0.010
Chioggia, Italy 1 0.000 0.000 1 — — 1 — — 2 — —
Rovinj, Croacia 1 0.000 0.000 2 0.556 0.001 3 1 0.013 5 9.933 0.006
Lebanon 1 0.000 0.000 5 0.857 0.004 6 1 0.027 9 0.978 0.011
3598 V . S . D O M I N G U E S E T A L .
Gene flow between the Mediterranean and all the other locations was very restricted for all the molecular markers.
FST values between the Azores and the other locations were high for the mitochondrial markers, but not for the S7 intron.
The amova based on the mitochondrial markers showed that a high percentage of the total genetic variance was explained by the variance among populations (96.67%, P = 0.000 and 85.06%, P = 0.000 for 12S +16SrDNA and D-loop, respectively) pointing to the existence of population structure Fig. 2 Bayesian phylogeny of Coryphoblennius galerita populations based on sequences from the four genes fragments (12SrDNA, 16SrDNA, D-loop and S7 intron). The dataset was divided into four gene partitions to accommodate gene-specific differences in evolutionary rate. Numbers on branches are posterior probabilities from a consensus tree of all post burn-in topologies visited by the Markov chain. Labels are described in Fig. 1.
G E N E T I C D I V E R G E N C E O F C O R Y P H O B L E N N I U S G A L E R I T A 3599
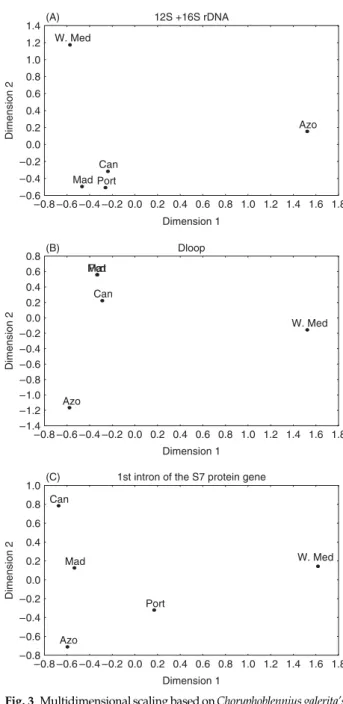
for C. galerita. However, for the S7 intron 56.40% (P = 0.000) of the total variation was due to variation within populations. Population average pairwise differences were estimated and results were visualized using a multidimensional scaling diagram (Fig. 3). According to the 12S +16S rDNA and D-loop, the Mediterranean and the Azores appear as very differentiated populations. The Madeira and Canary Islands together with mainland Portugal appear as closely related populations. The picture is slightly different for the S7 intron, as only the Mediterranean appears as a very differentiated population.
Historical demography. Mismatch distributions based
on D-loop and S7 sequences were estimated for three populations (Azores; Madeira + Canaries + Portugal; and western Mediterranean) according to the results obtained in the phylogenetic reconstruction. SSD tests were performed for each population. In the case of the mitochondrial control region, the Azores population is represented by nine sequences only. Thus, the mismatch analysis concerning mitochondrial sequences from the Azores must be viewed with caution and only as an exploratory tool to inspect the data. Despite the mismatch distributions of the Mediterranean population were not unimodal (Fig. 4), the model of sudden expansion was not rejected for any of the populations (Table 3). Tajima’s D values were significantly negative for the group including Madeira, Canaries and Portugal. Mismatch distributions based on the nuclear sequences were not unimodal for the Azores (Fig. 4) and SSD test rejected the model of sudden expansion for this population only (Table 3). However, Tajima’s D values were significantly negative for Azores and the group including Madeira, Canaries and Portugal. The times of the expansion of the Azores and the remaining locations of the Atlantic are more recent than the Mediterranean estimates.
Morphological analysis
A discriminant function analysis using 17 continuous measurements generated a significant model (Wilk’s λ = 0.062, approx. F68.249 = 3.776, P < 0.001). The first two discriminant functions explained 86% of the data variability. The measurements which yielded a significant P value were PreAL, PreDL, PreOW, MW, CH and CW. Except for crest height (CH) and width (CW), measurements did not show a consistent pattern of variation. The anova applied to CH and CW showed significant differences among populations Table 2 FST values for Coryphoblennius galerita populations calculated
from the 12S and 16S rDNA (top table below the diagonal); mitochondrial control region sequences (top table, above the diagonal) and S7 intron (bottom table). Significant P values (P < 0.05) after Bonferroni correction are indicated by an asterisk.
FST values above 0.5 are bolded
Azores Madeira Canaries Portugal W. Med
Azores x 0.544* 0.930* 0.842* 0.856* Madeira 0.984* x 0.261* 0.281* 0.896* Canaries 0.970* 0.071 x 0.023 0.893* Portugal 0.972* 0.002 0.000 x 0.879* W. Med 0.981* 0.977* 0.955* 0.959* x Azores x Madeira 0.007 x Canaries 0.028 0.000 x Portugal 0.014 0.013 0.026 x W. Med 0.596* 0.639* 0.618* 0.633* x
Fig. 3 Multidimensional scaling based on Choryphoblennius galerita’s population average pairwise differences for 12S rDNA +16S rDNA (A); D-loop (B) and first intron of the S7 protein gene (C). In the D-loop graph Madeira and Portugal plots overlap.
3600 V . S . D O M I N G U E S E T A L .
for both morphological characteristics [HC: F(1,2) = 16.947;
P < 0.001 and WC: F(1,2) = 18.835; P < 0.001]. Tukey HDS test for post hoc comparisons based on CW yielded significant results for comparisons of the Mediterranean with all other populations. The same test based on CH yielded significant results for comparisons of Azores against all the populations and also for comparisons of Madeira against all the populations. Crest width differentiates the Mediterranean individuals from all the others, while crest height separates the Azorean and Madeiran individuals from the ones in the remaining locations. Fish from the Azores show a high and wide crest, while Mediterranean representatives possess a low and narrow crest (Fig. 5). In
addition, the Mediterranean fish present filaments only on the upper edge of the crest, while in the Atlantic the filaments occur around the entire crest (Fig. 5). Overall classification success was approximately 86%, with the Azores and the Mediterranean showing values above 90%. Figure 6 depicts the placement of the five populations in the two dimensional space defined by the first two discriminant functions. The Mediterranean is separated from the other populations. The Azores is somehow differentiated, being closer to Madeira than to the other locations. The Canary Islands and Portugal show a close connection. Figure 7 shows the phenogram based on the Squared Mahalanobis Distances resulting from the Fig. 4 Mismatch distributions of
Coryphoblennius galerita D-loop and S7
intron haplotypes. The bars represent the observed frequency of the pairwise differences among haplotypes, while the line shows the expected curve predicted for a population that has undergone a demographic expansion in the past.
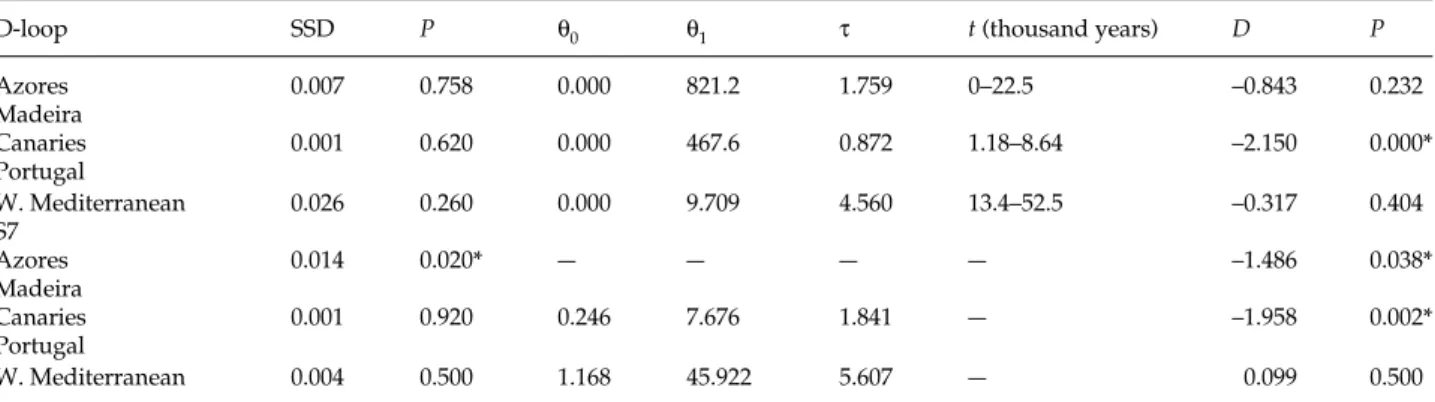
Table 3 Estimated values for the expansion model for each population: SSD (sum of square deviations) and its probability P; θ0 and θ1
(compound parameter representing the mutation rate and the female effective population size before and after expansion, respectively); and τ (time in generations). The time of the expansion (t, in thousand years) is also presented. Tajima’s D neutrality test and its probability
P. Significant P values (P < 0.05) are indicated by an asterisk
D-loop SSD P θ0 θ1 τ t (thousand years) D P
Azores 0.007 0.758 0.000 821.2 1.759 0–22.5 –0.843 0.232 Madeira Canaries 0.001 0.620 0.000 467.6 0.872 1.18–8.64 –2.150 0.000* Portugal W. Mediterranean 0.026 0.260 0.000 9.709 4.560 13.4–52.5 –0.317 0.404 S7 Azores 0.014 0.020* — — — — –1.486 0.038* Madeira Canaries 0.001 0.920 0.246 7.676 1.841 — –1.958 0.002* Portugal W. Mediterranean 0.004 0.500 1.168 45.922 5.607 — 0.099 0.500
G E N E T I C D I V E R G E N C E O F C O R Y P H O B L E N N I U S G A L E R I T A 3601
discriminant analysis. According to these distances, the Mediterranean is well differentiated from the other populations. Azores/Madeira and Canaries/Portugal are morphologically close to each other. The results of the analysis of contingency tables of the meristic data are shown in Table 4. Although some values differed significantly from a random distribution, the distribution of the number of rays does not follow a geographical pattern.
Discussion
This study clearly supports the existence of two clades of Coryphoblennius galerita: one in the Mediterranean and another in the eastern Atlantic. The eastern Atlantic group is subdivided in two subgroups: Azores; and the group formed by Madeira, Canaries and mainland Portugal (including also the sample from England). The Mediterranean differentiation is strongly supported by all molecular markers. Even the samples from the eastern basin clearly fell in the same clade. According to the mitochondrial markers, the Azores is also clearly differentiated from the other Atlantic locations. Interestingly, 12S and 16S rDNA
uncorrected p distances between Atlantic and Mediterranean populations of C. galerita (1.3% and 3.3%, respectively) and between the Azores and the remaining locations of the Atlantic (1.0% and 3.0%, respectively) are very similar, and Fig. 5 Diagramatic representation of the crest of Coryphoblennius
galerita from the Azores (A) and the Mediterranean (M).
Table 4 Results of the analysis of contingency tables of the meristic data from Coryphoblennius galerita. The first value is the number of times that the simulated values did not exceed the observed ones. The second value is the number of times that the observed values did not exceed the simulated ones. Significant P values (< 0.05) are indicated by an asterisk
2nd dorsal fin (χ2 = 167.507, d.f. = 8, P < 0.001) Number of rays Anal fin (χ2 = 46.664, d.f. = 12, P < 0.001) Number of rays 15 16 17 16 17 18 19 Azores 1000/0* 985/24* 0/1000* 524/716 809/271 156/928 823/539 Madeira 1000/1* 994/16* 0/1000* 385/803 757/333 533/639 551/1000 Canaries 860/477 983/32* 16/995* 272/878 347/742 975/46* 541/1000 Portugal 0/1000* 5/995* 1000/0* 874/155 761/266 47/965* 664/488 Mediterranean 485/1000 969/54 96/936 10/1000* 15/997* 1000/0* 823/539
Fig. 6 Representation of the five Coryphoblennius galerita populations in the two dimensional space defined by the first two discriminant functions of a discriminant analysis including 17 continuous morphological measurements.
Fig. 7 Phenogram based on the Squared Mahalanobis Distances resulting from the discriminant analysis using 17 continuous morphological measurements of Coryphoblennius galerita. The phenogram was estimated using the upgma cluster analysis.
3602 V . S . D O M I N G U E S E T A L .
in some cases even higher, than the distances between several closely related blenniid species pairs (Almada et al. 2005; Carreras-Carbonell et al. 2005; Stefanni et al. 2006). Although the genetic differentiation of the Azores population was very clear according to the three mitochondrial markers, this differentiation was not detected with the nuclear intron. This is not surprising since lack of recombination in the mitochondrial DNA makes the whole genome a single genetic entity. Moreover, since mtDNA is haploid and only maternally inherited, mitochondrial genes have a fourfold lower effective population size than the nuclear ones, which makes fixation of mutations much slower in the nuclear genes.
The amova analysis also reveals a major barrier between Mediterranean and Atlantic populations of C. galerita. Indeed, individuals from Cape of Gata, in the western Mediterranean, and those from the western coast of Portugal, despite being geographically close, show distinct mito-chondrial and nuclear genotypes and a very restricted gene flow. When the patterns derived from the nuclear and mitochondrial markers are combined, the picture that emerges is one that involves a major split between Mediterranean and Atlantic populations, with some separation, although less marked, between the Azores and the group formed by mainland Portugal, Madeira and Canaries. Interestingly, this is also supported by the analysis of morphological characters (crest height and width). While crest width distinguishes two groups (Mediterranean from all the Atlantic fish) with a minimum in the Mediterranean and a maximum at Azores, crest height separates fish from Azores and Madeira from all the others, showing a minimum in the Mediterranean and a maximum at Azores. Bath (1978), using meristic characters and colour patterns, had already noted a clinal variation in C. galerita from the eastern end of the Mediterranean to the oceanic islands.
Taken together, the results presented above suggest the existence of an effective barrier that prevents gene flow between Mediterranean and Atlantic populations of C. galerita. Several studies have proposed the Gibraltar Strait or/and the ‘Almerian-Oran jet’ as barriers to gene flow in different marine organisms (e.g. Pérez-Losada et al. 2002; Duran
et al. 2004; Bargelloni et al. 2005; Lemaire et al. 2005). The
connection between the Atlantic and the Mediterranean is known to has been severely reduced or even closed in the region of the Gibraltar Strait during the Quaternary because of sea-level fluctuations (Bianco 1990). This could have promoted the isolation of the two basins with subsequent genetic divergence. On a shorter timescale, the complex pattern of gyres and eddies of the Alboran sea can constitute an effective physical barrier to small coastal fish like C. galerita, whose dispersal is restricted to the planktonic larval phase. On the other extreme, high levels of gene flow were found between the western coast of Portugal and the archipelagos of Madeira and Canaries. The Canaries
current can assure the transport of larvae between these locations. It is interesting to note that the breeding season of C. galerita along the Portuguese coast lasts from March to September (Almada et al. 1996), which coincides with upwelling events in the Atlantic coast. This phenomenon is due to strong northwestern winds that, once reaching the coast, create offshore currents flowing to southwest. Larvae from the Atlantic coast of Portugal can then be easily pushed offshore joining the Canaries current that might promote their mixing with larvae from the islands. Thus, the population of Madeira is likely to have contribu-tions from sources more to the north, namely southwestern Europe, together with fish persisting locally. It is well known that there are transport mechanisms capable of carrying fish larvae from Madeira to the Azores (Santos
et al. 1995). This transport, even if sporadic, would prevent
a complete isolation of the Azorean populations, explaining why, despite the great geographical isolation of the archipelago, the differentiation of the Azorean fish from those of the remaining Atlantic sites is less marked than that between the Cape of Gata and Portuguese fish, which are separated by a much shorter distance. Another explanation for this discrepant levels of genetic differentiation can be that gene flow between Atlantic and the Mediterranean popu-lations has been reduced for a longer period than gene flow between Azores and the remaining locations in the Atlantic. The Pleistocene glaciations have been shown to have a great effect in the geographical distribution of the genetic diversity of the Atlantic warm-water species. Cooling during glacial peaks has been thought to have caused local extinctions and latitudinal shifts of the marine fauna of the region (Almada et al. 2001; Schiebel et al. 2002; Domingues
et al. 2006, 2007). Our data reveal no signs of regional
extinctions, since genetic diversity is high in all populations studied. The Azorean population in particular shows a strong degree of genetic differentiation, at least for the mitochondrial markers, showing the long-term persistence of the population. Although not drastic, the effects of Pleis-tocene glaciations on the demographic history of C. galerita populations were felt, at least in some regions. The historical demography of the species reveals that the Azores and the remaining populations of the Atlantic experienced an expansion at about the same time (between 0 and 22 500 years in the case of the Azorean population and 1180–8640 years in the case of Madeira, Canaries and Portugal). This time frame roughly coincides with the Younger Dryas (YD) at about 12 000 years, when, although already after the last glacial maximum (LGM), a large-scale cooling occurred (Lambeck et al. 2002).
It is interesting to note the emergence of two biogeo-graphical patterns when considering Atlantic/Mediterranean marine fauna. Warm-water species, such as Tripterygion
delaisi (Domingues et al. 2007b), Chromis limbata/Chromis chromis (Domingues et al. 2006) and Parablennius parvicornis/
G E N E T I C D I V E R G E N C E O F C O R Y P H O B L E N N I U S G A L E R I T A 3603
Parablennius sanguinolentus (Almada et al. 2005) show two
groups of populations: one including the Mediterranean and the Atlantic coast of western Europe and another encompassing the western tropical coast of Africa and the Atlantic islands of the Azores, Madeira and Canaries. On the other hand, cold resistant species such as C. galerita and
Lipophrys pholis (Stefanni et al. 2006) show an accentuated
differentiation of the Azorean population, and, in the case of
C. galerita, a clear divergence between Mediterranean and
western European individuals (L. pholis does not form stable populations in the Mediterranean; Zander 1986). Similarly, the clade Symphodus trutta and Symphodus caeruleus, which belongs to a temperate genus, shows that the Azorean population acquired enough distinctive characters to be placed in a different species (S. caeruleus) when compared to fish from Madeira and Canaries (S. trutta; Almada et al. 2002). It is very likely that S. caeruleus ancestors persisted in the Azores during the glaciations, being able to diverge and accumulate substantial differences. This pattern may reflect the different effects of the Pleistocene glaciations on fishes with different thermal tolerances. Less tolerant species must have become extinct in some regions where sea-surface temperatures were seriously reduced. These regions include the western coast of Portugal, the eastern islands of the Canary archipelago, and, to a lesser extent, the Azores. Recolonization of these locations may have been possible in the last 10 000 years, from less affected regions, namely the western tropical coast of Africa and Madeira Islands in the case of the Azores and the western Canaries and the southwestern Mediterranean in the case of the Atlantic shores of Iberia (Almada et al. 2001; Domingues et al. 2006; Domingues et al. 2007b). This different postglacial colonization routes would explain the lack of differentiation between Portuguese and western Mediterranean populations on one hand and also the homogeneity among Azorean, Canarian and Madeiran populations and their affinities with western Africa, on the other. The scenario outlined above fits well all the available data for warm-water species but is unlikely to hold for species that tolerate cooler waters, like C. galerita. Populations of these species might have persisted during the Pleistocene cooling episodes at the less affected areas, including the Azores. Thus, it is not surprising that these species show clear signs of population differentiation in the more isolated locations such as the Azores archipelago and the Mediterranean Sea. Although the shores of southwest Europe were seriously affected at the glacial maxima, causing a likely local extinction of C. galerita, the tolerance of the species to relatively cold waters may have allowed its survival in the shores of northwest Africa, from which they could have easily re-invaded Europe.
Our study is one of the first to combine morphological and molecular markers, and to apply molecular markers of different natures (mitochondrial and nuclear) and with
variable rates of molecular evolution to the study of the relationships of the Atlantic and Mediterranean populations of a cool-water species. It is well known that an accurate investigation of spatial and temporal genetic structure should consider the variety of patterns seen in different loci, because of the stochastic effect of genetic drift in gene frequencies of each locus (Slatkin & Maddison 1989). Moreover, because the phylogenetic tree derived from a single locus may not accurately reflect the history of a species or population (Ball et al. 1990), population structure can only be accurately viewed by the concordance of phylogenetic patterns across several loci (Avise 2000).
More studies on these cool-water species are needed to test the hypothesis that fishes of tropical and temperate affinities differ in their response to the glacial changes that affected the Atlantic–Mediterranean area.
Acknowledgements
We are grateful to several people for providing samples and helping in field work: R. Beldade, A. Frias, J. Robalo, C. Santos, N. Serpa, P. Sordino, R. Patzner and S. Francisco. S. Francisco provided sequences from Portugal. We also thank Estação Marítima do Funchal and Parque Natural de Cabo de Gata-Nijar for field work support. We thank G. Bernardi for helpful suggestions on procedures to recover the two nuclear gene strands of each individual. C. Santos was a great help in analysing chromatograms with double peaks. We are gratefull to N. Monteiro for provid-ing Fig. 5. Vera S. Domprovid-ingues has a doctoral fellowship from the Portuguese Foundation for Science and Technology (FCT) (SFRH/BD/13069/2003). Sergio Stefanni is a postdoctoral fellow funded by FCT (SFRH/BPD/14981/2004). Research at ISPA-UIE (UI & D #331/94) and IMAR-DOP/UAz (UI & D #531 and LA#9) are funded by FCT through pluri-annual and programmatic funding schemes (FEDER). IMAR-DOP/UAz research is also granted by DRCT. This study was also funded by the FCT research grant PNAT/BIA/15017/99. This paper is also a contribution to MarBEF (Network of Excellence: ‘Marine Biodiversity and Ecosystem Functioning’ — contract nr. GOCE-CT-2003–505446).
References
Almada VC, Dores J, Pinheiro A, Pinheiro M, Santos RS (1983) Contribuição para o estudo do comportamento de Coryphoblennius
galerita (L.) (Pisces, Blennidae). Memórias do Museu Bocage,
Série Zoológica 2. Museu Bocage, Lisboa, 1–165.
Almada VC, Carreiro H, Faria C, Gonçalves EJ (1996) The breeding season of Coryphoblennius galerita in Portuguese waters. Journal
of Fish Biology, 48, 295–297.
Almada VC, Oliveira RF, Gonçalves EJ, Almeida AJ, Santos RS, Wirtz P (2001) Patterns of diversity of the northeastern Atlantic blennid fish fauna (Pisces: Blenniidae). Global Ecology and
Biogeography, 10, 411–422.
Almada VC, Almada F, Henriques M, Santos RS, Brito A (2002) On the phylogenetic affinities of Centrolabrus trutta and Centrolabrus
caeruleus (Perciforms: Labridae) to the genus Symphodus:
mole-cular, meristic and behavioural evidences. Archipelago, 19A, 85–92.
3604 V . S . D O M I N G U E S E T A L .
Almada F, Almada VC, Guillemaud T, Wirtz P (2005) Phylogenetic relationships of the north-eastern Atlantic and Mediterranean blenniids. Biological Journal of the Linnean Society, 86, 283–295. Almada VC, Domingues VS, Monteiro NM, Almada F, Santos RS
(2007) Molecular data confirm the validity of the Portuguese blenny (Parablennius ruber, Valenciennes, 1836) and its presence in Western Europe. Journal of Fish Biology, 70B, 248–254. Avise JC (2000) Phylogeography. The History and Formation of Species.
Harvard University Press, Cambridge, Massachusetts. Ball RM, Neigel JE, Avise JC (1990) Gene genealogies within the
organismal pedigrees of random-mating populations. Evolution, 44, 360–370.
Bargelloni L, Alarcon JA, Alvarez MC et al. (2005) The Atlantic– Mediterranean transition: discordant genetic patterns in two seabream species, Diplodus puntazzo (Cetti) and Diplodus sargus (L.). Molecular Phylogenetics and Evolution, 36, 523–535. Barton ED, Arístegui J, Tett P et al. (1998) The transition zone of the
Canary Current upwelling region. Progress in Oceanography, 41, 455–504.
Bath H (1978) Geographische variation der körperfärbung und flossenformel von Coryphoblennius galerita (Linnaeus 1758) (Pisces: Blenniidae). Senckenbergiana Biology, 59 (5/6), 317–324. Baus E, Darrock DJ, Bruford MW (2005) Gene-flow patterns in
Atlantic and Mediterranean populations of the Lusitanian sea star Asterina gibbosa. Molecular Ecology, 14, 3373–3382. Bécognée P, Almeida C, Barrera A, Guerra A,
Hernández-León S (2006) Annual cycle of clupeiform larvae around Gran Canaria Island, Canary Islands. Fisheries Oceanography, 15, 293– 300.
Bernardi G (2000) Barriers to gene flow in Embiotoca jacksoni, a marine fish lacking a pelagic larval stage. Evolution, 54 (1), 226– 237.
Bianco PG (1990) Potential role of the palaeohistory of the Mediterranean and Paratethys basins on the early dispersal of Euro-Mediterranean freshwater fishes. Ichthyological Exploration
of Freshwaters, 1, 167–184.
Carreras-Carbonell J, MacPherson E, Pascual M (2005) Rapid radiation and cryptic speciation in mediterranean triplefin blennies (Pisces: Tripterygiidae) combining multiple genes.
Molecular Phylogenetics and Evolution, 37, 751–761.
Chow S, Hazama K (1998) Universal PCR primers for S7 ribosomal protein gene introns in fish. Molecular Ecology, 7, 1247–1263. Costagliola D, Robertson DR, Guidetti P et al. (2004) Evolution of
coral reef fish Thalassoma pavo spp. (Labridae). 2. Evolution of the eastern Atlantic species. Marine Biology, 144, 377–383. Crowley TJ (1981) Temperature and circulation changes in the
eastern north Atlantic during the last 150 000 years: evidence from the planktonic foraminiferal record. Marine Micropaleontology, 6, 97–129.
Dias JA, Rodrigues A, Magalhães F (1997) Evolução da linha de costa em Portugal, desde o último máximo glaciário até à actualidade: síntese dos conhecimentos. Estudos Do Quaternário, 1, 53–66. Doherty PJ, Planes S, Mather P (1995) Gene flow and larval duration
in seven species of fish from the Great Barrier Reef. Ecology, 76, 2373–2391.
Domingues VS, Bucciarelli G, Almada VC, Bernardi G (2005) Historical colonization and demography of the Mediterranean damselfish, Chromis chromis. Molecular Ecology, 14, 4051–4063. Domingues VS, Santos RS, Brito A, Almada VC (2006) Historical
population dynamics and demography of the eastern Atlantic pomacentrid Chromis limbata (Valenciennes, 1833). Molecular
Phylogenetics and Evolution, 40, 139–147.
Domingues VS, Almada VC, Santos RS, Brito A, Bernardi G (2007b) Phylogeography and evolution of the triplefin Tripterygion delaisi (Pisces, Blennioidei). Marine Biology, 150, 509–519.
Domingues VS, Santos RS, Brito A, Alexandrou M, Almada VC (2007a) Mitochondrial and nuclear markers reveal isolation by distance and effects of Pleistocene glaciations in the northeastern Atlantic and Mediterranean populations of the white seabream (Diplodus sargus, L.). Journal of Experimental Marine Biology and
Ecology, 346, 102–143.
Duran S, Giribet G, Turon X (2004) Phylogeographical history of the sponge Crambe crambe (Porifera, Poecilosclerida): range expansion and recent invasion of the Macaronesian islands from the Mediterranean sea. Molecular Ecology, 13, 109–122. Estabrook CB, Estabrook GF (1989) actus: a solution to the problem
of small samples in the analysis of two-way contingency tables.
Historical Method, 22, 5–8.
Excoffier L, Smouse PE, Quattro JM (1997) Analysis of molecular variance inferred from metric distances among DNA haplotypes: application to human mitochondrial DNA restriction data.
Genetics, 131, 479–491.
Falcón JM, Brito A, González G (2002) Peces de la laguna de Khnifiss (Sahara, NW África) y de los sectores costeros próximos.
Revista Academia Canaria Ciencias, 14, 139–152.
Felsenstein J (1989) phylip: phylogeny inference package (version 3.2). Cladistics, 5, 164–166.
Higgins DG, Bleasby AJ, Fuchs R (1991) clustal v: improved software for multiple sequence alignment. Cabios, 8, 189–191. Huelsenbeck JP, Ronquist FR (2001) mrbayes: Bayesian inference
of phylogenetic trees. Bioinformatics, 17, 754–755.
Lamb HH (1977) Climate: Present, Past and Future. 2. Climate History
and the Future. Methuen, London.
Lambeck K, Esat TM, Potter E-K (2002) Links between climate and sea levels for the past three million years. Nature, 419, 199–206. Lemaire C, Versini J-J, Bonhomme F (2005) Maintenance of genetic differentiation across a transition zone in the sea: discordance between nuclear and cytoplasmic markers. Journal of Evolutionary
Biology, 18, 70–80.
Malanotte-Rizzoli P, Bergamasco A (1989) The circulation of the Eastern Mediterranean. Part I. Oceanologica Acta, 12, 335–351. Millot C (1999) Circulation in the western Mediterranean Sea.
Journal of Marine Systems, 20, 423–442.
Milton P (1983) Biology of littoral blenniid fishes on the coast of south-west England. Journal of the Marine Biological Association of
the United Kingdom, 51, 247–265.
Molina R, Cabanas JM, Laatzen FL (1996) Corrientes e hidrografía en la región canaria. Campaña Canarias 9205. Boletín Instituto
Españological Oceanografía, 12, 43–51.
Ostellari L, Bargelloni L, Penzo E, Patarnello P, Patarnello T (1996) Optimization of single-strand conformation polymorphism and sequence analysis of the mitochondrial control region in
Pagellus bogaraveo (Sparidae, Teleostei): rationalized tools in fish
population biology. Animal Genetics, 27, 423–427.
Özgökmen TM, Chassignet EP, Rooth CGH (2001) On the connection between the Mediterranean outflow and the Azores current.
Journal of Physical Oceanography, 31, 461–480.
Palumbi RS (1994) Genetic divergence, reproductive isolation, and marine speciation. Annual Review of Ecology and Systematics, 25, 547–572.
Pérez-Losada M, Guerra A, Carvalho GR, Sanjuan A, Shaw PW (2002) Extensive population subdivision of the cuttlefish Sepia officialis (Mollusca: Cepahlopoda) around the Iberian Peninsula indicated by microsatellite DNA variation. Heredity, 89, 417–424.
G E N E T I C D I V E R G E N C E O F C O R Y P H O B L E N N I U S G A L E R I T A 3605 Posada D, Buckley TR (2004) Model selection and model averaging
in phylogenetics: advantages of Akaike Information Criterion and Bayesian approaches over likelihood ratio tests. Systematic
Biology, 53 (5), 793–808.
Posada D, Crandall KA (1998) modeltest: testing the model of DNA substitution. Bioinformatics, 14 (9), 817–818.
Quéro JC, Hureau JC, Karrer C, Post A, Saldanha L (1990) Check-List
of the Fishes of the Eastern Tropical Atlantic. JNICT, Lisbon, Portugal.
Raventós N, Macpherson E (2001) Planktonic larval duration and settlement marks on the otoliths of Mediterranean littoral fishes.
Marine Biology, 138, 1115–1120.
Rice (1989) Analyzing tables of statistical tests. Evolution, 43, 223– 225.
Richtarski U, Patzner RA (2000) Comparative morphology of male reproductive systems in Mediterranean blennies (Blenniidae).
Journal of Fish Biology, 56, 22–36.
Riginos C, Nachman MW (2001) Population subdivision in marine environments: the contributions of biogeography, geographical distance and discontinuous habitat to genetic differentiation in a blennioid fish, Axoclinus nigricaudus. Molecular Ecology, 10, 1439–1453.
Rodríguez JM, Hernández-León S, Barton ED (1999) Mesoescale distribution of fish larvae in relation to an upwelling filament off Northwest Africa. Deep-Sea Research, I (46), 1969–1984. Rogers AR (1995) Genetic evidence for a Pleistocene population
explosion. Evolution, 49, 608–615.
Rogers AR, Harpending H (1992) Population growth makes waves in the distribution of pairwise genetic differences.
Molecular Biology and Evolution, 93, 552–569.
Sambrook J, Fritsch EF, Maniatis T (1989) Molecular Cloning: A
Laboratory Manual, 2nd edn. Cold Spring Harbor Laboratory
Press, New York.
Santos RS, Hawkins S, Monteiro LR, Alves M, Isidro EJ (1995) Marine research, resources and conservation in the Azores. Aquatic
Conservation: Marine and Freshwater Ecosystems, 5, 311–354.
Schiebel R, Schmuker B, Alves M, Hemleben C (2002) Tracking the recent and late Pleistocene Azores front by the distribution of planktic foraminifers. Journal of Marine Systems, 37, 213–227. Schneider S, Excoffier L (1999) Estimation of past demographic
parameters from the distribution of pairwise differences when the mutation rates vary among sites: application to human mitochondrial DNA. Genetics, 152, 1079–1089.
Schneider S, Roessli D, Excoffier L (2000) ARLEQUIN, Version 2.000: A
Software for Population Genetics Data Analysis. University of Geneva,
Switzerland.
Shulman MJ, Bermingham E (1995) Early live histories, ocean currents, and the population genetics of Caribbean reef fishes.
Evolution, 49, 897–910.
Slatkin M, Maddison WP (1989) A cladistic measure of gene flow inferred from the phylogenies of alleles. Genetics, 123, 603–613. Sousa-Santos C, Robalo IJ, Collares-Pereira MJ, Almada VC (2005) Heterozygous indels as useful tools in the reconstruction of DNA sequences and in the assessment of ploidy level and genomic constitution of hybrid organisms. DNA Sequence, 16, 462–467. Stamatis C, Trianfylidis A, Moutou KA, Mamuris Z (2004)
Mitochondrial DNA variation in Northeast Atlantic and Medi-terranean populations of Norway lobster, Nephrops norvegicus.
Molecular Ecology, 13, 1377–1390.
Stefanni S, Thorley JL (2003) Mitochondrial DNA phylogeography reveals the existence of an evolutionary significant unit of the sand goby Pomatoschistus minutus in the Adriatic (eastern Mediter-ranean). Molecular Phylogenetics and Evolution, 28, 601–609.
Stefanni S, Domingues V, Bouton N, Santos RS, Almada F, Almada V (2006) Phylogeny of the shanny, Lipophrys pholis, from the NE Atlantic using mitochondrial DNA markers.
Molecular Phylogenetics and Evolution, 39, 282–287.
Stramma L (1984) Geostrophic transport in the warm water sphere of the eastern subtropical North Atlantic. Journal of Marine
Research, 42, 537–558.
Tajima F (1989) The effect of change in population size on DNA polymorphism. Genetics, 123, 597–660.
Taylor MS, Hellberg ME (2003) Genetic evidence for local retention of pelagic larvae in a Caribbean reef fish. Science, 299, 107–109.
Thiede J (1978) A glacial Mediterranean. Nature, 276, 680–668. Zander CD (1986) Blenniidae. In: Fishes of the North-Eastern Atlantic
and the Mediterranean (eds Whitehead PJP, Bauchot M-L, Hureau J-C,
Nielsen J, Tortonese E), pp. 1096–1112. UNESCO, Paris.
Vera Domingues is a PhD student working on the phylogeo -graphy and historical population dynamics of coastal fishes from the Eastern Atlantic and the Mediterranean. Cláudia Faria is a postdoctoral researcher studying ecology, community structure and dynamics of littoral fish. Sergio Stefanni is a postdoctoral researcher studying evolution in fish, focusing on phylogenetic patterns and underlying genetic processes. Alberto Brito is a Professor of Marine Biology and Zoology interested in the Canarian marine biodiversity and conservation. Ricardo S. Santos is a Principal Researcher interested in marine conservation of habitats and biodiversity of both shallow and deep-sea ecosystems of the northeastern Atlantic. Vitor Almada is an Associate professor interested in phylogeography of North Atlantic fishes and Iberian freshwater fishes, as well as in behavioural evolution.
Supplementary material
The following supplementary material is available for this article:
Fig. S1 Bayesian phylogeny of Coryphoblennius galerita populations based on sequences from the mitochondrial fragments (12SrDNA, 16SrDNA and D-loop). The dataset was divided into four gene partitions to accommodate gene-specific differences in evolutionary rate. Numbers on branches are posterior probabilities from a consensus tree of all post burn-in topologies visited by the Markov chain. Labels are described in Fig. 1.
Fig. S2 Bayesian phylogeny of Coryphoblennius galerita populations based on sequences from the first intron of the S7 ribosomal protein gene. Numbers on branches are posterior probabilities from a consensus tree of all post burn-in topologies visited by the Markov chain. Labels are described in Fig. 1.
This material is available as part of the online article from: http://www.blackwell-synergy.com/doi/abs/
10.1111/j.1365-294X.2007.03405.x
(This link will take you to the article abstract).
Please note: Blackwell Publishing are not responsible for the content or functionality of any supplementary materials supplied by the authors. Any queries (other than missing material) should be directed to the corresponding author for the article.