Iolanda Costa Galinha
Universidade Autónoma de Lisboa iolandag@yahoo.com
34 ARTICLE
Cognitive, affective and contextual predictors of
subjective wellbeing
Iolanda Costa Galinha · José Luís Pais-Ribeiro
Abstract: The article analyses the prediction of cognitive, affective and contextual factors to Subjective Wellbeing (SWB). Four different components of SWB were used in order to identify its different predictors. A sample of 303 adult students was collected and reassessed over a two-month interval. Seven instruments were used to measure: Global Subjective Wellbeing; Satisfaction with Life in Domains; Positive and Negative State Affect; Positive and Negative Trait Affect; Standards of Comparison; Depression, Anxiety and Stress; Life Events; and Socio-Demographic variables. Results indicated that Global SWB is predicted by Satisfaction with Life in Domains, and Positive and Negative State Affect. The cognitive dimension of SWB is predicted by Depression, Comparison Standards, State and Trait Affect, and several contextual variables. The affective dimension of SWB is predicted by Trait Affect, Depression, Anxiety, and the contextual variable of educational status. Results also indicated that intrapersonal variables are the main predictors of SWB, however contextual variables are also significant predictors. Each component of SWB (global, cognitive & affective) shows different predictors, stressing the importance of analysing and reporting separately the results of each component. Among the predictors of SWB over a two-month interval, state affective variables and contextual variables lose prediction power, while trait affective and cognitive variables gain prediction power. Keywords: subjective wellbeing; satisfaction with life; positive and negative affect; predictors
1. Introduction
One of the main goals of scientific research in the field of Subjective Wellbeing (SWB) has been to identify the main predictors of human happiness. In the preceding decades, researchers have tried to address the question regarding the main associates of SWB through different approaches: bottom up (emphasising the importance of contextual factors), top down (emphasising the importance of intrapersonal factors), and integrative (emphasising the dynamic contribution of intrapersonal & contextual factors, see Figure 1).
Figure 1. Representation of bottom up, top down and integrative theoretical models of SWB, respectively
However, most studies have not analysed the impact of the different factors combined, and therefore have not determined the relative contribution of each factor to SWB. Researchers defended the importance of analysing several predictors of SWB together, in order to identify the contribution of each above and beyond the others (Diener & Biswas-Diener, 2000). In this study we contribute to the literature by identifying the relative contribution of several cognitive, affective and contextual factors to SWB. The aim of the present study is to identify which perspective – bottom up, top down or integrative – is best supported.
Secondly, several studies on the associates of SWB have used only one measure of SWB, sometimes representing only one dimension of the concept (i.e., cognitive or affective). Several authors have suggested that different measures of SWB have different predictors, and have defended the importance of using several measures of SWB in order to fully understand the phenomenon (Diener, 2000; 2006; Schwarz & Strack, 1999; Sirgy, 2002). In this study we use several measures of SWB – global, specific, cognitive and affective – and identify the main predictors of each measure.
Thirdly, most studies on the predictors of SWB are cross-sectional. Longitudinal studies are rare (Diener & Ryan, 2009) and are most frequently developed in six-month. Some studies have shown differences in the impact of the predictors of SWB in a present context, as well as within a six-month interval. Some studies indicate that contextual factors may be better predictors of SWB in the present, while intrapersonal trait factors may be important predictors of medium- and long-term SWB (Suh, Diener & Fujita, 1996). Could these differences be observed in shorter temporal intervals? In this study we contribute to the literature with data about the factors that best predict SWB in the present, and the factors that best predict SWB over a short-term interval of two months.
Subjective Wellbeing is accepted to be a broad concept, to have a cognitive and an affective dimension, separated and moderately correlated. The construct includes variables such as Satisfaction with Life as a Whole or in Specific Domains, and Positive Affect and Negative Affect (Arthaud-Day, Rode, Mooney & Near, 2005; Diener & Ryan, 2009; Galinha & Pais-Ribeiro, 2008). The concept of SWB can be assessed through different dimensions – cognitive and affective – and different levels of analysis – global and specific – depending on the instruments used; see Table 1 (Diener, 2006; Sirgy, 2002).
SWB Intrapersonal Factors Factors Contextual Intrapersonal Factors Contextual Factors SWB
Table 1: Levels of analysis of Subjective Wellbeing
Cognitive Affective
Global Global Life Satisfaction Global Happiness
Specific Satisfaction with Life in Domains Positive State Affect Negative State Affect
The study of the associates of SWB has been developed in three major stages with different characteristics and objectives (Diener & Biswas-Diener, 2000). A bottom up perspective influenced the first stage of studies on SWB. These studies mainly analysed the impact of contextual factors in the SWB of individuals. The main purpose of this stage was to identify the Socio-Demographic characteristics of happy people. From the bottom up perspective there is a major influence of external life circumstances (e.g. material conditions; life events; socio-political contexts) on the subjective experience of individuals. According to this perspective, adverse circumstances affect SWB (Brief, Butcher, George, & Link, 1993; Feist, Bodner, Jacobs, Miles, & Tan, 1995). However, one of the main findings of this phase was that contextual factors are not the most powerful in explaining the variability of SWB. In most studies, contextual factors such as Socio-Demographic variables and Life Events show only weak or short-term impacts in SWB. Some exceptions are also reported indicating that in some circumstances, contextual factors may have a strong and long-term impact on the SWB of individuals: a) when life conditions decline below a minimum level of satisfaction of human needs (Veenhoven, 1996); b) when some Life Events such as marriage and long-term unemployment are experienced (Helliwell, Barrington-Leigh, Harris, & Huang, 2009; Lucas, Clark, Georgellis, & Diener, 2004); and c) when systematic differences in SWB are observed between poor and rich countries, showing the poorer countries as the least happy in the world (Farid & Lazarus, 2008; Inglehart & Klingemann, 2000).
In the second stage of research about the predictors of SWB there was a development of theoretical models and an emphasis on analysing the contribution of intrapersonal factors to SWB, such as temperament, social comparison, the goal-achievement gap and adaptation (Diener & Biswas-Diener, 2000). A top down perspective influenced the studies of SWB in this stage. Studies tested the hypothesis that the intrapersonal (affective & cognitive) characteristics of individuals determine their SWB (Brief et al., 1993; Feist et al., 1995). Theories postulated that two persons in the same circumstances can evaluate their SWB in different ways. Results indicated that intrapersonal variables are stronger determinants of SWB than contextual factors (see Diener & Ryan, 2009; Diener, Suh, Lucas, & Smith, 1999 for a review). The top down perspective received support from empirical studies throughout the last few decades, placing personality and positive predisposition as main predictors of SWB (see Lucas, 2008 for a review).
Headey and Wearing (1992), however, questioned the validity of both bottom up and top
down models per se and pointed out limitations in both. They suggested that both contextual
and intrapersonal factors have an impact on SWB. Nevertheless, after a period of time the impact of contextual factors (e.g. Life Events) on SWB decreases and individuals return to their original level of SWB, as determined by intrapersonal factors (e.g. personality). Classical and current studies support this rationale and show that through the effect of time, people adapt to
the impact of major Life Events and Socio-Demographic changes (Bonanno, Moskowitz, Papa, & Folkman, 2005; Lowenstein & Frederick, 1999; Silver & Wortman, 1980). Suh, Diener and Fujita (1996) concluded that life events and personality differ in the duration of their effects on SWB. Life events produce a short-term effect (three to six months on average) and personality produces a long-term effect (at least two years) in the variability of SWB. However, as stated before, recent studies suggest that some Life Events (e.g., death of a spouse) produce permanent changes that have a long-term impact on the SWB of individuals and some authors have defended the view that the set point theory may have to be revised (Headey, 2008). Finally, Feist et al. (1995) tested both top down and bottom up models of SWB in a structural equation modelling analysis and concluded that both contributed to explain SWB, but that neither was shown to have a significantly better fit than the other.
In the third stage of research on the predictors of SWB there was a trend of integrating several lines of research into holistic models as a way of understanding the dynamic interaction between several factors of SWB. The integrative perspective defends that SWB is influenced by multiple variables – the individual’s emotional state, past events, the expectations of the future and social comparisons – in a dynamic interaction (Suh, Diener, Oishi, & Triandis, 1998; Schwarz & Strack, 1999). In this stage, the main objectives of studies consist of understanding the psychological processes inherent to the different measures of SWB (Diener & Biswas-Diener, 2000). Several authors have defended the importance of using separate measures of the cognitive, as well as the affective, dimensions of SWB in order to identify different predictors of SWB (Diener, 2000; 2006). Other authors have defended the importance of using separate measures of the positive and negative affective components of SWB because they are independent and yield different relationships with several variables (Diener, 2000; 2006; Fredrickson, 2006). Others yet have defended the importance of analysing several levels of measures of SWB – global and specific – in order to identify SWB’s different predictors (Schwarz & Strack, 1999; Sirgy, 2002).
A few empirical studies show that the different components of SWB have different associates (Jones, Rapport, Hanks, Lichtenberg, & Telmet, 2003; Jovanovic, 2011); that the cognitive dimension of SWB is more closely associated with the contextual variables, and that the affective dimension is more closely associated with personality variables (Schimmack, Schupp & Wagner, 2008). Positive and Negative Affect show distinct yet complementary functions. High Negative Affect is associated with the restriction and focus of thoughts and actions; while, Positive Affect is associated with the broadening of thoughts and actions, allowing the building of long-term personal resources and it also optimizes health (Folkman & Moskowitz, 2000; Fredrickson, 2006; Fredrickson & Branigan, 2005).
Empirical studies on the predictors of the different levels of measurement of SWB (global or specific) show that global measures correlate less with contextual factors than with specific measures - such as Satisfaction of Life in Domains (Diener, 1999). Global measures of SWB show more stability over time and specific measures are more diagnostic, providing understanding about the causes of total SWB (Sirgy, 2002; Diener, 2006). Global measures of SWB require the demanding task of considering satisfaction with several aspects of life resumed in one answer. Because this is a complex task, people may choose to answer in a simpler way, based on their affective state at the moment they are answering the questionnaire. Thus, Satisfaction with Life as a Whole would be more influenced by the affective state of the individual, while Satisfaction with Life in Domains reports would be more influenced by intra- and inter-individual comparisons (Schwarz & Strack, 1999).
The results of Diener, Napa-Scollon, Oishi, Dzokoto and Suh (2000), using both specific and global measures of SWB, reflected mainly bottom up and top down influences, respectively. Examining the factors that are associated with the different levels of measurement of SWB, the authors found that global measures of SWB are more influenced by intrapersonal characteristics, such as individual predisposition. According to Diener and Biswas-Diener (2000), these findings can bring a new understanding of the processes inherent to the variability of SWB. Using several levels of self-reporting measures of SWB simultaneously, we can better understand these processes.
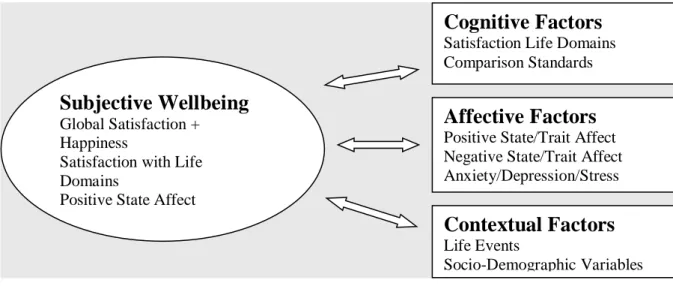
In this study we have three main objectives. The first objective is to analyse the relative contribution of several factors to SWB: intrapersonal (cognitive & affective) and contextual (see Figure 1).
Figure 1: Representation of the relationships between Subjective Wellbeing measures and cognitive, affective and contextual variables
We want to answer the question: which factors contribute above and beyond the other factors to the variability of SWB? We expect that in a conjoint analysis, the intrapersonal factors are the best predictors of SWB. Would the contextual factors show a significant contribution to SWB? The second objective of the study is to analyse the best predictors of the different measures of SWB – global and specific. We want to answer the question: Do global and specific measures of SWB have different predictors? According to the previous literature, global measures are best predicted by affective factors, while specific measures may reflect actual experiences of individuals and be more diagnostic about the causes of SWB.
The third objective of the study is to analyse the effect of time in the contribution of intrapersonal and contextual factors to SWB. Which variables in the present best predict SWB in the near future? Previous studies indicate that contextual variables lose prediction power over time, while personality variables gain prediction power within a six-month interval. Can we observe the same pattern in a shorter time interval?
2. Method
2.1 Participants
We administered the questionnaires to 303 Portuguese adults (professional trainees 39.2%, university students 60.8%) and repeated the application over a two-month interval. At time II, 245 questionnaires were collected, with a retention rate of 80.9%. The participants were
Subjective Wellbeing
Global Satisfaction + HappinessSatisfaction with Life Domains
Positive State Affect Negative State Affect
Cognitive Factors
Satisfaction Life Domains Comparison StandardsAffective Factors
Positive State/Trait Affect Negative State/Trait Affect Anxiety/Depression/StressContextual Factors
Life Eventsbetween 20 and 58 years old; 81.1% were young adults (20 to 40 years old) and 67% were women. In terms of years of education, 25.5% of the participants completed 4 to 9 years of education, 22.5% completed 10 to 12 years, and 42.2% completed 13 to 17 years. The participants in the study volunteered, were not paid, and were informed of the confidentiality and anonymity of their answers in accordance with the ethical standards of the American Psychological Association (APA).
2.2 Materials
2.2.1 Global subjective wellbeing
Global Subjective Wellbeing was measured by Global Happiness and Global Satisfaction single items. We selected the Global Happiness item used by the Gallup Organization of the American Institute for Public Opinion – “In general, how happy would you say you are?” For the Global Satisfaction item, we selected the item used in the Eurobarometer: “On the whole, how satisfied are you with your life?”. We opted for a seven-point scale in order to discriminate minor differences in the levels of Subjective Wellbeing, from: (1) "Extremely Unhappy/Dissatisfied"; to (7) "Extremely Happy/Satisfied” (Andrews & Robinson, 1991). Global Happiness and Global Satisfaction are considered two different measures of Global SWB. Although Happiness and Satisfaction represent, respectively, a more affective or cognitive dimension, in fact, neither of the two are pure markers of each dimension (Andrews & Robinson, 1991). However, the Principal Components Analysis showed that the two items were measuring the same construct; therefore we decided to use the mean of both indicators as a measure of Global SWB (see Table 2). In this study, Global Happiness mean was 5.06 (SD = .97) and Global Satisfaction mean was 4.82 (SD = 1.03). The two items together yielded a
Chronbach’s alpha of .80. The test-retest correlation of Global SWB over a two-month interval
was moderate (.54).
2.2.2 Satisfaction with life in domains
Satisfaction with Life in Domains was measured by the Quality of Life Index (Ferrans & Powers, 1985). The Quality of Life Index is a specific multi-item cognitive measure of SWB that measures the satisfaction and importance of 31 life domains (e.g. family, work, health, financial conditions), using a six-point scale: (1) “Very Dissatisfied” to (6) “Very Satisfied”; (1) “Very Unimportant” to (6) “Very Important”. We used a narrow (at present) time reference. Results reflect the overall quality of life, considering satisfaction and the importance attributed to each life domain in four subscales: health and functioning; family; social and economic; and psychological and spiritual. Previous studies have supported the psychometric qualities of this scale: construct validity (Ferrans & Powers, 1985); convergent validity with other Life Satisfaction Scales (Anderson & Ferrans, 1997); and internal consistency with a Cronbach’s alpha between .89 and .95 (Canaval, Gonzalez, Martinez-Schallmoser, Tovar, & Valencia, 2000). In our study, we used the global indicator of quality of life, a variable which is computed by summing all the items of the scale in a total score. The internal consistency of the total scale was .91 (time I) and .93 (time II). The test-retest correlation over a two-month interval was moderate (.65).
2.2.3 Positive and negative state affect
Positive and Negative State Affect was measured by the Positive and Negative Affect Schedule (PANAS) (Watson, Clark, & Tellegen, 1988, Portuguese version from Galinha & Pais-Ribeiro,
2005). The PANAS asks how the individual feels, in the present, regarding ten positive and ten negative specific emotions using a five-point scale, from: (1) "Very slightly or not at all" to (5) "Extremely". The PANAS is one of the most widely used affect scales and was validated in several countries, showing high stability and internal consistency (Watson et al., 1988). However, studies are not consensual about the PANAS’ factor-structure and about the relationship between the PA and NA. Some results have indicated a two-factor structure of PANAS (Crawford & Henry, 2004) and others indicated a three-factor structure (Gaudreau, Sanchez & Blondin, 2006). Some results have indicated an independent relationship between PA and NA (Crocker, 1997) and others indicated a correlated relationship (Green & Salovey, 1999). Anyway, the authors of the scale have also found small significant correlations between PA and NA and proposed that PA and NA are tendencially, although not absolutely, independent (Watson et al., 1988). The Portuguese validation revealed good internal consistency with a Cronbach’s alpha of .86 for Positive Affect, and .89 for Negative Affect, and showed the tendency for independence between the two scales (r = -.10, p = .05). In the present study, the scale showed good internal consistency with a Cronbach’s alpha of .87 and .88 for Negative State Affect (time I & time II). Cronbach’s alpha for Positive state Affect was .82 and .89 (time I and time II). The test-retest correlation over a two-month interval was moderate being .64 for Positive Affect, and .52 for Negative Affect.
2.2.4 Positive and negative trait affect
We also used the PANAS as a Trait Affect measure, with a different time instruction: "Indicate to what extent you generally feel this way, that is, how you feel on average?". The authors of the scale stated that the stability coefficients of the general version of the PANAS are sufficient to be able to use it as a trait affect measure (Watson, et al, 1988; Watson & Clark, 1997). In the present study the scale showed good internal consistency, with a Cronbach’s alpha of .88 and .91 for Negative Trait Affect (time I & time II), and .82 and .86 for Positive Trait Affect.(time I & time II). The test-retest correlation over a two-month interval for Positive trait Affect (.65) and for Negative trait Affect (.63) was moderate.
2.2.5 Standards of comparison
Standards of Comparison (Telic, Social and Temporal Comparison) was measured by three global items extracted from the Satisfaction and Happiness Questionnaire (SHQ) (Michalos, 1980). The SHQ evaluates the Satisfaction and Standards of Comparison of 12 specific domains of life. The three Standards of Comparison items evaluate the goal-achievement gap (telic comparison), peers’ comparison (social comparison), and the previous best comparison (temporal comparison). The items ask, “Considering your life as a whole, how would you evaluate it, comparing it with: a) your goals and ambitions?; b) the average of the people of your age?; c) the best moment of your life in the past?”. Answer options are on a five-point scale from (1) “Far below..”; to (5) “Far above ..”; with an extra option, (6) “No opinion”. The arithmetic mean of these three global comparison items constitutes the Standards of Comparison variable used in this study. We could not find psychometric studies of the Satisfaction and Happiness Questionnaire. In our study this variable showed a weak internal consistency with a Cronbach’s alpha of .59 (time I) and .68 (time II). The test-retest correlation over a two-month interval was moderate (.56).
2.2.6 Anxiety, depression and stress
Anxiety, Depression and Stress was measured by Escala de Ansiedade, Depressão e Stress – ADS 21 (Pais-Ribeiro, Honrado, & Leal, 2004), the Portuguese version of the Depression Anxiety and Stress Scale - 21 (DASS-21; Lovibond & Lovibond, 1995). The DASS-21 was developed according to the tripartite model of Anxiety and Depression (Clark & Watson, 1991). Each variable is measured using seven items. Respondents are asked, “In what way did each sentence apply to you during the past month”, and used a four-point scale to respond: (0) “Did not apply to me at all” to (3) “Applied to me very much, or most of the time”. The internal consistency (Cronbach’s alpha) of the Portuguese version was α = .85 for the sub-scale of Depression, α = .74 for the sub-scale of Anxiety and α = .81 for the sub-scale of Stress (Pais-Ribeiro, et al., 2004). In our study the scale had good internal consistency; between α = .81 and α = .90 across the three subscales in both data sets. The test-retest correlation over a two-month interval was moderate for Depression (.53), Anxiety (.60) and Stress (.48).
2.2.7 Life events balance
Life Events Balance (i.e. the difference between positive and negative life events) was measured by the Inventory EVE (Ferreri, Vacher, Tawil, & Alby, 1987). The EVE questionnaire includes a list of 32 events grouped in five categories of life domains: family; professional; social; marital (relationships); and health. Each category of events has an additional item (other); the individual may fill out an item that is not contemplated in the list. The list proposes to evaluate the events that normatively occur in the life cycle of an adult, excluding catastrophic events, daily hassles or events that might be confused with symptoms. The impact of the events is evaluated by the individuals according to their personal vulnerability to the events. In our study we used a different response scale; a four-point scale: (1) “Very positive impact”; to (4) “Very negative impact”. We summed all the events that were considered to have a positive impact into one score, and all the events that were considered to have a negative impact into another score. Then we subtracted the second score from the first and obtained a Balance of the Life Events score. In our study, the mean of the Balance of Life Events was M = 0 (SE = .17); the maximum negative value was -8 and the maximum positive was 8. The median was Mdn = 0 and the mode was 1. The skewness of the distribution was .01, SE =.14 and the kurtosis was -.08, SE =.28, indicating normality in the distribution of the results.
2.2.8 Socio-demographic variables
A group of socio-demographic variables was included to characterize the individuals in our sample and to identify their objective life circumstances: gender; age; years of education; years of professional training; marital status; employment status; nationality; household income; household members; leisure time; and religious activities time. We also assessed health status by questioning individuals about chronic diseases diagnosed, physical impairment and health perception.
2.3 Procedure
With the institutions’ and the teachers’ permission, we approached participants in classrooms at the end of lessons. We invited the students to participate in a study about peoples’ emotions. The students who volunteered answered the questionnaires in the classroom. The researcher was present to answer any questions and supplied an e-mail address for further contact. In order to match the questionnaires from time I and time II, we requested participants write a
password on a separate sheet. Time II data collection was carried out two months later, at which point participants answered questionnaires that were matched to the previous ones through the passwords they supplied.
3. Results
3.1 Preliminary analysis
We began our data analysis by performing a principal components analysis (PCA), with Direct Oblimin rotation because it is expected that the factors are correlated. We did not define a number of components to extract but retained all factors whose eigenvalues were superior to 1. Results separated three components: a) one negative affective (including Negative State and Negative Trait Affect, Anxiety, Stress and Depression); b) one positive affective (including Positive State and Positive Trait Affect); and c) one cognitive (including Global Satisfaction with life, Global Happiness, Satisfaction with Life in Domains, and Social Comparison). Results indicated good main and secondary loadings, indicating good convergent and discriminant validity between the variables in the study; see Table 2.
Table 2: Principal components analysis with direct oblimin rotation of the cognitive and affective measures of the study
Components
1 2 3
Global Happiness (a) .02 .82 .07
Global Satisfaction (c) -.04 .86 .06
Satisfaction with Life in Domains
(c) -.18 .69 -.13
State Positive Affect (a) .05 .06 -.87
State Negative Affect (a) .74 -.21 -.16
Trait Positive Affect (a) -.05 -.03 -.90
Trait Negative Affect (a) .68 -.14 .02
Standards of Comparison (c) .07 .70 -.14
Depression (a) .68 -.20 .21
Anxiety (a) .93 .18 .02
Stress (a) .91 .09 -.01
Note: (a) affective measures; (c) cognitive measures. Factor loadings >.40 are in boldface.
The Keiser-Meyer-Olkin test yielded a .82 value, indicating that the partial correlations among variables are strong enough to provide an adequate PCA. The Bartlett’s Test of Sphericity yielded a χ255=1210.18 p < .0001, indicating that the correlation matrix is not an identity matrix and that the factor model is appropriate.
In the next step we performed a correlation analysis between the variables in the study and obtained low to moderate correlations, indicating discriminant validity and avoiding the problem of multicollinearity. The highest correlation found was .61, not surprisingly between State Affect and Trait Affect variables. The Socio-Demographic variables were subjected to dummy variable coding as described by Tabachnick and Fidel (2001).
3.1.1 Predictors of SWB
We performed a regression analysis using the stepwise method. Each of the SWB variables in the study was introduced as a dependent variable (Global Subjective Wellbeing; Satisfaction with Life in Domains; Positive State Affect; Negative State Affect). As independent variables, we introduced intrapersonal cognitive variables (such as Satisfaction with Life in Domains, Standards of Comparison), intrapersonal affective variables (such as Positive and Negative State Affect, Positive and Negative Trait Affect, Depression, Anxiety, Stress) and contextual variables (such as Life Events Balance, Socio-Demographic variables).
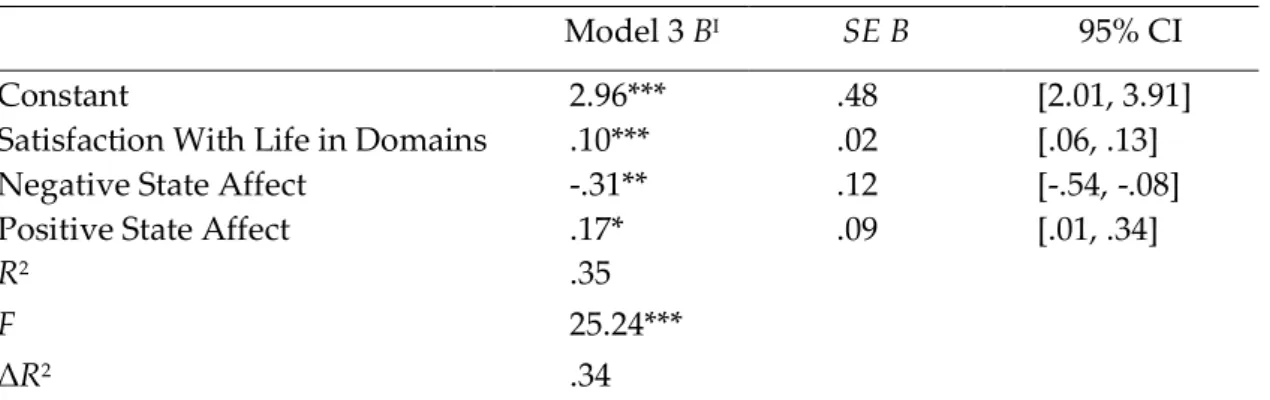
The predictors of Global SWB were Satisfaction with Life in Domains, Negative State Affect and Positive State Affect, explaining 34% of Global SWB variance (Table 3). Thus, the predictors of Global SWB were intrapersonal factors (cognitive & affective). Excluded were all contextual factors, affective trait and mood variables.
Table 3: Regression analysis (stepwise) for the predictors of global subjective wellbeing
Model 3 BI SE B 95% CI
Constant
Satisfaction With Life in Domains Negative State Affect
Positive State Affect
2.96*** .10*** -.31** .17* .48 .02 .12 .09 [2.01, 3.91] [.06, .13] [-.54, -.08] [.01, .34] R2 .35 F 25.24*** ΔR2 .34
Note. CI = confidence interval. *p < .05. **p < .01. ***p < .001. I Beta unstandardized coefficients of the last stepwise model of variables entered in the regression.
The predictors of Satisfaction with Life in Domains – a cognitive and specific measure of SWB – were Depression, Standards of Comparison, Life Events Balance, Positive State Affect, Socio-Demographic variables (gender - being a man; income - reporting higher levels; education - reporting fewer years of education; living with children - reporting living with fewer children; health perception - reporting not being ill) and Negative Trait Affect, explaining 58% of SWB variance (Table 4). Thus, the predictors of the cognitive and specific measure of SWB were intrapersonal factors (affective & cognitive) and contextual factors (life events & life circumstances).
Table 4: Regression analysis (stepwise) for the predictors of satisfaction with life in domains Model 10 B SE B 95% CI Constant 17.40*** 1.95 [13.54, 21.27] Depression -1.90*** .47 [-2.83, -.97] Standards of Comparison 1.03*** .27 [.48, 1.58]
Life Events Balance .20** .07 [.05, .35]
Positive State Affect .96** .30 [.35, 1.56]
Health Perception 2.55** .88 [.80, 4.28]
Gender -1.29** .41 [-2.09, -.47]
Income .58** .16 [.25, .90]
Years of Education -.21** .05 [-.32, -.08]
Negative Trait Affect -.99* .39 [-1.75, -.21]
Nr Children live with -.61* .26 [-1.12, -.09]
R2 .61
F 21.05***
ΔR2 .58
Note. Dummy Variable Coding: Sex - 0 Female; 1 Male; Health Perception – 0 Ill; 1 Not ill. CI = confidence interval. *p < .05. **p < .01. ***p < .001. I Beta unstandardized coefficients of the last stepwise model, of variables entered in the regression.
The predictors of the Positive State Affect – an affective and specific measure of SWB – were the Positive Trait Affect, one Socio-Demographic variable (educational status - being at university predicts lower Positive Affect than being in professional training) and Negative Trait Affect, explaining 42% of its variance (Table 5). The predictors of Positive Affect were intrapersonal affective factors and one contextual factor. Excluded were other contextual variables, cognitive, state affective and mood variables.
Table 5: Regression analysis (stepwise) for the predictors of positive state affect
Model 3 B SE B 95% CI
Constant -.25 .48 [-1.19, .69]
Positive Trait Affect 1.02*** .11 [.80, 1.25]
Education Status -.24** .09 [-.42, -.07]
Negative Trait Affect -.19* .08 [-.35, -.04]
R2 .43
F 35.60***
ΔR2 .42
Note. Dummy Variable Coding: Education Status – 0 Professional Trainee; 1 University Student. CI = confidence interval. *p < .05. **p < .01. ***p < .001. I Beta unstandardized coefficients of the last stepwise model, of variables entered in the regression.
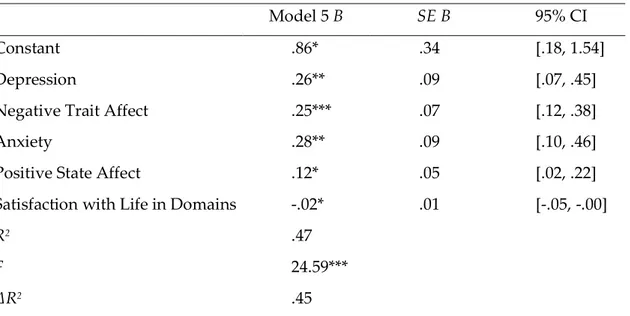
Negative State Affect – an affective and specific measure of SWB – was predicted by Depression, Negative Trait Affect, Anxiety, Positive State Affect and Satisfaction with Life in Domains, explaining 45% of its variance (Table 6). The predictors of Negative Affect were exclusively intrapersonal factors: affective and cognitive.
Table 6: Regression analysis (stepwise) for the predictors of Negative State Affect
Model 5 B SE B 95% CI
Constant .86* .34 [.18, 1.54]
Depression .26** .09 [.07, .45]
Negative Trait Affect .25*** .07 [.12, .38]
Anxiety .28** .09 [.10, .46]
Positive State Affect .12* .05 [.02, .22]
Satisfaction with Life in Domains -.02* .01 [-.05, -.00]
R2 .47
F 24.59***
ΔR2 .45
Note. CI = confidence interval. *p < .05. **p < .01. ***p < .001. *p < .05. **p < .01. ***p < .001. I Beta unstandardized coefficients of the last stepwise model, of variables entered in the regression.
Results suggest that SWB was mainly predicted by intrapersonal factors. Among the intrapersonal factors, the affective factors were the most important in predicting SWB: mood (particularly Depression); affective trait and affective state variables. However, contextual factors also significantly contribute to SWB, beyond the intrapersonal factors.
3.1.2 Predictors of global or specific measures of SWB
The main difference between the global and specific measures of SWB was that the global measure was firstly predicted by a cognitive factor while the specific measures were all firstly predicted by affective factors. Furthermore, specific measures were predicted by contextual factors, particularly the cognitive dimension, while the global measure was not predicted by contextual factors.
3.1.3 Predictors of SWB over a two-month interval
In order to identify which variables in the present are predictors of SWB two months later, a regression analysis was performed using the stepwise method. We introduced the cognitive, affective and contextual variables measured in time I as independent variables, and the four SWB variables, and the four SWB variables measured in time II as dependent variables.
Results indicated that the variables in time I that predicted Global SWB over a two-month interval were Satisfaction with Life in Domains, Standards of Comparison, and Negative Trait Affect, explaining 39% of its variance (Table 7).
Table 7: Regression analysis (stepwise) predicting global subjective wellbeing over a two-month interval
Model 3 B SE B 95% CI
Constant 3.37*** .51 [2.36, 4.39]
Satisfaction with Life in Domains .06** .02 [.02, .10]
Standards of Comparison .28*** .07 [.14, .43]
Negative Trait Affect -.27* .10 [-.47, -.06]
R2
.41
F 25.71***
ΔR2
.39
Note. CI = confidence interval. *p < .05. **p < .01. ***p < .001. *p < .05. **p < .01. ***p < .001. I Beta unstandardized coefficients of the last stepwise model, of variables entered in the regression.
The variables at time I that predicted Satisfaction with Life in Domains two months later were Depression, Standards of Comparison, Negative Trait Affect, health perception (the fact that the individual reports not feeling ill at the time), and nationality (being Portuguese instead of foreigner), explaining 38% of its variance (Table 8).
Table 8: Regression analysis (stepwise) predicting satisfaction with life in domains over a two-month interval
Model 5 B SE B 95% CI
Constant 17.07*** 2.42 [12.26, 21.87]
Depression -1.54* .68 [-2.90, -.19]
Standards of Comparison 1.09** .35 [.39, 1.79]
Negative Trait Affect -1.80*** .50 [-2.78, -.81]
Health Perception 2.80* 1.19 [.44, 5.16] Nationality 3.32* 1.43 [.50, 6.15] R2 .41 F 15.57*** ΔR2 .39
Note. Dummy Variable Coding: Nationality – 0 Foreigner; Portuguese; Health Perception – 0 Ill; 1 Not ill.*p < .05. **p < .01. ***p < .001. I Beta unstandardized coefficients of the last stepwise model, of variables entered in the regression.
The predictors of the Positive State Affect, two months later, were Positive Trait Affect, Satisfaction with Life in Domains, and one Socio-Demographic variable (employment status: being unemployed was a predictor of lower Positive Affect), explaining 32% of its variance (Table 9).
Table 9: Regression analysis (stepwise) predicting positive state affect over a two-month interval
Model 3 B SE B 95% CI
Constant -1.07 .57 [-2.20, .06]
Positive Trait Affect .85*** .15 [.55, 1.15]
Satisfaction with Life in Domains .06** .02 [.02, .09]
Employment Status -.29* .13 [-.54, -.02]
R2 .35
F 19.91***
ΔR2 .33
Note. Dummy Variable Coding: Employment Status – 0 Unemployed; 1 Employed. *p < .05. **p < .01. ***p < .001. I Beta unstandardized coefficients of the last stepwise model, of variables entered in the regression. Depression was the only predictor of Negative State Affect over a two-month interval (Model 1
B=.49, SEB = .12; R2 = .12; ΔR2 = .12; F= 16.08; p<.0001), ICs [.25, .73], explaining 11% of the
variance.
We observed that the first predictor of each SWB variable at time I was the same at time II (e.g. Satisfaction with Life in Domains was the first predictor of Global SWB at time I and at time II). However, among the secondary predictors we observed differences. Mood and affective trait variables showed higher predictive power of SWB over a two-month interval. The affective state variables were no longer among the predictors of SWB, and the contextual factors lost their prediction power, even more so, over a two-month interval.
4. Discussion
4.1 The main predictors of SWB
Our first objective was to identify the main predictors of SWB. To that end, we analysed the conjoint contribution of intrapersonal factors (cognitive & affective variables), and contextual factors (Life Events Balance & socio-demographic variables) in order to explain several components of SWB. The predictors of Global SWB were exclusively intrapersonal factors: Satisfaction with Life in Domains, Negative State Affect and Positive State Affect. Contextual variables and other affective variables, such as mood and trait affect, were not significant predictors of Global SWB. This result supports previous research which places intrapersonal factors among the main predictors of SWB.
Concerning the cognitive dimension of SWB, Depression was its first predictor, followed by Comparison Standards. Other researchers have found equivalent results, concluding that Satisfaction with Life: a) involves a cognitive process but also an affective process (Veenhoven, 1996); b) that it is a function of the comparison between life achievements and the personal standards of the individual (Schwarz & Strack, 1999); and c) that it is promoted by the individuals mainly to prevent Depression (Sirgy, 2002). Among the predictors of this dimension of SWB, we observed mood, cognitive variables, affective state and trait variables and a significant contribution of several contextual variables. This measure of SWB showed more contextual influences than any other measure, confirming previous results that contextual variables are associated more with Satisfaction with Life when measured in Domains rather than through global measures (Diener, 1999; Schimmack, Schupp & Wagner, 2008; Sirgy, 2002).
We agree that several components of SWB correlate in different ways with contextual variables (Schwarz & Strack, 1999).
Concerning the affective dimensions of SWB, results showed a main association with affective trait and mood variables. The contribution of affective trait factors to the affective dimension of SWB is not surprising, since, in our study, state and trait affect were measured with the same instrument (PANAS), using a different temporal frame (Watson et al., 1988). However, we also observed the contribution of Depression, a mood factor, in predicting Negative State Affect. Several previous studies showed the important contribution of Depression to SWB variables (Cummins, Gullone & Lau, 2002; Diener & Seligman, 2002), strongly suggesting that SWB is an indicator of the absence of Depression. In our results, Depression was also the first predictor of the cognitive dimension of SWB, constituting one of the main predictors of the SWB variables in our study. Only one contextual variable was predictive of Positive State Affect and none was predictive of Negative State Affect.
Regarding the theoretical models of SWB, a broad examination of our results indicates that the main predictors of SWB were intrapersonal (cognitive and affective). As expected, the contextual factors were not the best predictors of SWB. The results support the top down theoretical models of SWB (Brief et al., 1993). However, the results also showed that the contextual variables significantly predicted SWB, particularly its cognitive dimension. Therefore, we cannot state that one of the models is better. Feist et al. (1995) also tested the
bottom up and top down models and concluded that neither was better than the other.
To discuss the contribution of the contextual variables to SWB we must consider the characteristics of our sample. The sample in our study, as samples in most studies of SWB, has a medium socio-economic status, and is thus unlikely to experience deficits in basic human needs. As discussed in previous research (Inglehart & Klingemann, 2000; Veenhoven, 1996), these samples are not adequate to show the impact of the contextual variables on SWB. Contextual variables became very important to the SWB of individuals when basic needs are not fulfilled (Veenhoven, 1996). Considering these elements, we cannot state that contextual variables are not important predictors of SWB. We argue that our results preferably support the
integrative theoretical model of SWB, because all orders of factors - cognitive, affective and
contextual -, significantly contribute to SWB, supporting the multidimensionality of predictors, as argued by McCullough, Huebner, and Laughlin (2000). Furthermore, the integrative model presupposes that the contribution of the predictors to SWB is dynamic, depending on other factors such as the characteristics of the sample, the variables being assessed, and the time frame used.
4.2 The predictors of global and specific measures of SWB
Considering global SWB, measured by Global Happiness and Global Satisfaction, we expected that it would be firstly predicted by affective state or trait factors. According to Schwarz and Strack (1999), Global SWB measures are complex because they ask of the individual the task of evaluating every life domain and combine it in a global answer. Confronted with that demanding task, global measures of SWB may not reflect a systematic and accurate evaluation of all aspects of life. Rather, people may respond in accordance with their affective state in the moment of the assessment. In turn, specific measures are probably more influenced by intra and inter comparison processes, since they supply the information to be compared (e.g. specific life domains) as well as the evaluation criteria (e.g. response options). Results obtained by Diener et al. (2000) also showed that global measures of SWB tend to be predicted by broad
indicators and positive predisposition factors, while specific measures may reflect actual experiences and be more diagnostic on the causes of global SWB.
Our results only partially support previous research. In fact, the specific measures were more accurately predicted by the actual experiences of the individuals (such as Life Events and Socio-Demographic variables), while Global SWB was not predicted by contextual variables. This result supports previous findings that global measures reflect more top down influences while specific measures of SWB reflect more bottom up influences. Our results also show that Comparison Standards were a significant predictor of the specific measure of SWB, supporting the hypothesis that specific measures are more influenced by intra and inter comparison processes, and are more diagnostic, providing information about the causes of SWB (Diener et al., 2000; Schwarz & Strack, 1999).
However, our results do not support the hypothesis that global SWB is mainly influenced by the affective state and trait of the individuals. The affective variables did not prove to be the best predictors of the global SWB. In fact, Gobal SWB first predictor was a cognitive variable (Satisfaction with Life in Domains). We should note that the Global SWB questions were placed at the beginning of the questionnaire, so that the Satisfaction with Life in Domain questions would not influence the global answers. The differences between our results and the ones from Diener et al. (2000) may be explained by the different measures used in both studies. As global measures of SWB, Diener et al. (2000) employed three life satisfaction domains (e.g. education, recreation, and oneself), similar to the ones we used as specific measures. As global measures, we used Global Life Satisfaction and Global Happiness. As specific measures, Diener et al. (2000) used specific aspects of each life domain (e.g., satisfaction with books & with teachers), while we used 31 life satisfaction domains (e.g., education, recreation, oneself, income). We conclude that further study may be useful to understand the different dynamics of answering questions regarding global and specific measures of SWB.
4.3 Predictors of SWB over a two-month interval
An important result of our study relates to the effect of time in the prediction power of several factors in the SWB of individuals. We observe differences from the predictors of Global SWB between time I and time II of data collection. The predictors of Global SWB measured in time II were Satisfaction with Life in Domains, Comparison Standards and Negative Trait Affect. Over a two-month interval the affective state variables were no longer predictors of SWB and the cognitive and affective trait variables became more predictive of SWB in the future.
The first predictor of Satisfaction with Life in time II, as in time I, was Depression. However, state affective variables were no longer predictors of Satisfaction with Life in time II, trait affective variables maintained their predictive power and the contextual variables showed less predictive power. Results support the idea that contextual factors have a short-term effect, while trait variables have a long-term effect in SWB, as argued previously (Headey & Wearing, 1992; Suh, Diener & Fujita, 1996).
The predictors of Positive and Negative Affect at time II were mood and trait affective variables, although Satisfaction with Life in domains and employment were also predictors. Employment is, in fact, one of the contextual variables that shows a consistent and long-term association with SWB (Lucas, et al., 2004).
Concluding our discussion of the predictors of SWB over a two-month interval, we observed that affective state variables and contextual variables lost predictive power and that affective trait variables increased their predictive power. These results stress the importance of
analysing the predictors of SWB in different moments in time, because the factors that predict SWB in the present may not be relevant to predict SWB in the future.
One of the limitations of our study was the use of two instruments that were not previously validated in the Portuguese language, specifically, the measures of Satisfaction with Life in Domains and Social Comparison. At the time it was not possible to find parsimonious instruments validated in the Portuguese language to measure the above constructs; available instruments were too long for use in a global questionnaire such as this one. Therefore we opted for more parsimonious instruments, although not validated. Yet, as reported, the psychometric qualities of these instruments yielded adequate values of internal consistency, reliability and convergent and discriminant validity; except for a rather low Chronbach Alpha of the Social Comparison variable. Another limitation of the study is related to the gender and age bias of our sample, constituted mostly of women and young adults. Furthermore, we only sampled a two month interval period; results may not be generalized for longer periods of time.
Concluding our results, the intrapersonal factors (cognitive & affective) were the main predictors of SWB, particularly the affective, Depression, State and Trait Affect. Contextual variables such as Life Events Balance and socio-demographic variables also showed significant prediction of SWB, particularly of the cognitive dimension. The different dimensions and levels of measurement of SWB showed different predictors, indicating that they are distinct and that the findings for one may not generalize to the others (Diener, 2000; 2006; Schimmack, Schupp, & Wagner, 2008). For further study it would be important to include measures of the three dimensions of the concept: Satisfaction with Life, Positive Affect and Negative Affect. However, if that proves not possible, then it would be essential to clearly report which measures of SWB were used, and to what dimension the results refer.
Finally, our results also showed that time has an effect in the predictors of SWB. Even in a short temporal interval of two months, contextual and state affect variables lost predictive power, while trait affect variables gained predictive power. Considering our results, we agree with the integrative perspective which emphasises the contribution of multiple factors to SWB in a dynamic interaction. This means that depending on the characteristics of the samples, of the measures used and of the time frame in which measurement occurs, the contribution of each factor to SWB can change. Further study should continue to explore the relationships between these factors.
We consider these results important in understanding the processes and dynamics of SWB. By understanding the relationship between different predictors, different measures and the time variable, it is possible to better intervene and to more reasonably anticipate the results of intervention programs over time.
Acknowledgements
We are grateful for financial support from the Portuguese Foundation for the Sciences and Technologies BPD/26479/2006.
Authors
Iolanda Costa Galinha
Universidade Autónoma de Lisboa iolandag@yahoo.com
José Luís Pais Ribeiro Universidade do Porto.
jlpr@netcabo.pt Publishing Timeline Received 25 July 2011 Accepted 4 December 2011 Published 29 April 212 References
Anderson, J., & Ferrans, C. (1997). The quality of life of persons with chronic fatigue syndrome. Journal of Nervous and Mental Disease, 186, 359-367. http://dx.doi.org/10.1097/00005053-199706000-00001
Andrews, F., & Robinson, J. (1991). Measures of subjective well being. In J. P. Robinson, P. R. Shaver, & L. S. Wrightsman (Eds.), Measures of personality and social psychological attitudes (pp. 61-67). San Diego: Academic Press.
Arthaud-Day, M.L., Rode, J.C., Mooney, C.H. & Near, J.P. (2005). The subjective well-being construct: A test of its convergent, discriminant, and factorial validity. Social Indicators Research, 74, 445-476. http://dx.doi.org/10.1007/s11205-004-8209-6
Bonanno, G. A., Moskowitz, J. T., Papa, A., & Folkman, S. (2005). Resilience to loss in bereaved spouses, bereaved parents, and bereaved gay men. Journal of Personality and Social Psychology, 88, 827-843. http://dx.doi.org/10.1037/0022-3514.88.5.827
Brief, A., Butcher, A., George, J., & Link, K. (1993). Integrating bottom-up and top-down theories of subjective well-being: The case of health. Journal of Personality and Social Psychology, 64, 646-653.
http://dx.doi.org/10.1037/0022-3514.64.4.646
Canaval, G., Gonzalez, M., Martinez-Schallmoser, L., Tovar, M., & Valencia, C. (2000). Depresion postparto, apoyo social y calidad de vida en mujeres de Cali, Colombia. Colombia Medica, 31, 4-10. Clark, L. A., & Watson, D. (1991). Tripartite model of anxiety and depression: Psychometric evidence
and taxonomic implications. Journal of Abnormal Psychology, 100, 316-336.
Crawford, J., & Henry, J. (2004). The positive and negative affect schedule (PANAS): construct
validity, measurement properties and normative data in a large non-clinical sample. British Journal of Clinical Psychology, 43, 245-265
Crocker, P. (1997). A confirmatory factor analysis of the positive affect negative affect schedule with a youth sport sample. Journal of Sport and Exercise Psychology, 19, 91-97.
Cummins, R., Gullone, E., & Lau, A. (2002). A model of subjective well-being homeostasis: The role of personality. In E. Gullone & R. A. Cummins (Eds.) The universality of subjective well-being indicators (pp. 7-46). The Netherlands: Kluwer Academic Publishers. http://dx.doi.org/10.1007/978-94-010-0271-4_3
Diener, E. (1999). Introduction to the special section on the structure of emotion. Journal of Personality and Social Psychology, 76, 803-804. http://dx.doi.org/10.1037/0022-3514.76.5.803
Diener, E. (2000). Subjective well-being: The science of happiness, and a proposal for a national index. American Psychologist, 55, 34-43. http://dx.doi.org/10.1037/0003-066X.55.1.34
Diener, E. (2006). Guidelines for national indicators of subjective well-being and ill-being. Applied Research in Quality of Life, 1, 151-157. http://dx.doi.org/10.1007/s11482-006-9007-x
Diener, E., & Biswas-Diener, R. (2000). New directions in subjective well-being research: The cutting edge. Indian Journal of Clinical Psychology, 27, 21-33.
Diener, E., Napa-Scollon, C., Oishi, S., Dzokoto, V., & Suh, E. (2000). Positivity and the construction of life satisfaction judgments: Global happiness is not the sum of its parts. Journal of Happiness Studies, 1, 159-176. http://dx.doi.org/10.1023/A:1010031813405
Diener, E., & Ryan, K. (2009). Subjective well-being: a general overview. South African Journal of Psychology, 39, 391-406.
Diener, E., & Seligman, M. (2002). Very happy people. Psychological Science, 13, 81-84.
Diener, E., Suh, E., Lucas, R., & Smith, H. (1999). Subjective well-being: Three decades of progress. Psychological Bulletin, 125, 276-302.http://dx.doi.org/10.1037/0033-2909.125.2.276
Farid, M., & Lazarus, H. (2008). Subjective well-being in rich and poor countries. Journal of Management Development, 27, 1053-1065. http://dx.doi.org/10.1108/02621710810916303
Feist, G. J., Bodner, T. E., Jacobs, J. F., Miles, M., & Tan, V. (1995). Integrating top-down and bottom-up structural models of subjective well-being: A longitudinal investigation. Journal of Personality and Social Psychology, 68(1), 138-150. http://dx.doi.org/10.1037/0022-3514.68.1.138
Ferrans, C., & Powers, M. (1985). Quality of life index: Development and psychometric properties. Advances in Nursing Science, 8, 15-24.
Ferreri, M., Vacher, J., Tawil, S., & Alby, M. (1987). Facteurs événementiels et dépression: le questionnaire EVE, une nouvelle approche de méthodologie prédictive. Psychologie Médicale 19, 2441-2448.
Folkman, S. & Moskowitz, J. (2000). Positive affect and the other side of coping. American Psychologist, 55, 647-654. http://dx.doi.org/10.1037/0003-066X.55.6.647
Fredrickson, B. L. (2006). The broaden-and-build theory of positive emotions. In M. Csikszentmihalyi & I. Csikszentmihalyi, (Eds.), A life worth living: Contributions to positive psychology (pp. 85-103). New York, NY US: Oxford University Press.
Fredrickson, B. L., & Branigan, C. (2005). Positive emotions broaden the scope of attention and thought-action repertoires. Cognition and Emotion, 19(3), 313-332.
http://dx.doi.org/10.1080/02699930441000238
Gaudreau, P., Sanchez, X., & Blondin, J. (2006). Positive and negative affective states in a
performance-related setting testing the factorial structure of the PANAS across two samples of French-Canadian participants. European Journal of Psychological Assessment, 22, 240–249.
Galinha, I., & Pais-Ribeiro, J. (2005). Contribuição para o estudo da versão portuguesa da Positive and Negative Affect Schedule (PANAS): II – Estudo Psicométrico. Análise Psicológica, 23, 219-227. Galinha, I. & Pais-Ribeiro, J. (2008). Structure and stability of subjective well-being: A structure
equation modelling analysis. Applied Research in Quality of Life, 3, 293-314.
http://dx.doi.org/10.1007/s11482-009-9063-0
Green, D., & Salovey, P. (1999). In what sense are positive and negative affect independent? A reply to Tellegen, Watson, and Clark. Psychological Science, 10, 304-306.
Headey, B. (2008). The set-point theory of well-being: negative results and consequent revisions. Social Indicators Research, 85(3), 389-403. http://dx.doi.org/10.1007/s11205-007-9134-2
Headey, B., & Wearing, A. (1992). Understanding happiness: A theory of subjective well being. Melbourne: Longman Cheshire.
Helliwell, J.F., Barrington-Leigh, C., Harris, A., & Huang, H. (2009). International evidence on the social context of well-being. In E. Diener, D. Kahneman, & J.F. Helliwell (Eds.), International Differences in Well-Being. Oxford, UK: Oxford University Press.
Inglehart, R., & Klingemann, H. (2000). Genes, culture, democracy and happiness. In E. Diener & E. Suh (Eds.), Subjective well-being across cultures (pp. 165-183). Cambridge: MA, MIT Press.
Jones, T. G., Rapport, L. J., Hanks, R. A., Lichtenberg, P. A., & Telmet, K. (2003). Cognitive and psychosocial predictors of subjective well-being in urban older adults. The Clinical
Neuropsychologist, 17(1), 3-18. http://dx.doi.org/10.1076/clin.17.1.3.15626
Jovanovic, V. (2011). Personality and subjective well-being: One neglected model of personality and two forgotten aspects of subjective well-being. Personality And Individual Differences, 50(5), 631-635. doi:10.1016/j.paid.2010.12.008
Lovibond, P., & Lovibond, S. (1995). The structure of negative emotional states: Comparison of the depression anxiety stress scales (DASS) with the Beck Depression and Anxiety Inventories. Behaviour Research and Therapy, 33, 335-343. http://dx.doi.org/10.1016/0005-7967(94)00075-U
Loewenstein, G., & Frederick, S. (1999). Hedonic adaptation: From the bright side to the dark side. In D. Kahneman, E. Diener, & N. Schwarz (Eds.). Well-being: The foundations of hedonic psychology (pp. 61-84). New York, Russell Sage Foundation.
subjective well-being (pp. 171-194). New York: Guilford Press.
Lucas, R. E., Clark, A. E., Georgellis, Y., & Diener, E. (2004). Unemployment alters the set point for life satisfaction. Psychological Science,15, 8-13. http://dx.doi.org/10.1111/j.0963-7214.2004.01501002.x
McCullough, G., Heubner, E., & Laughlin, J. (2000). Life events, self-concept, and adolescents' positive subjective well-being. Psychology in the Schools, 37, 281-291.
http://dx.doi.org/10.1002/(SICI)1520-6807(200005)37:3%3c281::AID-PITS8%3e3.0.CO;2-2
Michalos, A. (1980). Satisfaction and happiness. Social Indicators Research, 8, 385-422.
http://dx.doi.org/10.1007/BF00461152
Pais-Ribeiro, J., Honrado, A. & Leal, I., (2004). Contribuição para o Estudo da Adaptação Portuguesa das escalas de Anxiety, Depression e Stress (EADS) de 21 itens de Lovibond e Lovibond.
Psicologia, Saúde e Doenças, 5, 229-239.
Schimmack, U., Schupp, J., & Wagner, G. (2008). The influence of environment and personality on the affective and cognitive component of subjective well-being. Social Indicators Research, 89, 41-60.
http://dx.doi.org/10.1007/s11205-007-9230-3
Schwarz, N., & Strack, F. (1999). Reports of subjective well-being: Judgmental processes and their methodological implications. In Kahneman, D., Diener, E., & Schwarz, N. (Eds). Well-Being: The foundations of hedonic psychology (pp. 61-83). New York: Russel Sage Foundation.
Silver, R., & Wortman, C. (1980). Coping with undesirable life events. In J. Garber & M. E. P. Seligman (Eds.), Human helplessness: Theory and applications (pp. 279-340). New York: Academic Press. Sirgy, M. (2002). The psychology of quality of life. Dordrecht: Kluwer Academic Publishers.
Suh, E., Diener, E., & Fujita, F. (1996). Events and subjective well-being: Only recent events matter. Journal of Personality and Social Psychology, 70, 1091-1102.
http://dx.doi.org/10.1037/0022-3514.70.5.1091
Suh, E., Diener, E., Oishi, S., & Triandis, H. C. (1998). The shifting basis of life satisfaction judgments across cultures: Emotions versus norms. Journal of Personality and Social Psychology, 74, 482-493.
http://dx.doi.org/10.1037/0022-3514.74.2.482
Tabachnick, B. & Fidel, L. (2001). Using Multivariate Statistics (4th Edition). Boston, Allyn & Bacon. Veenhoven, R. (1996). The study of life satisfaction. In Saris, W.E., Veenhoven, R. Scherpenzeel, A. C.
& Bunting, B. (Eds.). A comparative study of satisfaction with life in Europe (pp. 11-48). Eötvös: University Press.
Watson, D., Clark, L. & Tellegen, A. (1988). Development and validation of brief measures of Positive and Negative Affect: the PANAS scales. Journal of Personality and Social Psychology, 54, 1063-1070.
http://dx.doi.org/10.1037/0022-3514.54.6.1063
Watson, K., & Clark, L. (1997). Extroversion and its positive emotional core. In R. Hogan, J. Hohnson, & S. Briggs (Eds.). Handbook of personality psychology (pp. 767-793). San Diego: Academic Press.