Junho, 2018
Diogo Vieira Pedro Marques Saraiva
[Nome completo do autor]
[Nome completo do autor]
[Nome completo do autor]
[Nome completo do autor]
[Nome completo do autor]
[Nome completo do autor]
[Nome completo do autor]
Licenciado em Engenharia de Micro e Nanotecnologias
[Habilitações Académicas] [Habilitações Académicas] [Habilitações Académicas] [Habilitações Académicas] [Habilitações Académicas] [Habilitações Académicas] [Habilitações Académicas]
Electro-optical devices based on
cellulose nanocrystals
[Título da Tese]
Dissertação para obtenção do Grau de Mestre em Engenharia de Micro e Nanotecnologias
Orientadora: Professora Doutora Susete Fernandes, Investigadora em Pós-doutora-mento, CENIMAT/I3N- Departamento de Ciência dos Materiais, Faculdade de Ciências e Tecnologia da Universidade Nova de Lisboa
Co-orientador: Professor Doutor Pedro Almeida, Professor Adjunto, Departamento de Fí-sica, Instituto Politécnico de Lisboa ISEL/IPL
Júri
Presidente: Doutor Rodrigo Ferrão Paiva Martins, Professor Catedrático, FCT-UNL
Arguente: Doutora Maria Helena Godinho, Professora Associada com Agregação, FCT-UNL Vogal: Doutora Susete Fernandes, Investigadora em Pós-doutoramento, FCT-UNL
iii
Electro-optical devices based on cellulose nanocrystals
Copyright © Diogo Vieira Pedro Marques Saraiva, Faculdade de Ciências e Tecnologia, Universidade Nova de Lisboa, 2018.
A Faculdade de Ciências e Tecnologia e a Universidade Nova de Lisboa têm o direito, perpétuo e sem limites geográficos, de arquivar e publicar esta dissertação através de exemplares impressos reproduzidos em papel ou de forma digital, ou por qualquer outro meio conhecido ou que venha a ser inventado, e de a divulgar através de repositórios científicos e de admitir a sua cópia e distribuição com objectivos educacionais ou de investigação, não comerciais, desde que seja dado crédito ao autor e editor.
v
Acknowledgements
Em primeiro lugar, quero agradecer à nossa instituição, a Faculdade de Ciências e Tecnologia da Universidade Nova de Lisboa, ao Departamento das Ciências dos Materiais e ao CENIMAT por fazerem os anos de licenciatura e mestrado passarem num ápice.
À professora Susete, a minha orientadora: não consigo enfatizar o quão grato estou por tudo o que fez este último ano. Muito obrigado por todo o tempo e paciência dispensados. Ao professor Pedro, o meu orientador, ao qual agradeço sinceramente por toda a sua disponibilidade e motivação, especial-mente nesta reta final. À professora Godinho, por me ensinar muito do que acabei por escrever nesta tese, tanto nas aulas como fora delas. Agradeço também a toda a gente no laboratório 107, bem como a todos os investigadores/professores que me tenham ajudado, direta ou indiretamente, a concluir esta dissertação. De forma muito literal, esta tese não existiria se não fossem vocês.
À Cláudia e ao André. Tenho imensa sorte por ter feito a tese ao lado de pessoas tão toleráveis como vocês.
Aos manos do chat, as pessoas mais genuinamente engraçadas que conheço, não ironicamente. Ao João, Ricardo, Nuno, Manuel, Simão, Sabino, Bernardo, Rodrigo, Guilherme e Fred. Enumerei-vos porque parece um agradecimento mais significativo e sincero.
Aos manos e manas que não sejam do chat, por me terem moldado para ser o que sou hoje, de uma maneira ou de outra.
À Filipa. Ia me esquecendo de a meter aqui, mas mandou mensagem agora, por isso está aqui na versão final. “Agradeço à Filipa por me tirar a Netflix todos os meses" é o que ela sugeriu que eu dissesse.
Por último, aos meus pais, pelo apoio e paciência incondicionais ao longo destes anos. À Marta, pelos desenhos. Obrigado pelos desenhos. À avó, pela constante enxurrada de prendas e carinho. Ao tio e à tia, por fazerem parte do meu percurso de vida até hoje como “os tios fixes”.
Obrigado por tudo.
This work was funded by FEDER funds through the COMPETE 2020 Program and National Funds through FCT - Portuguese Foundation for Science and Technology under the projects numbers POCI- 01-0145-FEDER-007688 (Reference UID/CTM/50025), PTDC/FIS-NAN/0117/2014 and also by M-ERA.NET, a EU funded network, for project 2/0007/2016 – CellColor.
vii
Resumo
A auto-organização de nanocristais de celulose (NCC) em suspensão, retida da evaporação do solvente, tende a formar filmes estruturalmente coloridos, que apresentam anisotropia ótica visto que conseguem seletivamente refletir luz circularmente polarizada à esquerda e transmitir luz circularmente polarizada à direita. No entanto, devido à heterogeneidade do arranjo nemático quiral, originando dife-rentes valores de passo no filme, uma resposta ótica sem a transmissão total de luz no canal de luz circularmente polarizada à direita é observada. O objetivo desta dissertação é melhorar esta resposta ótica em ambos os canais de luz.
Foram obtidos filmes sólidos de NCC (com espessuras de ~100 μm) com diferentes valores de passo, que apresentam uma largura espectral de 200 nm, por sua vez atribuído a variações no passo helicoidal. De forma a reduzir estas heterogeneidades, um filme fino de NCC em forma de gota (12 μm) foi produzido usando uma taxa de evaporação controlada, resultando em melhor transmissão de luz circularmente polarizada à direita. Quando a auto-organização de uma suspensão de NCC é sujeita a um campo magnético forte (7.05 T), um filme fino homogéneo (16 μm) é produzido, com uma largura espectral mais estreita (100 nm) e uma transmissão de luz circularmente polarizada direita quase total. Este último filme, se impregnado com um cristal líquido nemático (5CB, que converte a fase da luz polarizada de esquerda para direita, ao funcionar como uma lâmina de retardação de meia onda), mos-tra uma resposta ótica refletiva extensivamente homogénea em ambos os canais de luz. Este mos-trabalho mostra que a resposta ótica de filmes finos de NCC estruturalmente coloridos pode ser melhorada pela aplicação de um campo magnético forte, abrindo assim novas possibilidades para o seu uso em dispo-sitivos eletro-óticos.
Palavras-chave: Filmes de NCC estruturalmente coloridos, luz circularmente polarizada, campo
ix
Abstract
The self-assembly of cellulose nanocrystals (CNC) in suspension can, upon solvent drying, form structurally colourful films presenting optical anisotropy, since they selectively reflect left circular polar-ised (LCP) light and transmit right circular polarpolar-ised (RCP) light. However, due to the films’ heterogene-ous chiral nematic arrangement, which leads to different pitch sizes, an optical response without full RCP light transmission is observed. The goal of this dissertation is to improve this optical response in both light channels.
Freestanding CNC films (~100 μm in thickness) with different pitch sizes were obtained, presenting a spectral width of 200 nm, attributed to variations in the helical pitch. To reduce these heterogeneities, a thin (12 μm) drop-cast CNC film was produced using a controlled evaporation rate, with increased RCP light transmission. When the self-assembly of a CNC suspension is subjected to a strong magnetic field (7.05 T), a homogeneous thin film (16 μm) is produced, with a narrower spectral width (100 nm) and a quasi-total RCP transmission.
This latter film, if impregnated with a nematic liquid crystal (5CB, acting as a half-wave retardation plate which converts the handedness of the polarised light from left to right), shows an area-wide ho-mogeneous optical reflection response in both light channels. This work shows that the optical response of structurally colored thin CNC films can be improved by application of a strong magnetic field, which opens new possibilities for its use in electro-optical devices.
Keywords: Structurally coloured CNC films, circularly polarised light, magnetic field, electro-optical de-vice, liquid crystals
xi
Table of contents
A
CKNOWLEDGEMENTS...
VR
ESUMO...
VIIA
BSTRACT...
IXL
IST OF FIGURES...
XIIIL
IST OF TABLES...
XVIIA
CRONYMS...
XIX1 I
NTRODUCTION... 1
Liquid crystals ... 1
Cellulose and its derivatives ... 4
Electro-optical devices and interactions with liquid crystals ... 5
2 M
ATERIALS ANDM
ETHODS... 9
Production of CNC freestanding films and droplets ... 9
Electro-optical device assembly ... 9
Characterisation ...10
3 R
ESULTS AND DISCUSSION... 13
CNC characterisation ...13
Freestanding CNC films ...17
Varying the evaporation rate of drop-cast CNC films ...20
Improving the substrate’s hydrophilicity ...23
Strong magnetic field application in CNC film production ...27
Electro-optical cell assembly using a freestanding CNC film ...31
4 C
ONCLUSION AND FUTURE PERSPECTIVES... 37
5 R
EFERENCES... 41
6 S
UPPORTING INFORMATION... 45
AFM measurements of length and width of individual CNC particles ...45
Evaporation rate depending on temperature ...46
Specular and diffuse reflectance spectra for remaining films ...47
SEM images used in the measuring of additional physical features ...48
xiii
List of figures
FIGURE 1.1 – A), B), C) SCHEMATICS DEPICTING THE MOLECULAR ORDER OF A CRYSTALLINE STRUCTURE (SOLID), A LIQUID CRYSTAL AND AN ISOTROPIC STRUCTURE (LIQUID), RESPECTIVELY. D), E), F) DIFFERENT LIQUID CRYSTAL MOLECULAR SHAPES: CALAMITIC, DISCOTIC, AND BENT-CORE, RESPECTIVELY. ... 1 FIGURE 1.2– A)SCHEMATIC REPRESENTATION OF A NEMATIC PHASE, WITH ITS DIRECTOR N POINTING UPWARD;
B) SCHEMATIC DEPICTION OF A CHOLESTERIC PHASE, WHERE P/2 IS HALF THE LENGTH OF THE STRUCTURE’S PITCH. ... 3 FIGURE 1.3 – A) SCHEMATIC REPRESENTATION OF THE CHEMICAL STRUCTURE OF CELLOBIOSE, WHICH
CONSTITUTES THE CELLULOSE MONOMER CELLULOSE.IT IS DIVIDED INTO TWO ANHYDROGLUCOPYRANOSE UNITS, CONNECTED BY THE SHOWN Β-1,4 LINKAGE. B) AN ILLUSTRATION OF A CELLULOSE MICROFIBRIL, DIVIDED INTO AMORPHOUS AND CRYSTALLINE REGIONS. C) RESULTING CELLULOSE NANOCRYSTALS AFTER AN ACID HYDROLYSIS PROCESS COMPLETELY DISSOLVES AMORPHOUS REGIONS. ADAPTED FROM [15] WITH PERMISSION OF THE ROYAL SOCIETY OF CHEMISTRY. ... 4 FIGURE 3.1 – FTIR SPECTRA OF THE TWO DIFFERENT SAMPLES: MCC AND A CNC FILM. ... 13 FIGURE 3.2–XRD DIFFRACTOGRAMS OF MCC AND CNC SAMPLES. ... 14 FIGURE 3.3–AN AFM-CAPTURED IMAGE, IN AMPLITUDE RETRACE MODE, DISPLAYING A LARGE AMOUNT OF
SCATTERED CNC PARTICLES. ... 15 FIGURE 3.4 – THERMAL ANALYSIS OF MICROCRYSTALLINE CELLULOSE AND CRYSTALLINE NANOCELLULOSE
SAMPLES. ... 16 FIGURE 3.5 – A) PHOTOGRAPH OF PHASE SEPARATION OBSERVED BETWEEN CROSS POLARISERS IN
SUSPENSIONS OF CELLULOSE NANOCRYSTALS WITH CNC CONTENT, FROM LEFT TO RIGHT,2.8,4.6,7.5 AND 9.1 % (W/W); B)VOLUME FRACTION OF CHOLESTERIC PLOTTED AS A FUNCTION OF THE CNC CONCENTRATION; POM IMAGES OF TEXTURES OBTAINED IN TRANSMISSION MODE FOR CNC SUSPENSION SAMPLES WITH C)2.8%(W/W), D)7.5%(W/W), AND 9.1%(W/W).SCALE BARS: A)1 CM C)100 ΜM; D)50 ΜM; E) 20 ΜM. ... 17 FIGURE 3.6 – PHOTOGRAPHS OBTAINED THROUGH A), B), C) LCP LIGHT CHANNEL OF F1, F2, AND F3,
RESPECTIVELY AND D), E), F) RCP CHANNEL LIGHT, AND F3, RESPECTIVELY. PHOTOGRAPHS WERE CAPTURED AT AN 8 º ANGLE PERPENDICULARLY TO THE SUBSTRATE. SCALE BARS: 2 MM. ... 18 FIGURE 3.7 – A), B), C) POM REFLECTION IMAGES OF THE LCP LIGHT CHANNEL AT THE CENTRE OF F1, F2, AND
F3, RESPECTIVELY; D), E), F) POM REFLECTION IMAGES OF THE RCP LIGHT CHANNEL AT THE CENTRE OF F1, F2, AND F3, RESPECTIVELY; G), H), I) LCP AND RCP REFLECTIVITY SPECTRA, MEASURED FOR WAVELENGTHS FROM 350 TO 800 NM, OF SAMPLES F1,F2, AND F3, RESPECTIVELY.SCALE BARS FOR A) – F): 100 ΜM. ... 19 FIGURE 3.8 – PHOTOGRAPHS OF CNC FILMS A), B), C)T1, T2, AND T3 OBSERVED THROUGH UNPOLARISED
WHITE LIGHT, RESPECTIVELY; D), E) T1 OBSERVED THROUGH LCP AND RCP LIGHT CHANNELS, RESPECTIVELY; F), G)T2 OBSERVED THROUGH LCP AND RCP LIGHT CHANNELS, RESPECTIVELY; H), I)T3 OBSERVED THROUGH LCP AND RCP LIGHT CHANNELS, RESPECTIVELY. PICTURES FROM D) TO I) WERE CROPPED IN HALF, AS TO BETTER INSPECT THE DIFFERENCE BETWEEN EACH CHANNEL. SCALE BARS: 1 MM. ... 20 FIGURE 3.9–PROCESS OF EVAPORATION OF A DROP OF AQUEOUS SUSPENSION.ADAPTED BY PERMISSION
FROM NATURE, LARSON, R. G. IN RETROSPECT: TWENTY YEARS OF DRYING DROPLETS. NATURE, 550(7677), 466-467., 2017. ... 21 FIGURE 3.10– A), B), C)POM REFLECTION IMAGES OF THE LCP LIGHT CHANNEL AT THE CENTRE OF T1,T2, AND T3, RESPECTIVELY; D), E), F)POM REFLECTION IMAGES OF THE RCP CHANNEL AT THE CENTRE OF T1, T2, AND T3, RESPECTIVELY; G), H), I) LCP AND RCP REFLECTIVITY SPECTRA, MEASURED FOR WAVELENGTHS FROM 350 TO 800 NM, OF SAMPLES T1, T2, AND T3, RESPECTIVELY. SCALE BARS FOR A) – F):50 ΜM. ... 22 FIGURE 3.11–PROFILOMETER SCANS ACROSS THE T1,T2 AND T3 SOLID FILMS OBTAINED FROM 2.8%(W/W) CNC SUSPENSION DROPLETS ON ITO-COATED GLASS SUBSTRATES OBTAINED AT 3 ºC, 22 ºC, AND 60 ºC, RESPECTIVELY. ... 23
xiv FIGURE 3.12 – PLOTTED RESULTS OF AVERAGE STATIC CONTACT ANGLE MEASUREMENTS USING SESSILE WATER DROPLETS ON ITO-COATED GLASS SUBSTRATES FOR EACH CORRESPONDING AMOUNT OF EXPOSURE TIME. ... 24 FIGURE 3.13 – A), B), C) PHOTOGRAPHS OF U1, U2, AND U3 OBSERVED UNDER WHITE LIGHT; D), E) PHOTOGRAPHS OF U1’S LCP AND RCP LIGHT CHANNELS, RESPECTIVELY; F), G)PHOTOGRAPHS OF U2’S LCP AND RCP LIGHT CHANNELS, RESPECTIVELY; H), I) PHOTOGRAPHS OF U3’S LCP AND RCP LIGHT CHANNELS, RESPECTIVELY; J), K), L) PROFILOMETER SCANS OBTAINED ACROSS THE THREE FILMS SAMPLES.PICTURES FROM D) TO I) WERE CROPPED IN HALF, AS TO BETTER INSPECT THE DIFFERENCE BETWEEN EACH CHANNEL.SCALE BARS:1 MM. ... 25 FIGURE 3.14 – A), B), C) POM REFLECTION IMAGES OF THE LCP CHANNEL AT THE CENTRE OF U1, U2, AND U3,
RESPECTIVELY; D), E), F) POM REFLECTION IMAGES OF THE RCP LIGHT CHANNEL AT THE CENTRE OF U1, U2, AND U3, RESPECTIVELY; G), H), I) LCP AND RCP REFLECTIVITY SPECTRA, MEASURED FOR WAVELENGTHS FROM 350 TO 800 NM, OF SAMPLES U1, U2, AND U3, RESPECTIVELY. SCALE BARS FOR A) – F): 50 ΜM. ... 26 FIGURE 3.15 – A) SCHEMATIC OF THE LIGHT’S COURSE WHEN THE CELL IS VIEWED FROM THE TOP OF THE DROP-CAST FILM. BOTH LCP AND RCP LIGHT ARE REFLECTED. B), C) LCP AND RCP LIGHT CHANNEL PHOTOGRAPHS, RESPECTIVELY. D) SCHEMATIC OF THE LIGHT’S COURSE WHEN THE CELL IS VIEWED FROM THE BASE OF THE DROP-CAST FILM. LCP LIGHT IS REFLECTED AND RCP LIGHT IS TRANSMITTED. E), F)
LCP AND RCP LIGHT CHANNEL PHOTOGRAPHS, RESPECTIVELY. SCALE BARS FOR B), C), E), F): 5 MM. 27 FIGURE 3.16–SCHEMATIC OF HOW THE CHOLESTERIC LAYERS ARE ALIGNED IN THE CNC FILM, IN RELATION TO
THE APPLIED MAGNETIC FIELD.THE MAGNETIC FIELD’S VECTOR (B) IS COLLINEAR WITH THE CHOLESTERIC AXIS (Z); BOTH ARE DIRECTED UPWARD. ... 28 FIGURE 3.17 – A), B) POM REFLECTION IMAGES OF THE LCP LIGHT CHANNEL AT THE CENTRE OF R1 AND R2,
RESPECTIVELY; C), D)POM REFLECTION IMAGES OF THE RCP LIGHT CHANNEL AT THE CENTRE OF R1 AND R2, RESPECTIVELY; E), F)LCP AND RCP LIGHT REFLECTIVITY SPECTRA, MEASURED FOR WAVELENGTHS FROM 350 TO 800 NM, OF SAMPLES R1, R2, RESPECTIVELY. SCALE BARS FOR A) – D): 50 ΜM. ... 29 FIGURE 3.18 – A), B)LCP LIGHT CHANNEL PHOTOGRAPHS OF R1 AND R2, RESPECTIVELY; C), D) RCP LIGHT
CHANNEL PHOTOGRAPHS OF R1 AND R2, RESPECTIVELY. GLASS SUBSTRATES ARE PRESENT IN THE PICTURES, AS TO PREVENT THE FILMS FROM CURLING UP. PHOTOGRAPHS WERE TAKEN AT A 15º ANGLE PERPENDICULARLY TO THE SUBSTRATE. SCALE BARS: 2 MM. ... 29 FIGURE 3.19 – A), B)SPECULAR AND DIFFUSE REFLECTIVITY SPECTRA FOR R1 AND R2, RESPECTIVELY. SR
STANDS FOR SPECULAR REFLECTIVITY, WHILE DR STANDS FOR DIFFUSE REFLECTIVITY. ... 30 FIGURE 3.20–AFM-CAPTURED IMAGES OF A 20X20 ΜM SURFACE AREA OF R1 AND R2, IN AMPLITUDE RETRACE
MODE. ... 31 FIGURE 3.21 – A), B) LCP AND RCP LIGHT CHANNEL PHOTOGRAPHS OF THE ELECTRO-OPTICAL CELL,
RESPECTIVELY; C), D)LCP AND RCP LIGHT CHANNEL POM REFLECTION IMAGES, RESPECTIVELY, WHILE THE 5CB IS IN THE NEMATIC PHASE; E), F)LCP AND RCP LIGHT CHANNEL POM REFLECTION IMAGES, RESPECTIVELY, WHILE THE 5CB IS IN THE ISOTROPIC PHASE. SCALE BARS FOR A), B): 2 MM. SCALE BARS FOR C) – F). ... 32 FIGURE 3.22– A)SEM IMAGE OF THE MICROGAP INSIDE THE CNC FILM.THE GAP EXTENDS FAR BEYOND THE SIDES OF THE IMAGE, IN REALITY, WITH VARYING GAP WIDTHS ALONG THE WAY. B) LCP AND RCP LIGHT REFLECTIVITY SPECTRA, MEASURED FOR WAVELENGTHS FROM 350 TO 800 NM, OF THE CENTRE OF THE ELECTRO-OPTICAL DEVICE. SPECTRA WERE NORMALIZED AROUND THE RCP LIGHT SPECTRUM. SCALE BAR FOR A):500 NM. ... 33 FIGURE 3.23 – SIMULATED REFLECTANCE SPECTRA BY MEANS OF A 4 × 4 BERREMAN MATRIX, FOR THE LCP
AND RCP LIGHT CHANNELS, RESPECTIVELY. ... 34 FIGURE 3.24 – A), B) POM REFLECTION IMAGES OF THE LCP AND RCP LIGHT CHANNELS OF THE ELECTRO-OPTICAL CELL, RESPECTIVELY, WHILE IN THE OFF STATE.THE WIDE CHROMATIC GRADIENT IN B) CAN BE ATTRIBUTED TO OPTICAL INTERFERENCE FROM THE 5CB; C), D) POM IMAGES OF THE LCP AND RCP LIGHT CHANNELS OF THE ELECTRO-OPTICAL CELL, RESPECTIVELY, WHILE IN THE ON STATE. SCALE BARS:50 ΜM ... 35
xv FIGURE 6.1 – A). B), C) EVAPORATION RATE GRAPHS FOR SAMPLES EVAPORATED AT 3 ºC, 20 ºC, AND 60 ºC, RESPECTIVELY. EACH DIFFERENT SYMBOL REPRESENTS A DIFFERENT ARBITRARY SAMPLE, OUT OF A TOTAL OF 5 FOR EACH TESTED TEMPERATURE. ... 46 FIGURE 6.2– A), B), C)SPECULAR AND DIFFUSE REFLECTIVITY SPECTRA FOR F1,F2, AND F3, RESPECTIVELY. IT IS CLEAR THAT, WHEN COMPARED TO SAMPLES R1 AND R2, THESE FILMS SHOWCASE A MUCH HIGHER DIFFUSE REFLECTIVITY RELATIVE TO THEIR SPECULAR REFLECTIVITY. SR STANDS FOR SPECULAR REFLECTIVITY, WHILE DR STANDS FOR DIFFUSE REFLECTIVITY. ... 47 FIGURE 6.3–SEM IMAGE OF THE FULL EXTENSION OF THE DROP-CAST FILM’S CROSSSECTION.SCALE BAR:5 ΜM. ... 48 FIGURE 6.4 – SEM IMAGE OF THE FULL EXTENSION OF THE FREESTANDING CNC FILM’S CROSS-SECTION. ONE
CAN IDENTIFY THE MICROGAP AS THE SMALL OPENING NEAR THE CENTRE. THE UPPER AND LOWER CHOLESTERIC LAYERS ARE ABOVE AND BELOW IT, RESPECTIVELY.SCALE BAR:2 ΜM. ... 48
xvii
List of tables
TABLE 1 – CONCENTRATIONS, FILM THICKNESS, AND SUSPENSION VOLUMES ASSOCIATED WITH EACH OF THE STUDIED SAMPLES F1, F2 AND F3. ... 18 TABLE 2 – DATA ACQUIRED FROM FIGURE 3.19 B). THE WAVELENGTH PEAK IS THE WAVELENGTH VALUE
ASSOCIATED WITH EACH SPECTRUM’S MAXIMUM REFLECTIVITY VALUE, THE CALCULATED PITCH LENGTH IS THE EXTRAPOLATED CHOLESTERIC PITCH SIZE FROM EACH RESPECTIVE WAVELENGTH PEAK (USING THE DE VRIES EXPRESSION), AND THE SPECTRAL WIDTH IS EQUIVALENT TO FWHM VALUE OF EACH SPECTRUM. ... 33
xix
Acronyms
5CB 4-pentyl-4′-cyanobiphenyl
AFM Atomic Force Microscopy
ATR Attenuated Total Reflectance
CNC Cellulose Nanocrystal
CPDLC Cellulose-based Polymer Dispersed Liquid Crystal
DR Diffuse Reflectance
DSC Differential Scanning Calorimetry
FTIR Fourier-Transform Infrared
FWHM Full Width at Half Measure
HPC Hydroxypropyl Cellulose
ITO Indium Tin Oxide
LCD Liquid Crystal Display
LCP Left Circularly Polarised
MCC Microcrystalline Cellulose
NMR Nuclear Magnetic Resonance
PVA Polyvinyl Alcohol
POM Polarised Optical Microscope
RCP Right Circularly Polarised
RMS Root Mean Square
SEM Scanning Electron Microscope
SR Specular Reflection
TGA Thermogravimetric Analysis
UV Ultraviolet
1
1 Introduction
Liquid crystals
It was Otto Lehmann who first reported the existence of these “mesomorphic states of matter”, in 1889, as he coined the terms “crystalline fluids” or “liquid crystals”. More than thirty years went by for these findings to be regarded as more than meets the eye by Georges Friedel. [1] Today, liquid crystals are present in various modern applications, but most prevalently in flat panel displays, commonly known as Liquid Crystal Displays (LCDs).
Liquid crystals were established as an intermediate state of matter, between isotropic liquids and crystals, separated by well-defined phase boundaries. Crystalline phase molecules tend to display pre-cise spatial and orientational structuring, which might extend to a long range periodicity, in all three dimensions, whereas isotropic phase structures don’t display long-range organization at all. [1]
A defining feature of liquid crystals is their optical anisotropy, visible in the liquid crystalline state, which is manifested as birefringence. While an isotropic material (an isotropic fluid, for example) pos-sesses only one refraction index, in an anisotropic medium (such as a solid crystal or a liquid crystal) it displays different refraction indexes depending on the direction of transmitted light. [2]
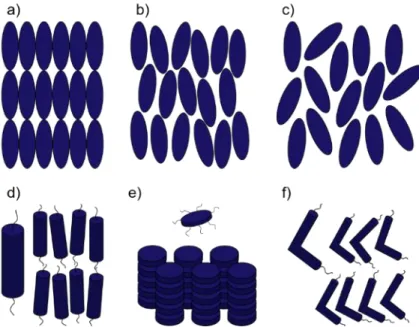
Different liquid crystalline compounds showcase varying degrees of positional order, which are sub-divided into three main mesophases: the nematic phase is associated with no positional order, the smectic phase presents one dimensional positional order, and the columnar phase corresponds to a bidimensional positional order. [3] One other mesophase is acknowledged: the cholesteric phase, or chiral nematic phase, which is a subdivision of the nematic phase. [4] Depictions of these mesophases are presented in Figure 1.1.
Figure 1.1 – a), b), c) Schematics depicting the molecular order of a crystalline structure (solid), a liquid crystal and an isotropic struc-ture (liquid), respectively. d), e), f) Different liquid crystal molecu-lar shapes: calamitic, discotic, and bent -core, respectively.
2 Liquid crystalline materials are also subdivided into thermotropic, lyotropic and barotropic natures, which determine the way they change phases. Regarding thermotropic substances, a transition between phases depends on a temperature variation, while lyotropic and barotropic phase shifts rely on concen-tration and pressure changes, respectively. [4], [5] The mesogenic molecules themselves also come in a variety of geometric shapes, the main ones being calamitic (rod-like), discotic (disc-shaped) and ba-nana-shaped (with bent-cores), illustrated in Figure 1.1. [6]
In a liquid crystalline medium (as exemplified in Figure 1.1), the director n is defined as the vector indicating the average direction of the aligned elongated or flat molecules. Since, in reality, not all mol-ecules point in the exact same direction, we can establish an arbitrary angle θ as the angle between the long axis of a single molecule and the director n. Thus, the observed orientational order can be de-scribed by a one order parameter 〈S〉:
〈𝑆〉 = 〈
12
([3 𝑐𝑜𝑠
2
𝜃] − 1)〉
(1)For a perfectly ordered state, with all molecules being completely aligned with each other and the director n (θ = 0 º), the equation resolves to 〈S〉=1. On the other hand, since in an isotropic medium all molecules are randomly oriented (each molecular axis points in all directions with equal probability), we end up with 〈S〉=0. [2]
1.1.1 Nematic liquid crystals
In nematic substances, though each molecule’s centre of gravity is randomly positioned, a relative orientational order can be found among them. A single molecule’s long range axis is strongly correlated with that of its neighbours which, in turn, is oriented on average with the mesophase’s director n (Figure 1.2). This preferential alignment results in the optical anisotropy in a nematic: a light beam travelling perpendicularly to the director moves at a slower pace than one propagating parallel to the director. [4] In the absence of external stimuli or specific anchoring from surfaces, the orientation of a nematic’s director is randomly distributed. A surface alignment can be induced with a certain kind of anchoring (the main ones being planar, homeotropic and oblique anchoring) in order to produce a preferential direction of the nematic’s director. Due to the broadness of the subject at hand, only planar anchoring regarding nematic liquid crystals will be approached, because of its relevance in this work. [1]
By using surfactants or physically rubbing a surface (under certain conditions), it is possible to induce a planar anchoring. When the liquid crystal molecules come into contact with this surface, they align tangentially to it. Additionally, due to the nematic’s capabilities for long-range orientation, the alignment induced by the surface can, theoretically, propagate throughout the rest of the nematic liquid crystal. [1]
1.1.2 Chiral nematic liquid crystals
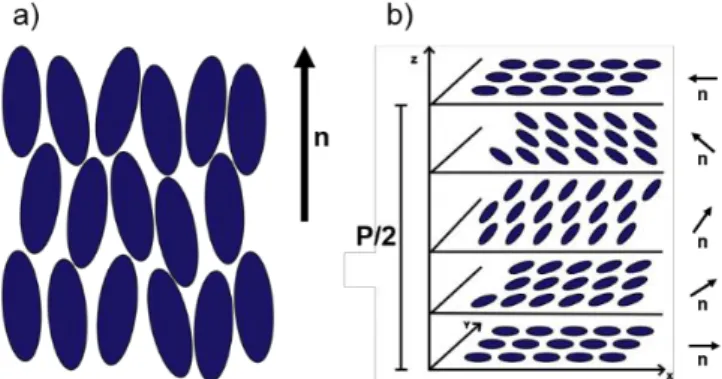
The cholesteric phase (or chiral nematic phase) is commonly formed by adding chiral dopants to a nematic liquid crystalline material. Its physical characteristics are mostly similar to the nematic phase, except for the fact that the molecules tend to align themselves in a helical shape, perpendicular to the director, as illustrated in Figure 1.2 b). The length of a full rotation of the helix (360 º) is denominated as
3 the helical pitch (P). [7] These helical structures are responsible for a cholesteric material’s iridescence, and its selective reflection depending on the incident light’s wavelength and circular polarisation (irides-cence is defined as variation of reflected wavelength based on the angle of incident light). [8] Similar structures have been described in multiple natural examples, such as in the exo-cuticles of certain spe-cies of beetles (Plusiotis batesi). [9]
Observation of a cholesteric structure reveals a reflected wavelength value (λ) which is dependent on the length of the helical pitch (P) and the average refraction index (n) according to de Vries expres-sion (2) [10]:
𝜆 = 𝑛𝑃(𝑠𝑖𝑛 𝜃)
(2)with θ being the angle between the incident light and the cholesteric layers. Therefore, at a normal angle of observation, the reflected light’s wavelength is proportional to the cholesteric helical pitch. [11] The pitch length has been shown to be tuneable by external factors such as temperature and concen-tration. [12]
A chiral nematic material’s intrinsic selective reflection depends on the handedness of the helix, as it can be either left-handed or right-handed. Assuming normal incidence, circularly polarised light with the same handedness of the helix is completely reflected, while an opposite handed circularly polarised light is completely transmitted. [7]
Cholesteric liquid crystals structures can be found in nature as in bacterial nucleoids, algae, cuticles of crustaceans and insects, bone, tendon, cornea, fish scales and scutes, plant cells walls and silk produced by spiders, just to name a few examples. [9], [13] If the cholesteric pitch is in the range of the wavelength of the visible light, vibrant colours can be observed. This so called structural coloration can generate a collection of complex optical effects ranging from iridescent and metallic colours, to brilliant white or black. [9]
Figure 1.2 – a) Schematic representation of a nematic phase, with its director n pointing upward; b) Schematic depiction of a cholesteric phase, where P/2 is half the length of the structure’s pitch.
4
Cellulose and its derivatives
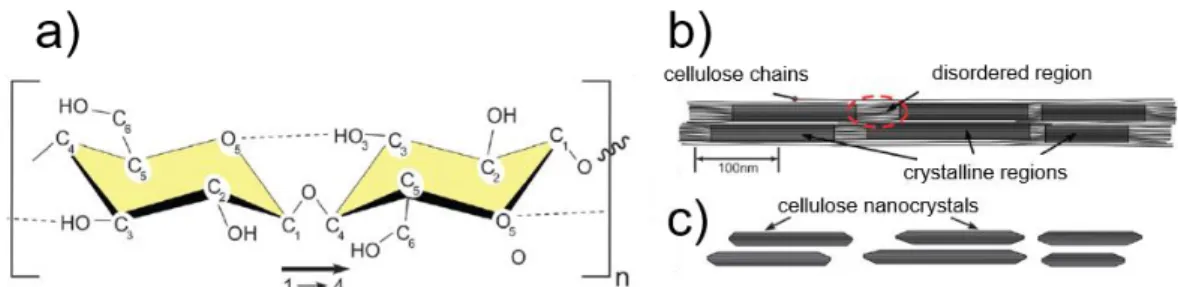
Cellulose is the most abundant of all naturally occurring polymers and can be found in plant cell walls (in fibrillary form), some bacteria, algae and fungi. [14] Its monomer, cellobiose, is composed of two anhydroglucopyranose units twisted 180 º around a β-1,4 linkage (Figure 1.3 a)). Its versatility and out-standing bio-sustainability make it one of the most promising organic compounds in a wide variety of research and industrial areas. [14] There are at least four polymorphs (supramolecular arrangements) of crystalline cellulose, types I through IV. This thesis will focus on cellulose type I, which is naturally obtained from a multitude of organisms (tree, plants, bacteria). Its relevance to this work resides in the fact that, among its various derivatives, cellulose nanocrystals (CNC) can self-assemble into a choles-teric liquid crystalline phase, while suspended in water.
Structurally, cellulose is constituted by a linear chain of cellobiose units, which are aggregated into larger microfibrils (5 – 20 μm of diameter). Within these microfibrils, formed from a bundle of nanofibrils (3 – 20 nm of diameter), the cellulose chains are regionally divided into either crystalline or amorphous domains (Figure 1.3 b)). The extraction of these crystalline regions, through chemical methods such as acid hydrolysis (which dissolves most of the amorphous regions), results in rod-like cellulose nanocrys-tals (Figure 1.3 c)). [15], [16] The exact dimensions of these crysnanocrys-tals depend on the source of the cellu-lose and the reaction’s conditions; a longer reaction time or increased acid concentrations lead to a decrease in both size and sample distribution. [17]
When suspended in water at low concentrations, CNCs form a left-handed lyotropic cholesteric phase. This mesophase is conjectured to be due to electrostatic stabilization conveyed by the CNC surface’s negative charges introduced (after acid hydrolysis) by the sulphate ester groups. [9] A solid film can be produced from the suspension’s full evaporation, in which the resulting pitch length can be short enough for the resulting photonic structure to reflect light in the visible spectrum. [18] This property enables the cholesteric suspension to be used as a template to produce structures with unique optical properties including iridescence and selective circularly polarised light reflection. Normally, this re-sponse is achieved in a so-called evaporation-induced self-assembly process. [9], [16] At a larger scale,
Figure 1.3 – a) Schematic representation of the chemical structure of cellobiose, which constitutes the cellulose monomer cellulose. It is divided into two anhydroglucopyranose units, connected by the shown β-1,4 linkage. b) An illustration of a cellulose microfibril, divided into amorphous and crystalline regions. c) Resulting cellulose nanocrystals after an acid hydrolysis process completely dissolves amorphous regions. Adapted from [15] with permission of The Royal Society of Chemistry.
5 thin CNC films tend to display vast chromatic gradients, however, microscopically, their surface is pop-ulated by small and distinctly coloured domains, which are tied to different periodicities in cholesteric layering and pitch. [10]
The production of CNC films with uniform and controlled optical properties has been proven itself a notable challenge, due to the critical nature of controlling the liquid crystalline phase and its order across the drying process. In this process, the CNCs in suspension are initially in an isotropic (or biphasic) state, self-assembles to a fully cholesteric phase and finally to the solid state, via a glassy state or the kinetically arrested gel. In this glassy state, and due to the increased CNC concentration in the medium, the nanocrystals become sufficiently restricted in their ability to further relax, thus preventing any further cholesteric organization from occurring. [18] Regardless of the phase transition mechanism, should a sufficient amount of time be allocated the cholesteric phase can relax and reduce the probability of structural defects, giving rise to larger domains bearing uniform orientations. [16] From the numerous studies found in literature directed towards the control of optical properties of the CNC films, interesting results were ascertained relating to the fact that the morphology of the final solid structure is influenced by the suspension parameters and the conditions used in the solvent-casting method. These parameters include the CNC concentration on the suspension, the ionic strength of the CNCs, the suspension’s exposure to magnetic field or electric field or shear fields, the drying rate of the solvent; the handedness to the LC mesophase correlated with the energy given to the system from using ultrasonic treatment, and the addition of another compound like glucose, PEG, or electrolytes.[9], [16], [19]–[29] Despite this myriad of studies around the production of CNC films, a consistent degree of control over its optical response and structure has still yet to be fully achieved.
Electro-optical devices and interactions with liquid crystals
Electro-optical devices span a plethora of different components and designs, all of which serving their own specific purpose. These devices can be used as high efficiency light shutters or as privacy windows since they can be electrically controlled to scatter light (off state) or to transmit it (on state). [30] This section will mostly focus on the introduction and functioning principles of electro-optical devices derived from cellulose-based systems, most like the one approached in this thesis.
In 1982, cellulose derivatives composites in electro-optical applications were initially introduced by Craighead et al. [31], followed a few years later by a different type of cellulose derivative electro-optical cell, called cellulose-based polymer dispersed liquid crystal (CPDLC). [32], [33] Due to the convenient match of both the nematic liquid crystal (E7) and HPC’s refraction indexes (1.51 and 1.49, respectively), a very clear ON state is obtained when applying an electric field. The CPDLC cell was composed of a cellulose derivative polymeric film surrounded by two nematic layers sandwiched between two transpar-ent electrically conductive substrates. These cells showed high transmission coefficitranspar-ents values (around 0.8) in the ON state, but their application capabilities suffered greatly from a high turn on field of around 1.5 V/μm, which led to exceedingly high turn-on voltages. [34]
6 More recently, a new type of electro-optical device with improved electro-optical properties was pre-sented, while taking advantage of the high surface area of CNCs. Regarding this later technology, cel-lulose-based electro-optical devices were prepared by stacking, between two transparent conductive glass substrates, two layers of a nematic liquid crystal surrounding a thin CNC film. [35] This type of device allows for a major step forward in its functioning limitations by significantly reducing the turn on electric field and response time.
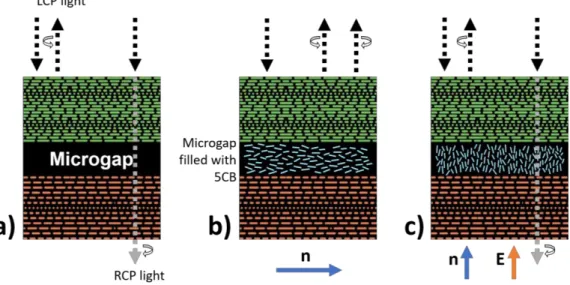
In the scope of the present work, the assembled electro-optical cell consists of a solid cholesteric CNC film sandwiched between two transparent electrodes. The electrodes are rubbed beforehand (as to induce a planar alignment in the nematic liquid crystal), and the device is filled with 4-pentyl-4′-cya-nobiphenyl (5CB) and sealed. Should a micrometric gap form inside the CNC film during the evaporation process (as reported by Fernandes et al. [11]), the 5CB will infiltrate this space. This way, at an optical trajectory perpendicular to the substrates (and collinear with the CNC film’s cholesteric helicoidal axis), it acts as a half-wave retardation plate, converting the handedness of the polarised light from left to right (Figure 1.4 b)). This mechanism allows for the device to reflect both LCP and RCP light. In the presence of an electric field, applied normally to the substrates, the nematic substance’s director reorients itself to match the electric field’s direction, thus reverting the electro-optical cell’s optical properties to those of the CNC film, as is portrayed in Figure 1.4 c). [11]
The formed nematic layer within the film should only behave as a half-wave retardation plate, when the phase difference produced between the ordinary and extraordinary rays (ΔΦ) is equal to π in the following equation (3):
ΔΦ =
Δ𝑛 𝑑𝜆
2𝜋
(3)Figure 1.4 – Schematic of how light interacts with: a) a CNC film with no impregnated 5CB in its microgap; b) a CNC film with 5CB impregnated into its microgap, with a horizontal nematic director; c) a CNC film with 5CB impregnated into its microgap and an electric field pointing upward. Adapted from [11] with permission of John W iley & Sons Inc, the W iley Companies.
7 Where Δn is the nematic crystal’s birefringence value (equal to 0.3 for 5CB), d is the microgap’s height, and λ is the wavelength of the incident light beam. [11]
A change in the nematic director’s orientation is only observed above a certain applied external field threshold, beyond which, the transmissivity of the device gradually increases with the electric field. It is only at this point that the liquid crystal’s elastic forces (strengthened by each substrate’s induced planar anchoring) are overpowered by the external electric forces. This shift in orientation by an external elec-tric field is called a Fréedericksz transition (depicted in Erro! A origem da referência não foi
encon-trada.). [36]
It is only due the 5CB’s dielectric anisotropy that its director aligns parallel to the applied electric field’s direction. Dielectric anisotropy can be either positive or negative, depending on the liquid crystal’s molecular chemical structure. When these molecules have polar groups in their extremities, they carry permanent electric dipoles; when they don’t, the molecules can rearrange themselves in order to origi-nate induced dipoles. Depending on whether the dipole moment is either parallel or perpendicular to the molecule’s most structurally organized axis, the molecules tend to align parallel or perpendicularly to the electric field’s direction, respectively. A substance’s dielectric anisotropy is positive when its director aligns with the electric field’s direction (which is the case for 5CB); it’s negative when its director is perpendicular to the applied field’s orientation. [37]
The main focus of this dissertation was to explore, study and, ultimately, improve the optical response of CNC-based thin films, for further application in cellulose-based electro-optical devices. Multiple vari-ables linked to the production of these CNC films were investigated as to increase LCP light reflectivity and extinguish RCP light reflectivity, while simultaneously aiming to control chromatic and structural homogeneity.
Figure 1.5 – A diagram of the Fréedericksz transition occurring in a nematic liquid crystal with positive dielectric anisotropy. As the elec-tric field is turned on, directed upward, the nematic director aligns upward as well. Adapted from [60].
9
2 Materials and Methods
Production of CNC freestanding films and droplets
2.1.1 CNC production
Microcrystalline Cellulose (MCC; Avicel®, ~50 μm particle size, lot #BCBJ0229V), derived from cot-ton, was purchased from Sigma-Aldrich and sulfuric acid (95 %–97 % purity, Sigma-Aldrich) were used without further treatment.
The preparation of CNC particles was based on the documented method by Gray et al. [38], with small adaptations by Fernandes et al. [11]. Microcrystalline cellulose was hydrolysed in sulfuric acid (95 %, Sigma-Aldrich) with an acid/solid ratio of 8.5:1, at 45 ºC, for 130 minutes, while under continuous stirring. The resulting suspension was washed with ultrapure water in alternating stages of dilution and centrifugation (at 12 000 rpm for 20 minutes, using a Thermo Scientific Heraeus Multifuge X1R Centri-fuge Series) until pH was raised to approximately 1.9–3.9, at which point the supernatant achieves turbidity and the suspension is collected. This resulting suspension was, in turn, placed into cellulose membranes (Spectrum Spectra/Por® 4 dialysis membranes) and dialyzed against ultrapure water (re-placed daily for at least a month) until a constant pH was attained. The suspension was prepared with 3 consecutive cycles of 20 min of sonication over an ice bath using a Hielscher UP400S ultrasonic homogenizer (460 W, 24 kHz, at 0.85 of the cycle and 80% amplitude). Ultrapure water used in the process was purified using a Millipore Elix Advantage 3 water purification system.
The produced suspension was centrifuged and concentrated into an 11 % (w/w) aqueous CNC sus-pension, which in turn, was diluted into 4 other aqueous CNC suspensions, under different concentra-tions: 2.8 % (w/w), 4.6 % (w/w), 7.5 % (w/w), and 9.1 % (w/w).
2.1.2 CNC film production
Freestanding CNC films were produced by solvent evaporation method by depositing CNC suspen-sion (at varying concentrations) onto polystyrene Petri dishes with 35 mm in diameter, under constant ambient conditions, until all the solvent evaporated (verified by constant weight). One freestanding CNC film was produced in the centre of a Bruker AVANCE III 300 MHz widebore solid state NMR with a continuous 7.05 T magnetic field applied perpendicular to the film’s surface for the duration of the evap-oration process.
CNC droplets were cast from a 2.8 % (w/w) aqueous CNC suspension with Easy 40+ micropipettes onto 100 Ω/□ Indium Tin Oxide (ITO)-coated square glass substrates (15x15x0.7 mm). Two replicas for each sample were produced and studied alongside the ones presented in this work. UV exposure of glass substrates was, when applicable, performed inside a Vilber Lourmat BLX-E254 UV-Crosslinker.
Electro-optical device assembly
Electro-optical cells were prepared by casting 40 μL of water/ethanol solution of polyvinyl alcohol (PVA) onto ITO-coated glass substrates’ conductive side as to cover as much surface area as possible.
10 In order to induce a planar orientation onto the substrate, the PVA was carefully rubbed with broad, linear strokes, in a single direction (150 times for each substrate) using a velvet rag. An epoxy glue (Araldite ®) was mixed according to product instructions and a small portion was applied to four corners of one of the substrates. At this point, a small piece of CNC film was placed in the centre of the bottom substrate, and the top substrate was carefully set and lightly pressured on top of the glue drops. The substrates were overlapped in such a way that both substrates’ planar orientations match in direction. The electro-optical devices were filled by capillarity with 4-pentyl-4′-cyanobiphenyl (5CB, K15 Licristal®, supplied by Merck). Electro-optical cells were sealed on all four sides with epoxy glue.
Characterisation
2.3.1 Chemical characterisation
Chemical characterisation via Fourier Transform Infrared (FTIR) spectroscopy was conducted on samples of microcrystalline and nanocrystalline cellulose. FTIR spectra were obtained using an attenu-ated total reflectance (ATR) sampling accessory (Smart iTR) equipped with a single-bounce diamond crystal on a Thermo Nicolet 6700 spectrometer. Spectra were acquired at 20 ºC, with data ranging from 4000 to 650 cm-1, with a 4 cm-1 resolution. 32 scans were done, with an incident angle of 45 º.
2.3.2 Structural and dimensional characterisation
X-Ray Diffraction (XRD) curves were obtained using a PANalytical X’pert PRO model diffractometer, with Bragg-Brentano (θ/2θ coupled) geometry with graphite monochromated Cu KR (1.54 Å) radiation. Data was collected at a scanning step of 2θ=0.00334 º, from 10 º to 40 º.
Thermogravimetric analysis measurements (TGA) were performed using a Netzsch 449 F3 Jupiter®
simultaneous thermal analyser. Each sample was heated from 25 to 550 ºC, at a heating rate of 5 ºC/min.
In order to topographically characterize the CNC films’ surface, and measure the CNC particles’ average length and width, Atomic Force Microscopy (AFM) data was acquired using an Asylum Re-search MFP-3D standalone system in tapping mode, with commercially available silicon AFM probes (scanning frequency of 300 kHz, k=26 N/m). The analysed CNC particles were prepared by casting 1 μL droplets of an ultra-diluted suspension of CNC in water (0.01 % w/w) onto a mica substrate (Musco-vite Mica, V-5 from Electronic Microscopy Sciences). Immediately before deposition, the suspension was sonicated for two consecutive periods of 10 minutes (at 0.85 of the cycle and 80% amplitude).
Captured AFM images were analysed in Gwyddion software (version 2.50, http://gwyddion.net). The process of average dimensional distribution analysis consisted of 100 individual CNC particles’ length and width manual measurements, while average surface roughness distribution was calculated auto-matically by the aforementioned software.
The thickness of freestanding CNC films, films from droplet casted onto glass substrate and electro-optical cells were estimated from at least 10 measurements (if possible) using a Mitutoyo digital microm-eter.
11 Profilometry was used to map the surface of solid CNC films derived from droplets using a KLA Tencor D-600 stylus profilometer. Scanning speed was 0.05 mm/s, while stylus weight applied was 2 mg.
Further surface roughness analysis was performed on the CNC films, by means of total reflection and diffuse reflection, both obtained using a PerkinElmer Lambda 950 UV/VIS/NIR spectrometer. Spec-ular reflection was extrapolated from these results.
Scanning Electron Microscopy (SEM) images of CNC films were acquired with a Carl Zeiss Auriga crossbeam (SEMFIB) workstation instrument equipped with an Oxford energy dispersive x-ray spec-trometer. SEM images were captured in in-lens mode, with an acceleration voltage of 2 kV and an aperture size of 30 μm. Samples were glued onto aluminium substrates using a double-sided carbon tape and were coated with a thin carbon layer (<20 nm) using a Q300T D Quorum sputter coater.
2.3.3 Optical characterisation
All samples’ photographs were taken with a Canon EOS 550D camera, equipped with a Canon EF-S 60mm Macro Lens.
Polarised Optical Microscopy (POM) images were observed using an Olympus BX-51 polarised op-tical microscope connected to an Olympus KL2500 LCD cold light source. LCP and RCP light images were observed using a quarter wave plate along with a linear polariser in the reflection’s optical path. An equipped camera (Olympus DP73) and Olympus Stream Basic 1.9 software were used for image capture.
Spectrometer analysis of the produced CNC films and solid CNC films derived from droplets was measured with a Jobin Yvon H10 VIS monochromator mounted onto an Olympus BH2 optical micro-scope connected to an Olympus TH3 light source.
It is important to note that the POM images (from Olympus BX-51) and reflectance spectra (obtained while using the Olympus BH2) might not coincide exactly since it was not possible to guarantee that the same point of observation is used in both measures.
Contact angle characterisation was performed with a Dataphysics OCA 20 contact angle system supported by a dosing system with an attached needle measuring 0.69 mm in external diameter. Each substrate’s water contact angle (static mode) was measured 10 times in non-overlapping regions, at room temperature, with each H2O sessile drop being 5 μL in volume. Contact angle measurements were
13
3 Results and discussion
This dissertation’s main goal was to optimize and reliably control distinguishing optical properties associated with thin solid films, obtained from solvent casting and evaporated of sessile cast droplets, prepared from anisotropic suspension of cellulose nanocrystals. The film’s optical properties focused on this work are iridescence, selective reflection of left circularly polarised (LCP) light, and transmission of right circularly polarised (RCP) light. As such, several variables in the film production process were studied and correlated with the CNC films’ optical features.
The studied factors include preparation of films from CNC suspensions with different CNC concen-trations, evaporation temperatures of CNC droplets cast onto ITO-coated glass substrates, variation of ITO-coated substrate hydrophobicity and production of thin films while under the effect of a strong mag-netic field. These points of study, mostly applied to CNC evaporated droplets used as a model, aimed to make CNC films thinner, more topographically homogeneous, and displaying improved optical re-sponses. The film with the best optical properties was then impregnated with a nematic liquid crystal, 4-pentyl-4′-cyanobiphenyl (5CB), and assembled in an electro-optical cell. By application of electric field or temperature variation the birefringence of the liquid crystal could be tuned, and the reflected RCP light channel response observed.
CNC characterisation
CNC films, as well as the precursor CNC particles used in this work, were optically, chemically, morphologically, and structurally characterised. The films were studied using their respective central regions, unless otherwise noted. Assembled electro-optical cells were optically characterised.
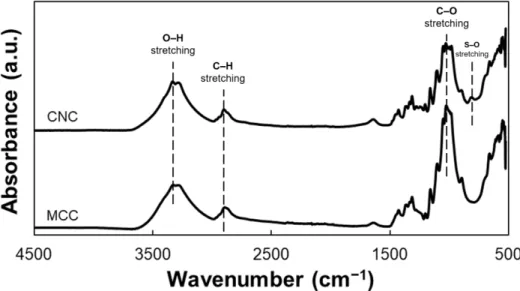
Two FTIR spectra are shown in Figure 3.1, associated with MCC and an aqueous 2.5 % (w/w) CNC suspension.
14 Both samples’ spectra show the same cellulose characteristic peaks (O–H, C–H, and C–O stretching vibrations, at 3400 cm-1, 2900 cm-1, and 1060 cm-1, respectively). Another peak, assigned to S–O bonds
stretching, can be seen due to the presence of sulphate groups on the CNC sample at 817 cm-1; this
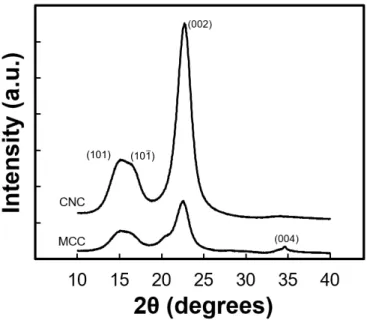
specific peak is absent on the MCC curve, since this sample did not suffer a hydrolysis process. [39] In Figure 3.2, the two x-ray diffraction patterns belonging to MCC and CNC samples can be ob-served.
From the obtained diffractograms, one can identify the main peak (002) at around 2θ = 22.6 º, along with smaller overlapping peaks (101) and (101̅), at 2θ = 14.7 º and 16.8 º, respectively; these are char-acteristic peaks associated with cellulose type I, which confirms that the hydrolytic process does not affect the structural organization of the cellulose within the cellulose nanocrystals. The CNC diffracto-gram displays narrower and sharper peaks, due to its increased crystallinity, a consequence of the acid hydrolysis treatment. [40]
The crystallinity index (IC) was determined using the documented empirical method presented by
Segal et al.. [41] Information extracted from Figure 3.2 can be used in the following equation (3):
𝐼𝑐 =
𝐼(002)−𝐼𝑎𝑚
𝐼(002) × 100 (3)
where I(002) is the maximum diffraction intensity of the (002) lattice peak at a 2θ angle between 21 º
and 23 º. It represents the crystalline counterpart. I(am) is the intensity of diffraction of the amorphous
material, taken at a 2θ angle between 18 º and 20 º, where the intensity is minimal. This calculation method is only valid as a comparison basis between samples.
Figure 3.2 – XRD diffractograms of MCC and CNC samples. (101) (101̅)
15 MCC and CNC crystallinity indexes were calculated to be 76.19 % and 88.94 %, respectively. These values are in good accordance with literature [42], [43]
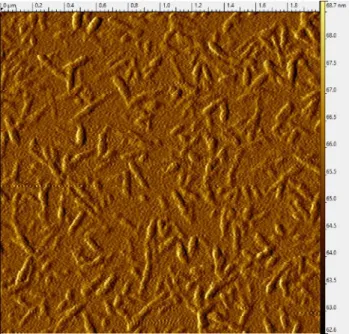
CNC particles were dimensionally characterised using Atomic Force Microscopy. Figure 3.3, below, shows an AFM-captured topographic image of dispersed CNC prepared from a 0.01 % (w/w) aqueous solution, after it has dried, where a rice-like shape can be observed.
CNC particle dimensions were obtained from 150 individual particle measurements on the AFM im-ages and calculated to be, on average, 158 ± 37 nm long and 37 ± 10 nm wide. This equates to an approximate aspect ratio of 4.3:1. All registered measurements are presented in Supporting Information 1. While the average measured length of the particles is coherent with literature as reported by Gaspar
et al. [42] (under similar hydrolysis conditions), the calculated width is marginally larger than what is
expected (reported from 10 measurements from high-resolution SEM images) that might be related with the technique used in this study. Nevertheless, these results showed that the nanoparticles are obtained from the acid hydrolysis of microcrystalline cellulose (~ 50 μm as reported by the supplier).
Figure 3.4 shows the thermogravimetric and DSC curves (along with respective TGA curves) of two samples: the microcrystalline cellulose (MCC) Avicel and the CNC produced by acid hydrolysis of MCC and CNC.
The MCC’s TG curve shows the typical first-order reaction pyrolysis process of the cellulose [44] while the CNC’s TG curve can be subdivided into two main events, as temperature rises. The first weight loss is observed from 50 ºC to 130 ºC and is attributed to a slight loss of mass that occurs in both samples, due to the evaporation of residual water contained in the samples. During the second event, from 150 ºC to 350 ºC, various degradation processes take place, including decomposition, dehydration
Figure 3.3 – An AFM-captured image, in amplitude re-trace mode, displaying a large amount of scattered CNC particles.
16 and depolymerisation of glycoside units. The CNC sample goes through this mass loss in two stages, since it underwent a hydrolysis process performed with H2SO4. The first stage (up to ~ 250 ºC) is
asso-ciated with the degradation of regions more accessible to the sulphate groups, while the second one is understood to be the breakdown of the more crystalline regions of the sample, less affected by the hydrolysis process. On the other hand, the MCC sample’s mass percentage takes an abrupt dive to-wards the end of this thermal interval. The final event, from 350 ºC onward, is linked to the oxidation and breakdown of the samples’ carbon-based residues [42], [45]. Similar curves have been previously obtained by Morais et al.. [39]
When CNC, obtained from acid hydrolysis, are suspended in a dilute aqueous solution, a single isotropic phase is formed due to the electrostatic repulsion experienced by the CNCs’ overall negative charge density. If the concentration of CNC in suspension is increased, phase separation is observed and the sample is divided in two phases: cholesteric liquid crystal or anisotropic and isotropic. [46]. This macroscopic phase separation can be observed (Figure 3.5 a)) in our aqueous CNC suspensions with different content of nanocrystals.
Above a certain critical mass fraction (yet below the tested minimum of 2.8 % (w/w)), a small visible volume fraction of cholesteric liquid phase should begin to form at the bottom of the container, due to its higher density when compared to the isotropic phase. This volume fraction ( ) of anisotropic phase (plotted in Figure 3.5 b)) rises gradually, but not linearly, as verified by Lagerwall et al. [22], until the observed fraction’s phase becomes completely cholesteric, at a certain mass fraction between 7.5 and 9.1 % (w/w).
The POM image relating to the 2.8 % (w/w) suspension (Figure 3.5 c)) reveals a largely isotropic phase, identifiable by the visible black area of which the image is mostly comprised. Some cholesteric fingerprint textures can also be seen. The second sample, with a significantly higher CNC concentration (7.5 % (w/w)), showcases a great amount of tactoids and a visible decrease in isotropic regions (Figure
Figure 3.4 – Thermal analysis of microcrystalline cell ulose and crystalline nanocellulose samples.
17 3.5 d)). The third and final sample (9.1 % (w/w), Figure 3.5 e)), while previously shown to be completely cholesteric at a macroscopic level, still exhibits minimal isotropic regions alongside more fingerprint textures. This should be attributed to the fact that, since the substance isn’t perfectly homogeneous, a completely anisotropic phase is only attainable at relatively higher concentrations.
Freestanding CNC films
By loosely following the presented phase diagram, aqueous CNC suspensions with varying concen-trations of 2.8 %, 4.6 % and 6.1 % (w/w) were evaporated in polystyrene Petri dishes with 35 mm in diameter, at a constant temperature of 18 ºC, for approximately 15 days. The evaporation of this aque-ous suspension give rise to iridescent chiral nematic films that reflect colours in the visible region of the electromagnetic spectra. The resulting freestanding films, referred to as F1, F2, and F3, respectively, are shown in Figure 3.6. Is important to note that the presented films evaporated from different volumes of suspension which consequently, varied their respective thickness. Physical data regarding the pro-duced films is showcased in Table 1.
Figure 3.5 – a) Photograph of phase separatio n observed between cross polaris ers in suspensions of cellulose nanocrystals with CNC content, from left to right, 2.8, 4.6, 7.5 and 9.1 % (w/w); b) Volume fraction of cholesteric plotted as a function of the CNC concentration; POM images of textures obtained in tr ansmission mode for CNC suspension samples with c) 2.8 % (w/w), d) 7.5% (w/w), and 9.1 % (w/w).Scale bars : a) 1 cm c) 100 μm; d) 50 μm; e) 20 μm.
a)
c)
d)
e)
18 Table 1 – Concentrations, film thickness, and suspension volumes associated with each of the studied samples F1, F2 and F3.
Sample [CNC] (% w/w) Film thickness (µm) Suspension volume (ml)
F1 2.8 147 ± 7 10
F2 4.6 43 ± 3 2
F3 6.1 72 ± 6 2
Each film’s superficial features can be linked to the amount and concentration of suspension used to produce it. F1, comparatively to both its counterparts F2 and F3, exhibits the opaquest structure due to its thickness. Likewise, F2 and F3, using 2 ml of suspension, display a more translucid surface, with the former using a less concentrated suspension, which evidently leads to a smoother exterior. This is further illustrated in the comparison between F2 and F3’s RCP channels (Figure 3.6, e) and f)): while both extinguish some percentage of reflected RCP light, the former does so more consistently and ef-fectively.
Another noteworthy aspect to denote is each film’s structural coloration. F1 displays vibrant yel-low/red reflections, along with bright blue tones around its edges whereas, the remaining samples show-case a mostly blue surface. So, the film’s reflection maximum wavelengths were shown to decrease as the CNC concentration in the precursor suspension increases, leading to a smaller average pitch length within the film’s cholesteric layers. Similar correlation of cellulosic derivative concentration and reflecting
Figure 3.6 – Photographs obtained through a), b), c) LCP light channel of F1, F2, and F3, re-spectively and d), e), f) RCP channel light, and F3, rere-spectively. Photographs were captured at an 8 º angle perpendicularly to the substrate. Scale bars: 2 mm.
19 coloration has already been demonstrated by Fernandes et al. [47] for other cellulosic derivatives such as hydroxypropyl cellulose (HPC) while in aqueous solution. The authors demonstrated that HPC/H2O
solutions with 60 % (w/w) of HPC present a red wavelength reflection that is shifted to lower wavelengths as the concentration increases, resulting in a solution with a purple coloration at 65 % (w/w). The ob-servation of F1 – F3 by optical microscopy with circularly polarised light and the spectra obtained for each observation (showed in Figure 3.7) are in good agreement to what is macroscopically observed. Assuming an ideal cholesteric structure along the entire vertical extension of the film, the RCP channel image should be perfectly black. All three samples, however, do reflect RCP light, as pictured in Figure 3.7, d) – f), which is a main indicator of poorly organized cholesteric layers, both spatially and orienta-tionally [48]. The films also display a vast array of colours in their LCP channel, further evidenced by large calculated spectral widths of ~ 200 nm for F2 and F3, and 158 nm for F1.
The spectral width of a LCP reflectivity curve is merely the Full Width at Half Maximum (FWHM) value for each peak. [48] A narrower FWHM value signifies a smaller spectral width, which in turn is
Figure 3.7 – a), b), c) POM reflection images of the LCP light channel at the centre of F1, F2, and F3, respectively; d), e), f) POM reflection images of the RCP light channel at the centre of F1, F2, and F3, respectively; g), h), i) LCP and RCP reflectivity spectra, measured for wavelengths from 350 to 800 nm, of samples F1, F2, and F3, respectively. Scale bars for a) –
20 associated with a short amount of chromatic variance in the analysed reflected light. As such, a region with a narrow spectral width is expected to demonstrate a better cholesteric arrangement, with less physical and optical defects.
In the end, due to its low spectral width and vibrant macroscopic colours, an aqueous CNC concen-tration of 2.8 % (w/w) was determined to potentially provide optimal results in the future. Since a large amount of cellulose nanocrystals suspension is necessary to produced films, like the ones presented above, the study of different experimental conditions on films preparation was ascertained with sessile droplets cast onto the ITO-coated substrates, which are used in electro-optical cells.
Varying the evaporation rate of drop-cast CNC films
The solid films presented in Figure 3.8 were produced from 10 μL droplets of aqueous CNC suspen-sion (2.8 % w/w) cast onto an ITO-coated glass substrate, which underwent complete evaporation at three different temperatures: 3 ºC, 22 ºC, and 60 ºC. From this point on, the films shall be denominated as T1, T2, and T3, respectively.
At a macroscopic scale, a heterogeneous colour pattern between the three samples can be identi-fied, becoming more prevalent as the evaporation temperature increases (Figure 3.8 a) versus c)). T1’s
T1
T2
T3
Figure 3.8 – Photographs of CNC films a), b), c) T1, T2, and T3 observed through unpolarised white light, respectively; d), e) T1 observed through LCP and RCP light channels, respectively; f), g) T2 observed through LCP and RCP light channels, respectively; h), i) T3 observed through LCP and RCP light channels, respectively. Pictures from d) to i) were cropped in half, as to better inspect the difference between each channel. Scale bars: 1 mm.
21 central surface presents bright orange, which increases in wavelength to a deep red, as we move to-wards the film’s edge. In sample T2, a similar pattern can be seen, but starting at the blue end of the spectrum, in the centre, and reaching red tones at the perimeter, where hints of uncoloured regions also begin to show. The remaining film, T3, displays a consistently blue central area, but the formed outer ring doesn’t seem to reflect colour this time around.
Films produced from the evaporation of the sessile droplets at higher temperatures (T2 and T3) display what has been reported as the “coffee stain” effect. [19] This phenomenon, occurring in similarly cast CNC aqueous suspensions, consists of the appearance of a concentric ring along the outer edge of the circular droplet, chromatically and topologically different.
The coffee stain effect, first coined by Deegan et al. [49], is described as the migration of solids in a drying drop directed towards its outer edge, known as the contact line, thus forming a solid ring after full evaporation (Figure 3.9 c)). This occurs due to the existence of a pinned contact line, making the fluid flow outwards in order to compensate for evaporative losses. This way, evaporation rate at a point closer to the contact line is greater than that at the centre of the droplet (Figure 3.9 a), b)). [49]
In this specific experiment, the concentric ring observed in T2 and T3 appears to increase in radius with temperature. Additionally, the film’s iridescent properties falter in the mentioned region, as well as its reflective response to right circularly polarised light, both of which are potential symptoms of an un-organized chiral nematic structure. [48]
Each of the samples’ different regions was analysed under a polarised optical microscope (Figure 3.10 a) – f)), in reflection mode. Captured images (Figure 3.10, a) – f)) are of each solid droplet’s central region.
It was previously confirmed that, at a macroscopic level, T1 shows the most consistent optical re-sponse throughout its surface area (Figure 3.8 a)). However, T3’s centre region does a better job at extinguishing RCP reflected light (Figure 3.10 f)), when compared to the same area in other samples (Figure 3.10 d) and e)). Additional evidence to support this comes from the region’s LCP and RCP spectra (Figure 3.10 i)), where the RCP reflectivity band stands lower than the other samples’ RCP peaks.
Figure 3.9 – Process of evaporation of a drop of aqueous suspension. Adapted by permission from Nature, Larson, R. G. In Retrospect: Twenty years of drying droplets. Nature, 550(7677), 466 -467., 2017.
22 T3’s LCP optical response (exclusively in its centre) is also noteworthy, as it is associated with the lesser of the three samples’ spectral width (153 nm), implying that the measured region displays the most chromatically homogeneous reflection, nevertheless a dimmer colour is observed.
Observed optical responses, which vary with film region and evaporation temperature, can be linked back to the “coffee-stain” effect. Although the cause for the coffee stain effect observed in droplets has yet to be correlated with thermal conditions during evaporation process, this demonstrated behaviour suggests that the coffee ring effect is lessened at lower temperatures of evaporation. One should stress that this correlation should not be necessarily related to the temperature of evaporation itself, but instead might be linked to the duration of the evaporation process, which is maximized at lower temperatures. In other words, as we decrease a droplet’s temperature of evaporation, which in turn lowers its rate of evaporation, the droplet vaporizes at a more homogeneous pace, allowing for an even more flawless assembly along the cholesteric layers and fully dissipating the “coffee stain” effect. Alongside this ex-periment, a study on evaporation rate was performed for the three tested temperatures. From 50 μl droplets, average evaporation rate at 60 ºC was approximately 10 times faster than the rate at 3 ºC
Figure 3.10 – a), b), c) POM reflection images of the LCP light channel at the centre of T1, T2, and T3, respectively; d), e), f) POM reflection images of the RCP channel at the centre of T1, T2, and T3, respectively; g), h), i) LCP and RCP reflectivity spectra, meas-ured for wavelengths from 350 to 800 nm, of samples T 1, T2, and T3, respectively. Scale bars for a) – f): 50 μm.
23 (approximate rates of-1 mg/min vs. -0.1 mg/min). More details are available in Supporting Information 2.
Observed topography (Figure 3.11) matches reported results in literature [19] for T2 film, and afore-mentioned optical results. While T1 demonstrates a round surface, the other droplets show a concave surface (associated with the “coffee stain” effect). This physical manifestation becomes more prevalent at a higher evaporation rate (T3), and the particle build-up gradient between the centre and edges of the film becomes quite noticeable. In fact, the film thickness at the centre of T1 nearly quadruples relative to T3’s central section (40 μm vs. 10 μm). As such, one can argue that T3’s favourable LCP and RCP responses in its centre region might be merely linked to the evaporation process itself. An outward flow during the evaporation process should imply that the suspended particles at the centre of the evaporat-ing drop-cast film are more still, while the ones closer to the contact line have a harder time relaxevaporat-ing. This way, cholesteric arrangement at the edges might be negatively affected; at the centre, on the other hand, it may be enhanced.
With that, the next step to optimize a CNC film’s optical response is to combine a slow evaporation process, which could grant the film its homogeneous colour and superficial structure, with a method to thin it even further.
Improving the substrate’s hydrophilicity
Results reviewed thus far indicate that CNC droplets evaporating at lower temperatures display bet-ter reflective and structural properties than those at higher temperatures. From this point forward, the variables were explored optimal droplet using an evaporation temperature of around 3 ºC, as established from previous conclusions.
Work focus shifted onto other potential film optimizations: reducing film thickness (while still aiming for a homogeneous surface) and further extinguishing of RCP reflected light. As such, in the interest of reducing film thickness, the substrate’s hydrophobic properties were investigated. In order to increase droplet spread on the ITO-coated glass substrate, which demonstrates high intrinsic hydrophobicity (with an average contact angle of ~ 107 ± 3 º was measured), the effects of prolonged exposure to ultraviolet (UV) radiation were tested with varying exposure intervals.
Figure 3.11 – Profilometer scans across the T1, T2 and T3 solid films obtained from 2.8 % (w/w) CNC suspension droplets on ITO -coated glass substrates obtained at 3 ºC, 22 ºC, and 60 ºC, respectively.