Correspondence:
Janmille Valdivino da Silva Instituto Federal de Educação, Ciência e Tecnologia do Rio Grande do Norte
Av. José Rodrigues de Aquino Filho, 640, RN 120 Alto de Santa Luzia 59215-000 Nova Cruz, RN, Brasil E-mail: janmillevs@yahoo.com.br
Received: Nov 17, 2016
Approved: May 8, 2017
How to cite: Silva JV, Roncalli AG. Individual and contextual factors associated to the self-perception of oral health in Brazilian adults. Rev Saude Publica. 2018;52:29.
Copyright: This is an open-access article distributed under the terms of the Creative Commons Attribution License, which permits unrestricted use, distribution, and reproduction in any medium, provided that the original author and source are credited.
http://www.rsp.fsp.usp.br/
Individual and contextual factors
associated to the self-perception of oral
health in Brazilian adults
Janmille Valdivino da SilvaI, Angelo Giuseppe Roncalli da Costa OliveiraII
I Universidade Federal do Rio Grande do Norte. Faculdade de Odontologia. Programa de Pós-Graduação em Saúde Coletiva. Natal, RN, Brasil
II Universidade Federal do Rio Grande do Norte. Faculdade de Odontologia. Departamento de Saúde Coletiva. Natal, RN, Brasil
ABSTRACT
OBJECTIVE: To analyze how individual characteristics and the social context, together, are associated with self-perception of the oral health.
METHODS: A multilevel cross-sectional study with data from the Brazilian National Health Survey 2013, the United Nations Development Program, and the National Registry of Health Establishments. The explanatory variables for the “oral health perception” outcome were grouped, according to the study framework, into biological characteristics (sex, color, age), proximal social determinants (literacy, household crowding, and socioeconomic stratification), and distal (years of schooling expectancy at age 18, GINI, Human Development Index, and per capita income). The described analysis was performed, along with bivariate Poisson analysis and multilevel Poisson analysis for the construction of the explanatory model of oral health perception. All analyzes considered the sample weights.
RESULTS: Both the biological characteristics and the proximal and distal social determinants were associated with the perception of oral health in the bivariate analysis. A higher prevalence of bad oral health was associated to lower years of schooling expectancy (PR = 1.31), lower per capita income (PR = 1.45), higher income concentration (PR = 1.41), and worse human development (PR = 1.45). Inversely, oral health services in both primary and secondary care were negatively associated with oral health perception. All the biological and individual social characteristics, except reading and writing, made up the final explanatory model along with the distal social determinants of the Human Development Index and coverage of basic care in the multilevel analysis.
CONCLUSIONS: Biological factors, individual and contextual social determinants were associate synergistically with the population’s perception of oral health. It is necessary to improve individual living conditions and the implementation of public social policies to improve the oral health of the population.
INTRODUCTION
Individual self-perception of health has been increasing its importance as a parameter for health status assessment of the population. As a measure, it can be considered a strong health predictor due to its relationship with clinical conditions and other indicators of both morbidity and mortality1.
In some countries with huge populations (as in Brazil), performing epidemiological population-based studies is usually very expensive and requires a great amount of both human and technological resources. In addition, clinical examinations are needed in
some studies, increasing the resources needed and hence making them unfeasible2,3. The
self-perception of health associated with treatment needs, as well as the degree of satisfaction with health status, have been used more frequently in health surveys.
Therefore, some population-based studies such as the National Health Research (PNS),
performed between 2013 and 2014, have used the self-perception of the Brazilian population to obtain information about morbidity, risk factors, and healthy lifestyles4.
It is important to highlight the subjectivity beyond the self-assessment of health because its measure is a result of a complex web of factors, which includes individual characteristics, personal experiences, and also the environment where these subjects are living5,6. Nogueira7
indicates that the production and distribution of health is associated a relationship that
man keeps with the social world. Mansuyr et al.5 observing the relationship between social
environment and health in 45 countries showed an association between socioeconomic inequality and social capital with a self-perception of health, strengthening the importance of the theory of social health determination.
Regarding oral health, this context is no different. Oral health self-perception is also associated
with individual factors and usually reveals an association with social factors8–10. In Brazil, the
poor perception of oral health has been associated with low income and schooling, deteriorated housing conditions, inequality of income distribution, among other social factors6,11.
As a perspective to analyze the oral health conditions of populations, studies on social health
determinants have been considered relevant for the identification of future strategies focused
on oral health promotion. Considering that oral health promotion refers to actions on the social health determinants, aimed at favorably impacting the quality of life of individuals, according to the World Health Organization.
Despite this, nowadays, few studies11–14 have analyzed the association of both individual
and contextual characteristics, together, with the oral health perception. Thus, this study
aimed to analyze how individual conditions in combination with the social context where they are living are associated with the oral health perception in Brazilian adult population.
METHODS
Study of the association between a dependent variable (oral health self-perception) and several independent variables, using a multilevel regression model. Secondary data were gathered from
the PNS 2013 database, the main source of our individual data. This database was linked to two
others, both with aggregated data from the state (the Brazilian federation unit) level: (a) the National Census, performed by the Brazilian Institute of Geography and Statistics (IBGE) with data compiled by the Brazilian agency of the United Nations Development Program (UNDP), which has created several indicators such as the Human Development Index (HDI) among others, and (b) the National Health Facilities Register (CNES), which contains information concerning public and private health services for the whole country.
There are several models for the social health determinants. Most of them have a similar
We decided on the model proposed by Dalgren and Whitehead, based on layers representing
specific levels of determination. In the first level, determinants are related to individual
characteristics (age, sex, and genetic factors). In a second layer, above the previous one, there are the individual lifestyle factors and another layer representing the social and community networks. In the outermost layer, there are the general socioeconomic, cultural,
and environmental conditions15.
The theoretical model was built taking this model as a reference and including recent findings
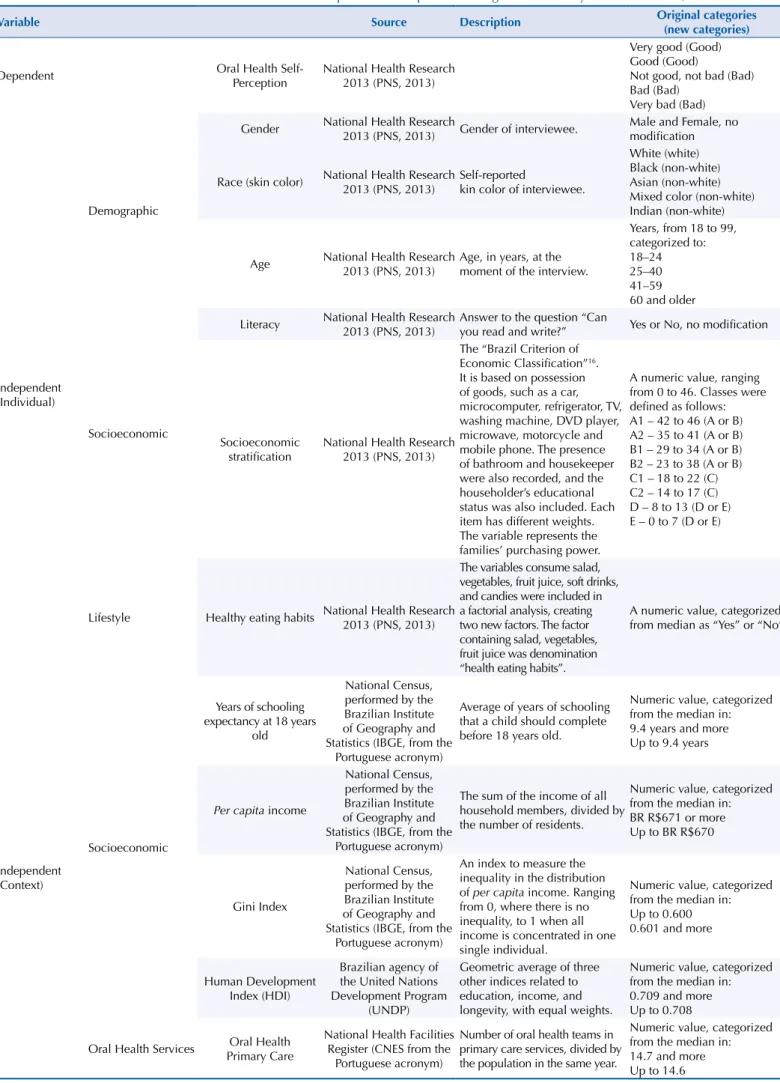
regarding the factors associated to oral health perception (Figure). As proximal factors, we included the variables sex and skin color and healthy eating habits, representing lifestyle factors. For the socioeconomic characteristics, the model has included classical factors related to socioeconomic status (an indicator based on possession of goods) and formal education. All these variables were gathered from the PNS 2013 (Table 1).
The PNS 2013 was a national household-based survey that aimed to characterize the health
status and lifestyles of the Brazilian population, as well as aspects related to health care16.
This survey was based on cluster sampling, using three stages: census tracks (Primary Sample
Unity – PSU); households (Secondary Units) and an adult resident (Tertiary Unit) selected
from a list made at the time of the interview. Due to this, the survey has different sample weights for the PSU, for the households, and for the selected resident. Thus, data from more
than 60 thousand adults were used, which were selected for the interviews, and the analysis considered the complex sample design.
In the distal level, we included variables related to socioeconomic context plausibly
associated with oral health status. Therefore, we included the average of per capita income, the Gini index, representing income inequality, and the years of schooling expectancy at 18 years old, meaning the educational context. We also included the Human Development Index (HDI), which is a combined measure of income, education, and longevity. We included the presence of oral health teams in primary care services, which means the population coverage and hence the possibility to obtain access to oral health services (Figure).
Multilevel modeling was used to assess both individual and contextual determinants. In multilevel analysis, the contextual levels can be considered as social aggregates, as they
have a significant effect on their members. Therefore, individuals are usually considered as the first (lowest) level and the communities (neighborhood, cities or states, for example)
where they are living are the second (upper) level17.
All variables were analyzed to verify the presence of missing data and outliers. From the PNS 2013, we extracted 64,308 records, corresponding to all the individuals interviewed, of
18 years and older. The PSN 2013 sample was representative for a Brazilian adult population aggregated at the State level. There were no missing data for age, skin color, reading and writing ability, socioeconomic stratification (Brazil Criterion18), healthy eating habits, and
all contextual variables. Oral health perception had 6.4% of missing data and sex had only
three missing cases. According to Hair Jr et al.19, missing data below 10% can be ignored,
as long as they are missed at random. The missing data were Missing Completely at Random (MCAR). As we used complete data and also considering the sample size, the significance of associations was not affected. The final model counted a sample of 60,199 individuals.
At the contextual level, all data were available.
A descriptive analysis was performed, aiming to identify cut-off points or other criteria to categorize the variables. As the final variables were created, association tests such as Rao
Scott chi-square test were performed between the outcome (oral health self-perception) and
all independent variables, selecting those with p-value ≤ 0.2, to be included in the multiple
regression. Poisson regression analysis with robust variance was initially performed at an
Table 1. Individual and contextual variables. General description and adaptation strategies of the analysis model. Brazil, 2013.
Variable Source Description Original categories
(new categories)
Dependent Oral Health
Self-Perception
National Health Research 2013 (PNS, 2013)
Very good (Good) Good (Good)
Not good, not bad (Bad) Bad (Bad)
Very bad (Bad)
Independent (Individual)
Demographic
Gender National Health Research
2013 (PNS, 2013) Gender of interviewee.
Male and Female, no modification
Race (skin color) National Health Research 2013 (PNS, 2013)
Self-reported
kin color of interviewee.
White (white) Black (non-white) Asian (non-white) Mixed color (non-white) Indian (non-white)
Age National Health Research 2013 (PNS, 2013)
Age, in years, at the moment of the interview.
Years, from 18 to 99, categorized to: 18–24 25–40 41–59 60 and older
Socioeconomic
Literacy National Health Research 2013 (PNS, 2013)
Answer to the question “Can
you read and write?” Yes or No, no modification
Socioeconomic stratification
National Health Research 2013 (PNS, 2013)
The “Brazil Criterion of Economic Classification”16. It is based on possession of goods, such as a car, microcomputer, refrigerator, TV, washing machine, DVD player, microwave, motorcycle and mobile phone. The presence of bathroom and housekeeper were also recorded, and the householder’s educational status was also included. Each item has different weights. The variable represents the families’ purchasing power.
A numeric value, ranging from 0 to 46. Classes were defined as follows: A1 – 42 to 46 (A or B) A2 – 35 to 41 (A or B) B1 – 29 to 34 (A or B) B2 – 23 to 38 (A or B) C1 – 18 to 22 (C) C2 – 14 to 17 (C) D – 8 to 13 (D or E) E – 0 to 7 (D or E)
Lifestyle Healthy eating habits National Health Research 2013 (PNS, 2013)
The variables consume salad, vegetables, fruit juice, soft drinks, and candies were included in a factorial analysis, creating two new factors. The factor containing salad, vegetables, fruit juice was denomination “health eating habits”.
A numeric value, categorized from median as “Yes” or “No”
Independent (Context)
Socioeconomic
Years of schooling expectancy at 18 years
old
National Census, performed by the Brazilian Institute of Geography and Statistics (IBGE, from the
Portuguese acronym)
Average of years of schooling that a child should complete before 18 years old.
Numeric value, categorized from the median in: 9.4 years and more Up to 9.4 years
Per capita income
National Census, performed by the Brazilian Institute of Geography and Statistics (IBGE, from the
Portuguese acronym)
The sum of the income of all household members, divided by the number of residents.
Numeric value, categorized from the median in: BR R$671 or more Up to BR R$670
Gini Index
National Census, performed by the Brazilian Institute of Geography and Statistics (IBGE, from the
Portuguese acronym)
An index to measure the inequality in the distribution of per capita income. Ranging from 0, where there is no inequality, to 1 when all income is concentrated in one single individual.
Numeric value, categorized from the median in: Up to 0.600 0.601 and more
Human Development Index (HDI)
Brazilian agency of the United Nations Development Program
(UNDP)
Geometric average of three other indices related to education, income, and longevity, with equal weights.
Numeric value, categorized from the median in: 0.709 and more Up to 0.708
Oral Health Services Oral Health Primary Care
National Health Facilities Register (CNES from the
Portuguese acronym)
Number of oral health teams in primary care services, divided by the population in the same year.
from each dimension were included (demographic, socioeconomic, lifestyle etc.). The term
of interaction between the socioeconomic contextual and individual variables was created to analyze the cross-level interaction.
RESULTS
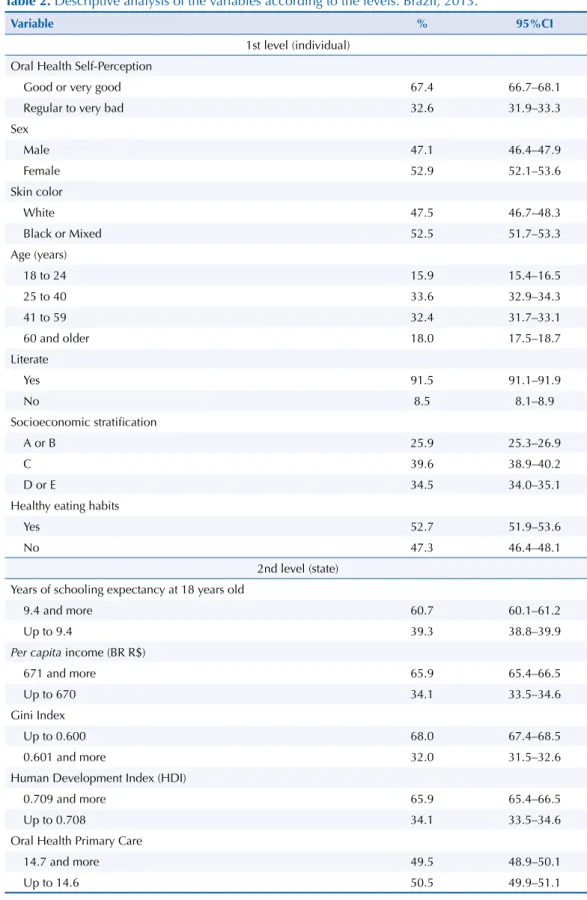
Regarding the general characteristics of the sample, 52.9% were women, 52.5% self-reported
as non-white, 66.0% were aged between 25 to 59 years, 91.5% were literate, 39.6% were “class C” according to the “Brazil criterion” and 52.7% were individuals with healthy eating habits. The years of schooling expectancy was 9.6 years and the average per capita income was
R$729.00. Gini index presented an average of 0.577, HDI was 0.711. The population rate of
oral health teams in primary care was 14.39 and 0.53 per 100,000 inhabitants. In general, 67.4% of interviewees related their oral health as being good or very good (Table 2).
Bivariate analysis at the individual level showed that women had better oral health than men (PR = 0.91, 95%CI 0.87–0.95) and the prevalence of bad oral health in non-white people was
40.0% higher than in white people (PR = 1.40, 95%CI 1.34–1.47). There was an increase in the prevalence of bad oral health as age increased (p < 0.001). The association with socioeconomic stratification and healthy eating habits also showed a dose-response effect. The worse the classification of the independent variable, the worse the prevalence of bad oral health.
A higher prevalence of bad oral health was associated to lower years of schooling expectancy
(PR = 1.31, 95%CI 1.26–1.37), lower per capita income (PR = 1.45, 95%CI 1.39–1.52), higher
income concentration (PR = 1.41, 95%CI 1.35–1.47), and worse human development (PR = 1.45, 95%CI 1.39–1.52). Inversely, oral health primary care services were negatively associated with oral health perception. A higher prevalence of good oral health was present in places with lower coverage for these services (Table 3).
Concerning multilevel modeling, the initial null model indicated that there is compelling evidence that the between-community (in our case, states) variance is non-zero, as the
Likelihood Ratio (LR) test statistic is 502.05 with a corresponding p-value ≤ 0.001 (Table 4).
Distal Proximal Biological
Human Development Index
Gini Index
Per capita income
Gender Skin color
Age
Oral Health Services
Oral Health Self Perception
Polical and Socioeconomic Context
Literacy Income and Education
Socioeconomic Stratification
Lifestyle
Healthy eating habits Years of schooling
expectancy at 18 years old
Table 2. Descriptive analysis of the variables according to the levels. Brazil, 2013.
Variable % 95%CI
1st level (individual)
Oral Health Self-Perception
Good or very good 67.4 66.7–68.1
Regular to very bad 32.6 31.9–33.3
Sex
Male 47.1 46.4–47.9
Female 52.9 52.1–53.6
Skin color
White 47.5 46.7–48.3
Black or Mixed 52.5 51.7–53.3
Age (years)
18 to 24 15.9 15.4–16.5
25 to 40 33.6 32.9–34.3
41 to 59 32.4 31.7–33.1
60 and older 18.0 17.5–18.7
Literate
Yes 91.5 91.1–91.9
No 8.5 8.1–8.9
Socioeconomic stratification
A or B 25.9 25.3–26.9
C 39.6 38.9–40.2
D or E 34.5 34.0–35.1
Healthy eating habits
Yes 52.7 51.9–53.6
No 47.3 46.4–48.1
2nd level (state)
Years of schooling expectancy at 18 years old
9.4 and more 60.7 60.1–61.2
Up to 9.4 39.3 38.8–39.9
Per capita income (BR R$)
671 and more 65.9 65.4–66.5
Up to 670 34.1 33.5–34.6
Gini Index
Up to 0.600 68.0 67.4–68.5
0.601 and more 32.0 31.5–32.6
Human Development Index (HDI)
0.709 and more 65.9 65.4–66.5
Up to 0.708 34.1 33.5–34.6
Oral Health Primary Care
14.7 and more 49.5 48.9–50.1
Up to 14.6 50.5 49.9–51.1
Table 3. Bivariate associations between outcome and the independent variables according to the levels. Brazil, 2013.
Variable
Oral Health Self-Perception
p PR (95%CI)
Good/Very good Regular to very bad
% 95%CI % 95%CI
1st level (individual)
Sex
Male 65.8 64.7–66.8 34.2 33.2–35.3 < 0.001 1
Female 68.9 68.0–69.8 31.1 30.2–31.9 0.91 (0.87–0.95)
Skin color
White 73.1 72.2–74.1 26.9 25.9–27.8 < 0.001 1
Black or Mixed 62.3 61.3–63.3 37.7 36.7–38.7 1.40 (1.34–1.47)
Age (years)
18 to 24 74.5 72.7–76.1 25.5 23.9–27.9 < 0.001 1
25 to 40 70.8 69.7–71.9 29.2 28.1–30.3 1.14 (1.06–1.24)
41 to 59 63.3 62.0–64.6 36.7 35.4–38.0 1.44 (1.34–1.55)
60 years and older 62.3 60.6–63.9 37.7 36.1–39.4 1.48 (1.36–1.60)
Literate
Yes 68.9 68.2–69.6 31.1 30.4–31.8 < 0.001 1
No 51.6 49.2–54.1 48.4 45.9–50.8 1.55 (1.47–1.64)
Socioeconomic stratification
A or B 74.9 73.5–76.3 25.1 23.7–26.5 < 0.001 1
C 67.4 66.4–68.5 32.6 31.5–33.6 1.30 (1.22–1.38)
D or E 61.8 60.7–62.8 38.2 37.2–39.3 1.53 (1.44–1.62)
Healthy eating habits
Yes 72.5 71.5–73.4 27.5 26.6–28.5 < 0.001 1
No 61.8 60.8–62.8 38.2 37.2–39.2 1.39 (1.33–1.45)
2nd level (state)
Years of Schooling Expectancy at 18 years old
9.4 and more 71.0 70.0–72.0 29.0 28.0–30.0 < 0.001 1
Up to 9.4 61.9 60.9–62.9 38.1 37.1–39.1 1.31 (1.26–1.37)
Per capita income (BR R$)
671 and more 71.8 70.8–72.7 28.2 27.3–29.2 < 0.001 1
Up to 670 59.0 58.0–60.0 41.0 40.0–42.0 1.45 (1.39–1.52)
Gini Index
Up to 0.600 71.2 70.2–72.1 28.8 27.9–29.8 < 0.001 1
0.601 and more 59.5 58.4–60.5 40.5 39.5–41.6 1.41 (1.35–1.47)
Human Development Index (HDI)
0.709 and more 71.8 70.8–72.7 28.2 27.3–29.2 < 0.001 1
Up to 0.708 59.0 58.0–60.0 41.0 40.0–42.0 1.45 (1.39–1.52)
Oral Health Primary Care
14.7 and more 63.8 62.8–64.9 36.2 35.1–37.2 < 0.001 1
Up to 14.6 71.0 69.9–72.0 29.0 28.0–30.1 0.80 (0.77–0.84)
model and the LR test showed that the contextual effect maintained its significance. A better adjustment was verified for HDI and socioeconomic stratification (especially “D or E” class).
this assumption, we also performed stratified analyses, observing the values of RP for the association between oral health perception and socioeconomic stratification for each category of HDI. There were no differences in these values, therefore, these results indicate
that there are no cross-level interactions.
Table 4. Poisson multilevel regression analysis for bad oral health self-perception according to individual and contextual variables. Brazil, 2013.
Variable Null Model
(n = 60,202)
Model 1 (n = 60,199) Model 2 (n = 60,199) Final Model (n = 60,199)
PR (95%CI) p PR (95%CI) p PR (95%CI) p
1st Level (individual)
Sex
Male 1 1 1
Female 0.94 (0.92–0.97) < 0.001 0.94 (0.92–0.97) < 0.001 0.94 (0.91–0.97) < 0.001
Skin color
White 1 1 1
Black or Mixed 1.19 (1.15–1.23) < 0.001 1.18(1.15–1.22) < 0.001 1.19(1.16–1.23) < 0.001
Age (years)
18 to 24 1 1 1
25 to 40 1.16 (1.10–1.22) < 0.001 1.16(1.10–1.22) < 0.001 1.17(1.11–1.22) < 0.001
41 to 59 1.44 (1.37–1.51) < 0.001 1.44 (1.37–1.51) < 0.001 1.47 (1.40–1.54) < 0.001
60 and older 1.49 (1.42–1.58) < 0.001 1.50 (1.42–1.58) < 0.001 1.57 (1.49–1.65) < 0.001
Literate
Yes 1 1 –
No 1.17 (1.12–1.22) < 0.001 1.17 (1.12–1.22) < 0.001 –
Socioeconomic stratification
A or B 1 1 1
C 1.18 (1.13–1.23) < 0.001 1.17 (1.13–1.22) < 0.001 1.18 (1.13–1.23) < 0.001
D or E 1.24 (1.19–1.29) < 0.001 1.24 (1.17–1.29) < 0.001 1.27 (1.21–1.31) < 0.001
Healthy eating habits
Yes 1 1 1
No 1.32 (1.28–1.36) < 0.001 1.31 (1.27–1.35) < 0.001 1.33 (1.29–1.37) < 0.001
2nd level (state)
Years of Schooling Expectancy at 18 years old
9.4 and more 1
-Up to 9.4 1.02 (0.95–1.10) 0.503
-Gini Index
Up to 0.600 1
-0.601 and more 1.02 (0.94–1.10) 0.659
-Human Development Index (HDI)
0.709 and more 1 1
Up to 0.708 1.16 (1.07–1.26) < 0.001 1.19 (1.12–1.26) < 0.001
Oral Health Primary Care
14.7 and more 1
Up to 14.6 0.93 (0.88–0.98) 0.009
Fixed Effects
Intercept (95%IC) -1.06 (-1.13– -0.99) 0.18 (0.17–0.19) 0.16 (0.15–0.17) 0.16 (0.15–0.18)
Random effects
Variance (95%CI) 0.029
(0.016–0.050)
0.011 (0.006–0.021)
0.004 (0.002–0.008)
DISCUSSION
Both individual factors and characteristics of the context where people live were synergistically associated in their perception of oral health, as has been found in other studies11,14,20. This study has
proposed a multilevel analysis to assess the social determinants of self-reported oral health status,
understanding that only individual factors cannot be sufficient to explain how oral health status
is perceived by people. Our perspective is that an individual is embedded in a collective context
with social, economic, and political characteristics, which profoundly differ regardless of the scale
of territory, as inequalities can be expressed in countries, states, cities and even neighborhoods.
Human Development Index, as a measure of the quality of life, maintained a significant effect,
thus showing that better oral health is present in individuals living in places with higher HDI.
This fact shows us the importance of investment in social public policies to enhance the
population’s quality of life, and hence their oral health perception21. Other contextual variables,
such as Gini index, lost their significance after adjustment, very likely due to its small variation
among the Brazilian federative units. According to Barros et al.22, despite showing better
indicators in the South and Southeast regions, income inequality is still uniform throughout
the whole country, probably because inequality is affected more by national economic policies
and less by state-level interventions. Wilkinson and Pickett23 pointed out that the association
between income inequality and health are more likely to be found in studies performed with large areas, usually international studies that use countries as a unit of analyses. In studies where the analyses were done in states, cities or regions, even in small units, such as counties, neighborhoods or census tracks, the results are usually inconclusive.
The results for oral health services in primary care have shown that places with higher coverage
for these services also have a higher prevalence of bad self-perceived oral health. Although this could be counterintuitive, it can be interpreted that there has been a more equitable distribution of public resources because a major amount of them have been deployed to the neediest places. Working with cross-sectional data (as we did), it is impossible to assess whether public health
services would have a mitigating effect on the inequalities in oral health; such an effect could
only be assessed through longitudinal studies. However, our results are in accordance with the current principles of the Brazilian National Oral Health Policy in Brazil (PNSB), which states that the distribution of resources must be based on equity24.
Nevertheless, in analyzing the implementation of the PNSB, it is possible to notice after more than a decade that the most vulnerable social regions where these health services
have been deployed are still showing worse indicators. This means that, actually, there was no significant change in the oral health assistance model25–27.
Secondary oral health services have lost their significance in the adjusted model. According to
Soares28, despite the quantitative expansion of oral health specialized services in the last decade
in Brazil, difficulties in accessing these services persist in many regions. Moreover, Góes et al.29
found that the low coverage of oral health in primary care alongside its inadequate structure are both important factors that compromise comprehensive specialized oral health care.
Regarding the determinants of the work and life conditions, several studies have shown that educational status is an important factor in the oral health determination1,5,11,20,22,30,
which was not found in our study. This is probably because the variable “literacy” has poor discriminant power, as can be confirmed by the high number of literate people in the whole sample. On the other hand, socioeconomic stratification also showed a dose-response effect,
even after adjustment, i.e., the lower the socioeconomic status, the worse the oral health
condition. Similar findings were observed by other authors1,5,14,20. Regarding household
crowding, this variable reflects the family economic situation, as the more people living in small houses, the less the family income. Thus, economically privileged families (as measured
Individual behaviors, personal choices, and lifestyle also showed an important role in oral
health perception determination, as was also found by Gabardo et al.14 In our study, people
with healthy eating habits and those that related using dental floss presented better oral health, even after the adjustment for all other variables, which also has strong scientific
evidence14,31. Although choosing a healthy lifestyle could be considered as an individual
decision, it is also socially influenced through economic and cultural issues alongside access
to health services; therefore, it is considered a social determinant21.
We found better oral health in women compared to men, which disagrees with the results of
some authors1,14. However, our findings could be explained by the fact that women usually
have more focused attitudes on oral health care compared to men1 and hence express better
oral health perception32. In relation to age, we observe a dose-response effect, even after
adjustment, i.e., the higher the age the worse is the oral health condition. Dental caries and
periodontal diseases usually have a cumulative effect, so older people have a life trajectory of suffering because of these diseases, and thus report bad oral health more often. Similar findings were found by several authors1,14,20. In relation to skin color, worse oral health was
referred by non-white people, in accordance with Barbosa et al.33 Such an outcome was
expected, as in most studies in Brazil, race (or ethnicity, skin color) can be considered as a proxy of socioeconomic status34,35, but it is noteworthy that race maintained its significance
even in the presence of other variables such as socioeconomic stratification. This could
indicate that skin color is in itself an important marker in oral health inequalities36.
Some studies using multilevel techniques have found a strong relationship between social disparities and health inequalities25,37–39. Multilevel modeling has been adopted in several studies
as a powerful instrument to elucidate the influence of both individual and contextual factors
on health population. Nevertheless, it is also important to understand the subjectivity involved
in oral illness and how these interlaced characteristics could reflect on oral health perception, which is affected by indicators beyond those related to clinical conditions. In order to promote
better oral health to the population, it is crucial to include measures that tackle both the main individual factors and those related to quality of life and egalitarian social policies.
In this study, the aggregation unit used was the Brazilian federation unit, due to the availability of representative data in this level of aggregation. However, this unit of aggregation is not ideal because, within it, there is still a lot of context variability. Our explanatory theoretical model
is still reductionist in face of the complexity of factors that affect the social context regarding individuals and their perception. However, such limitations do not invalidate the findings here. Further studies may complement these findings and deepen the discussion here.
The bad oral health perception is determined by a combination of biological, proximal, and distal factors, as discussed in our framework. These gradients of oral health related to these
factors can be considered unfair and avoidable, which allude to social inequalities.
REFERENCES
1. Mendonça HLC, Szwarcwald CL, Damacena GN. [Self-rated oral health: results of the World Health Survey - Primary Care in four municipalities in Rio de Janeiro
State, Brazil, 2005]. Cad Saude Publica. 2012;28(10):1927-38. Portuguese.
https://doi.org/10.1590/S0102-311X2012001000011
2. Malta DC, Leal MC, Costa MFL, Morais Neto OL. Inquéritos Nacionais de Saúde: experiência
acumulada e proposta para o inquérito de saúde brasileiro. Rev Bras Epidemiol. 2008;11 Supl
1:159-67. https://doi.org/10.1590/S1415-790X2008000500017
3. Bellon ML, Ambrosano GMB, Pereira SM, Sales-Peres SHC, Meneghim MC, Pereira AC, et al.
[Sample size and costs estimate in epidemiological survey of dental caries]. Rev Bras Epidemiol.
2012;15(1):96-105. Portuguese. https://doi.org/10.1590/S1415-790X2012000100009
4. Szwarcwald CL, Malta DC, Pereira CA, Vieira MLFP, Conde WL, Souza-Júnior PRB, et al.
[National Health Survey in Brazil: design and methodology of application]. Cienc Saude
5. Mansyur C, Amick BC, Harrist RB, Franzini L. Social capital, income inequality, and self-rated health
in 45 countries. Soc Sci Med. 2008;66(1):43-56. https://doi.org/10.1016/j.socscimed.2007.08.015
6. Luchi CA, Peres KG, Bastos JL, Peres MA. Inequalities in self-rated oral health in adults. Rev
Saude Publica. 2013;47(4):740-51. https://doi.org/10.1590/S0034-8910.2013047004364
7. Nogueira RP, organizador. Determinação social da saúde e reforma sanitária. Rio de Janeiro: Cebes; 2010 [cited 2016 Apr 13]. (Coleção Pensar em Saúde). Available from: http://cebes.org. br/site/wp-content/uploads/2011/01/Determinacao.pdf
8. Freire MCM, Martins AB, Santos CR, Martins NO, Filizzola EM, Jordão LMR, et al. Oral health status, behaviours, self-perception and associated impacts among university students living in
student residences. Rev Odontol UNESP. 2012;41(3):185-91.
9. Gabardo MCL, Moysés ST, Moysés S. Autopercepção de saúde bucal conforme o Perfil de Impacto
da Saúde Bucal (OHIP) e fatores associados: revisão sistemática. Rev Panam Salud Publica. 2013
[cited 2016 Apr 13];33(6):439-45. Available from: http://www.scielosp.org/pdf/rpsp/v33n6/09.pdf
10. Fadel CB, Valentim LM, Fillus TM, Langoski JE, Bordin D. Oral health, the perspective of
the inmate and the context of vulnerability. Rev Odontol UNESP. 2015;44(6):368-73.
https://doi.org/10.1590/1807-2577.05615
11. Tassinari WS, León AP, Werneck GL, Faerstein E, Lopes CS, Chor D, et al. [Socioeconomic context
and perceived oral health in an adult population in Rio de Janeiro, Brazil: a multilevel analysis]. Cad
Saude Publica. 2007;23(1):127-36. Portuguese. https://doi.org/10.1590/S0102-311X2007000100014
12. Turrell G, Sanders AE, Slade GD, Spencer AJ, Marcenes W. The independent contribution of neighborhood disadvantage and individual-level socioeconomic position to self-reported
oral health: a multilevel analysis. Community Dent Oral Epidemiol. 2007;35(3):195-206.
https://doi.org/10.1111/j.1600-0528.2006.00311.x
13. Cremonese C, Backes V, Olinto MTA, Dias-da-Costa JS, Pattussi MP. Neighborhood sociodemographic
and environmental contexts and self-rated health among Brazilian adults: a multilevel study. Cad Saude
Publica. 2010;26(12):2368-78. https://doi.org/10.1590/S0102-311X2010001200015
14. Gabardo MCL, Moysés SJ, Moysés ST, Olandosky M, Olinto MTA, Pattussi MP. Multilevel analysis of self-perception in oral health and associated factors in Southern Brazilian adults: a cross-sectional
study. Cad Saude Publica. 2015;31(1):49-59. https://doi.org/10.1590/0102-311X00037814
15. Comissão Nacional sobre Determinantes Sociais da Saúde. As causas sociais das iniquidades em saúde no Brasil. Rio de Janeiro: Fiocruz; 2008 [cited 2016 Apr 13]. Available from: http://bvsms. saude.gov.br/bvs/publicacoes/causas_sociais_iniquidades.pdf
16. Damacena GN, Szwarcwald CL, Souza-Júnior PRB, Vieira MLFP, Pereira CA, Morais Neto OL,
et al. The development of the National Health Survey in Brazil, 2013. Epidemiol Serv Saude.
2015;24(2):197-206. https://doi.org/10.1590/S0102-311X2007000100014
17. Puente-Palacios KE, Laros JA. [Multilevel analysis: contributions to studies investigating the
effects of social context on individual behavior]. Estud Psicol (Campinas). 2009;26(3):349-61.
Portuguese. https://doi.org/10.1590/S0103-166X2009000300008
18. Associação Brasileira de Empresas de Pesquisa. Critério de Classificação Econômica Brasil 2015. São Paulo: ABEP; 2014 [cited 2016 Apr 13]. Available from: http://www.abep.org/criterio-brasil
19. Hair JF Jr, Black WC, Babin BJ, Anderson RE, Tatham RL. Análise multivariada de dados. 6.ed. Porto Alegre: Bookman; 2009.
20. Cohen-Carneiro F, Souza-Santos R, Rebelo MAB. Quality of life related to oral health:
contribution from social factors. Cienc Saude Coletiva. 2011;16 Supl 1:1007-15.
https://doi.org/10.1590/S1413-81232011000700033
21. Guerra MJ, Greco RM, Leite IC, Ferreira EF, MVQ. Impact of oral health conditions
on the quality of life of workers. Cienc Saude Coletiva. 2014;19(12):4777-86.
https://doi.org/10.1590/S1413-81232011000700033
22. Barros RP, Foguel MN, Ulyssea G, organizadores. Desigualdade de renda no Brasil: uma análise da queda recente. Vol 2. Brasília (DF): Ipea; 2007.
23. Wilkinson RG, Pickett KE: Income inequality and population health: a review and explanation of
the evidence. Soc Sci Med. 2006;62(7):1768-84. https://doi.org/10.1016/j.socscimed.2005.08.036
25. Roncalli AG, Tsakos G, Sheiham A, Souza GC, Watt RG. Social determinants of dental treatment needs
in Brazilian adults. BMC Public Health. 2014;14:1097. https://doi.org/10.1186/1471-2458-14-1097
26. Aquilante AG, Aciole GG. Building a “Smiling Brazil”? Implementation of the Brazilian
National Oral Health Policy in a health region in the State of São Paulo. Cad Saude Publica.
2015;31(1):82-96. https://doi.org/10.1590/0102-311X00193313
27. Moysés SJ. Oral health programming and its relationship to epidemiology: challenges and
opportunities. Cad Saude Publica. 2014;30(6):1136-8. https://doi.org/10.1590/0102-311XPE010614
28. Soares CLM. Constructing public oral health policies in Brazil: issues for reflection. Braz Oral
Res. 2012;26 Spec No 1:94-102. https://doi.org/10.1590/S1806-83242012000700014
29. Goes PSA, Figueiredo N, Neves JC, Silveira FMM, Costa JFR, Pucca Júnior A, et al. [Evaluation of
secondary care in oral health: a study of specialty clinics in Brazil]. Cad Saude Publica. 2012;28
Supl: s81-9. Portuguese. https://doi.org/10.1590/S0102-311X2012001300009
30. Peres MA, Iser BPM, Boing AF, Yokota RTC, Malta DC, Peres KG. [Inequalities in access to and utilization of dental care in Brazil: an analysis of the Telephone Survey Surveillance System for
Risk and Protective Factors for Chronic Diseases (VIGITEL 2009)]. Cad Saude Publica. 2012;28
Supl: s90-100. Portuguese. https://doi.org/10.1590/S0102-311X2012001300010
31. Rodrigues LC. [Perception of health of adolescent that received dental care in the first decade of life] [dissertation]. Araçatuba: Universidade Estadual Paulista, Faculdade de Odontologia de Araçatuba; 2016. Portuguese
32. Hernández-Palacios RD, Ramírez-Amador V, Jarillo-Soto EC, Irigoyen-Camacho ME, Mendoza-Núñez VM. Relationship between gender, income and education and
self-perceived oral health among elderly Mexicans: an exploratory study. Cienc Saude Coletiva.
2015;20(4):997-1004. https://doi.org/10.1590/1413-81232015204.00702014
33. Barbosa TB, Junqueira SR, Frias AC, Araujo ME. [Perception of Brazilian adolescents about the
influence of oral health on biological and social functions]. Pesq Bras Odontoped Clin Integr.
2013;13(2):171-6. Portuguese. https://doi.org/10.4034/pboci.v13i2.1531
34. Marin-Leon L, Francisco PMSB, Segall-Corrêa AM, Panigassi G. Household appliances and
food insecurity: gender, referred skin color and socioeconomic differences. Rev Bras Epidemiol.
2011;14(3):398-410. https://doi.org/10.1590/S1415-790X2011000300005
35. Kabad JF, Bastos JL, Santos RV. [Race, color and ethnicity in epidemiologic studies carried
out with Brazilian populations: systematic review on the PubMed database]. Physis.
2012;22(3):895-918. Portuguese. https://doi.org/10.1590/S0103-73312012000300004
36. Bastos JL, Antunes JLF, Frias AC, Souza MLR, Peres KG,Peres MA. Color/race inequalities
in oral health among Brazilian adolescents. Rev Bras Epidemiol. 2009;12(3):313-24.
https://doi.org/10.1590/S1415-790X2009000300003
37. Chauvel L, Leist AK. Socioeconomic hierarchy and health gradient in Europe: the
role of income inequality and of social origins. Int J Equity in Health. 2015;14:132.
https://doi.org/10.1186/s12939-015-0263-y
38. Adedini SA, Odimegwu C, Imasiku EN, Ononokpono DN, Ibisomi L. Regional variations in
infant and child mortality in Nigeria: a multilevel analysis. J Biosoc Sci. 2015;47(2):165-87.
https://doi.org/10.1017/S0021932013000734
39. Rathmann K, Ottova V, Hurrelmann K, Looze M, Levin K, Molcho M, et al. Macro-level
determinants of young people’s subjective health and health inequalities: a multilevel analysis in
27 welfare states. Maturitas. 2015;80(4):414-20. https://doi.org/10.1016/j.maturitas.2015.01.008
Author’s Contribution: JVS and AGRCO participated in all research: conception, analysis, and interpretation
of results and critical review of the content. All authors participated in the writing, approved the final version
of the manuscript, and declare to be responsible for all aspects of the study.