Article
Printed in Brazil - ©2018 Sociedade Brasileira de Química*e-mail: izabelkaline@gmail.com
Determination of Chlorine in Crude Oil Emulsified via the MgCl Molecule by
HR-CS MAS
Izabel K. S. Oliveira,*,a Rina L. S. Medeiros,b Djalma R. Silvaa,b and Tatiane A. Maranhãoc
aPrograma de Pós Graduação em Ciência e Engenharia do Petróleo and
bNúcleo de Processamento Primário e Reuso de Águas e Resíduos (NUPPRAR),
Instituto de Química, Centro de Ciências Exatas e da Terra, Universidade Federal do Rio Grande do Norte, 59078-970 Natal-RN, Brazil
cDepartamento de Química, Universidade Federal de Santa Catarina,
88040-900 Florianópolis-SC, Brazil
A method for chlorine determination in crude oil samples, through the formation of MgCl molecule, by high-resolution continuum source graphite furnace molecular absorption spectrometry (HR-CS GF MAS) was developed and is described in this paper. The use of this molecule for chlorine determination in crude oil has not been reported up to now. Measures were carried out at the wavelength 377.010 nm and the samples were submitted to a simple treatment as emulsion, whose composition was optimized applying a simplex-centroid experimental design. Magnesium was used as molecule forming agent at the concentration of 10 g L-1, at least 500 times higher
than the concentration of chlorine. This excess is required to ensure the molecule formation of all content of Cl present in the sample. Chemical modifier Pd was used and improved greatly the signal intensities. Optimized pyrolysis and vaporization temperatures, applied for determination, were 800 and 2300 °C, respectively. Accuracy was evaluated through analysis of certified reference materials, NIST 1848 and NIST 1634c, and addition and recovery tests with recoveries between 92 and 117%. Limits of detection and quantification were 3.0 and 9.0 µg g-1, respectively. The
method was applied to eight crude oil samples.
Keywords: chlorine, magnesium monochloride, crude oil, emulsion, HR-CS GF MAS
Introduction
Crude oil is a natural complex mixture of gaseous and liquid compounds found in reservoirs beneath the surface of the earth associated with sedimentary rocks, composed mostly of aliphatic and aromatic hydrocarbons and containing organic compounds of nitrogen, oxygen and sulfur. Metals and non-metals are also part of the crude oil composition. Chlorine is present in crude oil as inorganic metallic salts, whose content is related to the reservoirs, formation waters and other waters used in extraction processes. Organic bonded chlorides from vegetal and animal sources or formed during crude oil processing steps can also be present. Although found in trace amounts chlorine is very deleterious since during the processing of crude oil it generates hydrochloric acid which is strongly
corrosive and can cause serious damage to the components
of the equipments.1-4
Chlorine determination in crude oil is not an easy task due to the complexity of the sample and the possibility of analyte lost during the treatment procedures prior the analysis. The determination of chlorine has been performed following official methods of the American Society for
Testing and Materials, ASTM D3230,5 ASTM D64706
and ASTM D4929,7 and the US Environmental Protection
Agency, method EPA 9075.8 The methods ASTM D3230
and ASTM D6470 are in fact indirect quantification of chlorine through the measurement of salt content. The procedure of ASTM D4929 describes the quantification of organic chlorides while EPA 9075 defines the total concentration of chlorine in petroleum products but has
been applied to crude oil.3
but conventionally the introduction of the samples is carried out through pneumatic nebulization which requires sample treatment procedures that usually causes the loss of the analyte. Alternatively, introduction systems such as laser ablation (LA) or electrothermal vaporization has been employed for direct determination of chlorine determination by ICP-MS but these accessories are not
easily available.9,10
Absorption spectrometry, usually applied to metallic and semimetallic elements, has been recently proposed for determination of halogens through the measurement of the absorption of diatomic molecules. The need for this alternative is due to the fact that atomic halogens resonance lines are located beneath the wavelength work range of conventional spectrometers, below 190 nm, in the vacuum ultraviolet region. The first studies on molecular absorption in air-acetylene flame were conducted in the mid-1970
by Haraguchi and Fuwa11 who investigated the spectra
of indium halides diatomic molecules in the UV region.
In 1980 decade Dittrich et al.12-15 published a series of
papers describing the molecular spectra of several metallic halides in a graphite furnace. Nevertheless application for determination in real samples gained impulse only after the introduction of the high resolution continuum source atomic absorption spectrometry (HR-CS AAS), which combines high intensity radiation source and high-resolution spectrometer making easier the selection of the
low sensitive molecular wavelength.16,17
Chlorine determination by high-resolution continuum source molecular absorption spectrometry (HR-CS MAS) has been accomplished by detection of several diatomic
molecules.16,18 The most widely reported in the literature is
AlCl19-25 due to its high energy bond and well separated band
heads, making it effective the background correction.17,26
Strontium monochloride (SrCl) was applied for chlorine determination in different types of samples (coal, milk, animal organs and tissues, and wheat flour). This molecule is monitored at 635.862 nm and displays detection limits
that are similar to certified values.21,27-29 A method for
chlorine determination through CaCl molecule at the
wavelength of 621.146 nm was developed by Guarda etal.30
and applied it to different types of certified reference materials (coal, iron oxide, polyethylene, human hair, pine needles, rice flour and milk). The same molecule was used
by Bechlin etal.31 for chlorine quantification in cement
samples at wavelength 621.145 nm, employing direct solid sampling analysis. Low detection limits were achieved since CaCl molecule exhibits high sensitivity.
Chlorine determination in crude oil by HR-CS MAS through several molecules, AlCl, InCl and SrCl, and direct introduction of the sample, was accomplished by
Enders etal.21 The obtained results were compared with
those obtained by microwave-induced combustion (MIC),
microwave-assisted extraction (MAE), ASTM D6470-996
and neutron activation analysis (NAA) and no significant
difference was found.21
The use of MgCl molecule for analytical purposes
was investigated by Dittrich and Vorberg15 and published
in 1982, but no application for Cl determination in real samples was reported since then, even after introduction of the HR-CS AAS instrumentation in the early 2000s. The molecule wavelength, based on literature data, is 377.010 nm, which corresponds to the transition bands of
the A2π - X2Σ+ system, visible region, whose molecular
spectrum presents broad bands, with two of them exhibiting
higher intensities.14,32 Recently a method for chlorine
determination using MgCl molecule was developed by our group and applied to produced water from offshore
oil wellbore.33 The aim of this paper is to describe a
method development for chlorine determination, using MgCl molecule, in crude oil samples by high-resolution continuum source graphite furnace molecular absorption spectrometry (HR-CS GF MAS). A simple and fast sample treatment, emulsion, is proposed for such high complex matrix.
Experimental
Instrumentation
A high-resolution continuum source atomic absorption spectrometer model ContrAA 700 (AnalytikJena, Jena, Germany) was used for all measurements. Solutions and samples were directly introduced into transverse-heated graphite tubes with integrated platform (AnalytikJena) by an auto sampler model MPE 60 (AnalytikJena). Argon purity 99.999% (White Martins, São Paulo, Brazil) was used as protective and purge gas. To extend the life time of the graphite tube a coating procedure, adopted from
literature,34 was carried out. Graphite platforms were coated
with 1000 µg of tungsten (W) through 20 consecutive
injections of 50 µL of a 1000 mg L-1 solution of W and
submission to the temperature program shown in Table 1.
Reagents, solutions and samples
All solutions were prepared with ultrapure water,
to a resistivity of 18.2 MΩ cm, obtained in a purifying
system model Elga Purelab Ultra (Elga Labwater, United
Kingdom). Nitric acid 65% (m v-1) (Labsynth, São Paulo,
n-propanol (Labsynth, São Paulo, Brazil) and Triton X-100 (Fisher Scientific, USA) were used for sample preparation.
A stock solution containing 1000 mg L-1 of Cl was prepared
from MgCl2.6H2O salt (Labsynth, São Paulo) and used
to prepare the calibration curve solutions. Forming agent Mg solution was obtained from dissolution of metallic magnesium (SPEX Industries, USA) in nitric acid and
diluted with pure water to a concentration of 10 g L-1 and
the modifier Pd 1.0 g L-1 from dissolution of a 10 g L-1
Pd(NO3)2 solution (Merck, Germany). Two certified
reference material, fuel oil NIST 1634c and lubricating oil additive NIST 1848, were submitted to the method to evaluate the accuracy. Eight crude oil samples from the Potiguar Basin, Rio Grande do Norte State, Brazil, were used as an application of the method.
Sample preparation
The sample preparation method applied was emulsion, whose composition was optimized through a simplex-centroid design experiment. Crude oil samples were homogenized by stirring with a magnetic stirrer, at the temperature of 80 °C for 30 min. Approximately 0.20 ± 0.01 g of the sample was directly weighed into 15 mL Falcon tubes, 0.5 mL of
5% HNO3 v v-1 were added and, after vigorous agitation,
submitted to ultrasonic radiation for 5 min. Then, 0.5 mL of
xylene and 2 mL of a mixture of n-propanol/Triton X-100
(5:1) were added. The mixture was again submitted to ultrasonic radiation for 45 min.
Procedure for chlorine determination in crude oil emulsions
Determination of chlorine was carried out by introduction of 10 µL of chlorine calibration solutions, 10 µL of the forming agent Mg and 5 µL of the Pd modifier solution, for calibration curve preparation, and then submitted to the temperature program presented in Table 2. The same procedure was applied to the sample emulsions for quantification.
Results and Discussion
MgCl molecule
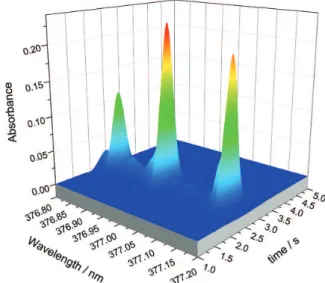
Chlorine does not present main resonance lines at the work range of conventional spectrometers, even for the most modern instruments as HR-CS AAS. Thereby an adaptation is required in order to quantify this element using absorption spectrometry technique, the indirect determination through a diatomic molecule. The choice of the molecule, and the wavelength were based in data from
literature.32 The selected wavelength was 377.010 nm at
the visible region corresponding to transition bands of the
A2π - X2Σ+ system, which implies the absorption of the
molecule at the ground state. The characteristic spectrum is composed by strong bands, presenting two headbands
(more intense).32 The 3D spectrum obtained for MgCl
molecule by HR-CS MAS is shown in Figure 1.
Optimization of crude oil emulsion composition
Crude oil samples are highly complex usually requiring laborious procedures before the introduction into the
Table 1. Furnace temperature program for the coating of the graphite platform with W for chlorine determination by HR-CS MAS
Step Temperature / °C Ramp / (°C s-1) Hold / s
Drying 90 5 40
Drying 110 1 40
Drying 130 1 40
Pyrolysis 1200 300 26
Vaporization 2100 500 8
Cleaning 2150 0 5
Table2. Temperature program for chlorine determination via MgCl molecule in crude oil samples by HR-CS MAS
Step Temperature / °C Ramp / (°C s-1) Hold / s
Drying 90 6 35
Drying 120 3 30
Pyrolysis 800 300 10
Vaporization 2300 1500 8
Cleaning 2650 500 4
instrument for analysis. Conventional sample treatment, using strongly acid media and rigorous digestion process usually are not adequate for chlorine since it leads to losses during the procedure. The direct introduction of the samples into the atomizer is a very attractive alternative for complexes samples, made possible by absorption spectrometry. Nevertheless the direct introduction of the sample into the atomizer requires a specific accessory for solid samples and the weighing of each aliquot at each measurement, which is not a simple task for crude oil due to its viscosity. As a consequence there is a substantial increase in the analytical frequency of the method and low repeatability of the measurements is achieved. Additionally, the temperature program steps that precede the vaporization stage, drying and pyrolysis must be carefully optimized to promote the complete burning of the organic matter to avoid the release of smoke during the volatilization of the molecule and consequently interferences. Usually these steps take longer time contributing to an increase in the analytical frequency.
Emulsions are systems composed of two immiscible liquids, usually stabilized by one surfactant, very easy to prepare and with a minimum of manipulation. A short time is required in the emulsion preparation and the use of an autosampler for liquid can be used to introduce the sample into the atomizer, which reduces greatly the time of analysis
and ensures the repeatability of the measurements.35
The composition of the crude oil sample emulsion was optimized through an experimental simplex-centroid design for mixtures of three components. For a design with
Z components the number of different points is 2Z – 1.
For a design where Z = 3 there will be 7 experiments with 3 mixtures of pure components, 3 binary mixtures and
1 ternary mixture.36 The volumes of 3 reagents (xylene, nitric
acid 5% v v-1 and a n-propanol/Triton X-100 5:1 mixture)
used in the composition of emulsion were evaluated in a
total of 7 experiments, with 3 replicates of the central point. Table 3 shows the volumes of the reagents, MgCl molecule absorbance intensities, standard deviation (SD) and relative standard deviation (RSD) in each experiment.
Highest intensity was obtained for experiment 7, followed by experiments 4 and 9. Experiments 2 and 8 presented good intensities while for the others the absorbance values were not significant. The contour plot obtained for the experimental design is shown in Figure 2.
Five experiments are within the optimal region of the response surface. For the choice of the composition of the emulsion another factor was taken into consideration, the stability of the emulsion. Experiment 8, 500 µL of xylene,
500 µL of nitric acid 5% v v-1 and 2 mL n-propanol and
Triton X-100 5:1, was the emulsion with better stability, remaining as a single phase for several hours, making it
Figure2. Contour surfaces resulting from the ternary model of the simplex-centroid design: xylene, n-propanol/Triton X-100 (5:1) and 5% HNO3.
Table3.Simplex-centroid design for optimization of crude oil emulsion composition for chlorine determination via MgCl molecule by HR-CS MAS
Experiment n-Propanol/Triton X-100 5:1 / mL HNO3, 5% / mL Xylene / mL Abs. SD RSD / %
1 3.0 0.0 0.0 0.048 0.0007 1
2 0.0 3.0 0.0 0.183 0.0494 27
3 0.0 0.0 3.0 0.001 0.0005 50
4 1.5 1.5 0.0 0.245 0.0120 5
5 1.5 0.0 1.5 0.030 0.0013 4
6 0.0 1.5 1.5 0.002 0.0009 38
7 1.0 1.0 1.0 0.370 0.0096 3
8 2.0 0.5 0.5 0.183 0.0001 0.05
9 0.5 2.0 0.5 0.266 0.0080 3
10 0.5 0.5 2.0 0.024 0.0001 0.05
possible the determination in a numerous samples. So, this composition was adopted for chlorine determination in the real samples of crude oil.
Optimization of the temperature program
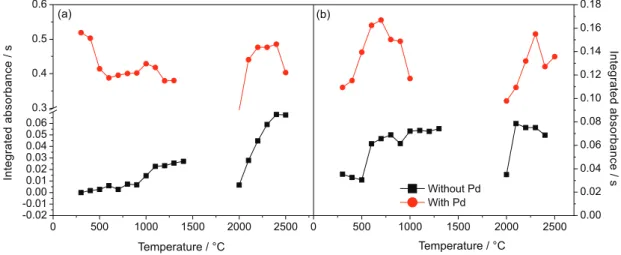
In order to establish the furnace temperature program that would better promote de elimination of the sample matrix and the formation of the MgCl molecule, pyrolysis
and vaporization curves were optimized for a MgCl2
aqueous solution, containing 10 mg L-1 of Cl, and for a
crude oil emulsion, in the absence of modifier and using 5.0 µg Pd as chemical modifier. Magnesium nitrate solution was added as molecule forming agent. Figure 3 shows the obtained pyrolysis and vaporization curves.
Magnesium forming agent concentration
The effect of the concentration of the forming agent Mg on the formation of MgCl molecule was investigated for a
10 mg L-1 Cl solution and one crude oil sample emulsion.
Solutions containing magnesium in nitric acid medium
were used in a concentration range from 0 up to 30 g L-1.
For aqueous solutions there is an enhancement of the signal intensities with the increase of Mg concentration
up to 10 g L-1 and after that a slight decrease is observed.
Probably the excess of Mg promotes a faster release of MgCl molecule to the vapor phase, causing a small decrease in the intensities. A similar increase is observed
for crude oil emulsion up to a concentration of 10 g L-1,
but after that a slight increase is observed. This could be consequence of formation of other molecules, with other components of the sample and the excess of Mg, causing interferences. However, MgCl molecule is preferentially formed in the vapor phase due to its lower dissociation
energy, when compared to other molecule species of Cl.14
As compromise condition the concentration of 10 g L-1 of
the forming agent Mg was adopted for aqueous solution and sample emulsion. At this condition the ratio between the forming agent and chlorine is at least 500:1 (in mass). This is the minimum excess required in order to ensure the formation of the molecule for all content of Cl in both aqueous standard solution and sample emulsion.
Matrix interference
To evaluate whether an effect of the matrix would affect the slope of the calibration prepared under the same conditions of the sample emulsions, three calibration solutions were prepared and their slopes compared: aqueous solutions, matrix matching solutions containing the same composition of the emulsion and analyte addition by adding the different concentrations of chlorine to the sample emulsions. Figure 4 presents the obtained calibration curves.
Figure 3. Pyrolysis and vaporization curves for the MgCl molecule in a 10 mg L-1 chlorine aqueous solution (a) and a crude oil sample emulsion (b), with
and without chemical modifier Pd by HR-CS MAS.
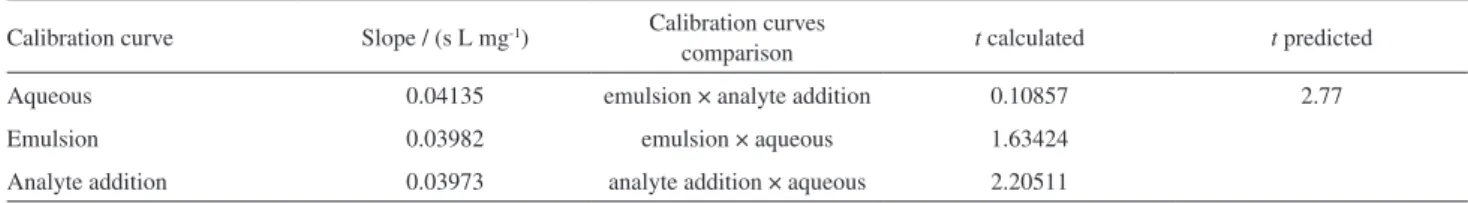
For the three calibration curves no significant difference
between the slopes were observed. Student’s t-test was
applied to evaluate whether the values are statistically the same. The obtained results are expressed in Table 4.
For a 95% confidence level (n = 5) the calculated
t values were lower than the predicted value, 2.77, showing
that the slopes of the three calibration curves are statistically equals and could be used for chlorine quantification. Calibration with aqueous solutions was adopted for determination in real samples since it is simpler, the time spent in preparation is shorter and it requires fewer reagents, contributing to faster analysis. Figures of merit for the three calibration curves are shown in Table 5. Analysis of
variance (ANOVA) was evaluated through F-test, wherein
Fcalculated (0.42) was lower than Ftabulated (161.44),
which does not present significant difference between the variances of the data found (at 95% confidence level). Analyte addition calibration was adopted as reference in the calculation.
In order to evaluate the accuracy of the developed method, chlorine determination was carried out in two certified reference materials, lubricating oil additive NIST 1848 and fuel oil NIST 1634c, prepared as emulsion. The results are shown in Table 6 and the obtained values
presented good agreement with the certified values, between 104 and 106% of concordance, ensuring the reliability of the proposed method.
Limits of detection (LOD) and quantification (LOQ) were calculated as 3 and 10 times, respectively, the standard deviation of the analyte intensities, obtained for the blank solution (n = 10), divided by the slope of
the calibration curve.37 The obtained values were 5.0 and
14 µg g-1, for LOD and LOQ, respectively. Pereira et al.27,28
carried out the determination of chlorine using SrCl
molecule and obtained LOD values of 2.0 µg g-1, in a
method for biological samples, and 5.6 µg g-1 in a method
for coal. The determination of chlorine via CaCl molecule in food samples, employing two sample treatments,
was also accomplished by Fechetia et al.,20 obtaining
LOD values of 9.0 and 18 µg g-1. Under the optimized
conditions, the characteristic mass of the method was 0.10 ng.
Good precision, evaluated by the repeatability of a set of measurements and expressed as relative standard deviation, was achieved, between 2.0 and 8.0%.
The developed method was applied to eight crude oil samples from the Potiguar Basin in Rio Grande do Norte State, Brazil. Addition and recovery tests were
also performed by adding 10 mg L-1 of Cl to the sample
emulsions and good recoveries were achieved, between 92 and 117%, considering a range of 80 to 120% as
acceptable.38 The obtained concentrations, RSD values
and the recoveries of the addition and recovery tests are shown in Table 7. For five samples the concentrations were below the LOQ and for the others the values ranged
from 25 ± 1 mg kg-1 through 50 ± 3 mg kg-1. Precision
obtained for the samples containing chlorine were better than 5%. This can be related to the sample preparation as emulsion, which improves the repeatability of the measurements.
Table4. Results of Student’s t-test applied to the calibration curves
Calibration curve Slope / (s L mg-1) Calibration curves
comparison t calculated t predicted
Aqueous 0.04135 emulsion × analyte addition 0.10857 2.77
Emulsion 0.03982 emulsion × aqueous 1.63424
Analyte addition 0.03973 analyte addition × aqueous 2.20511
Table5. Figures of merit obtained for three calibration curves for chlorine determination via MgCl by HR-CS MAS
Aqueous
solution Emulsion
Analyte addition Work range / (mg L-1) 5-20 5-20 5-20
R 0.998 0.997 0.999
LOD / (µg g-1) 5 5 5
LOQ / (µg g-1) 14 14 14
R: correlation coefficient; LOD: limit of detection; LOQ: limit of quantification
Table6. Chlorine concentrations in certified reference materials obtained via MgCl molecule by HR-CS MAS
Sample Certified value Obtained value RSD / %
NIST 1634c / (mg kg-1) 45a 47 ± 1 2.0
NIST 1848 / % 0.0927 ± 0.0020 0.0979 ± 0.0083 8.0
Conclusions
Determination of chlorine using MgCl molecule in crude oil samples by HR-CS MAS is proposed in this
paper. Magnesium nitrate solution, 10 g L-1, was used as
forming agent and 5 µg of chemical modifier palladium was added to ensure the stability of the molecule during the temperature program of the graphite furnace. A fast and simple calibration strategy, using aqueous solutions was possible. Limits of detection and quantification were
3 and 9 µg g-1, respectively. Accuracy was evaluated
through certified reference material and recovery tests. Good agreement with the certified values, 104 and 106%, and recoveries, between 92 and 117%, were achieved. The method was applied to eight crude oil samples.
Acknowledgments
The authors are thankful to Agência Nacional do Petróleo, Gás Natural e Biocombustíveis (ANP) for financial support.
References
1. Matar, S.; Hatch, L.; ChemistryofPetrochemicalProcesses, 2nd ed.; Gulf Publishing Company: Houston, Texas, 2000.
2. Speight, J. G.; HandbookofPetroleumProductAnalysis; Wiley Interscience: Hoboken, 2002.
3. Doyle, A.; Saavedra, A.; Tristão, M. L. B.; Nele, M.; Aucélio, R. Q.; Spectrochim.Acta,PartB2011, 66, 368.
4. Doyle, A.; Saavedra, A.; Tristão, M. L. B.; Mendes, L. A .N.; Aucélio, R. Q.; Spectrochim.Acta,PartB2013, 86, 102. 5. ASTM Standard D3230-99: Standard Test Methods for Salt in
Crude Oils (Electrometric Method), ASTM International, West
Conshohocken, PA, 2010.
6. ASTM D6470-99: Standard Test Method for Salt in Crude
Oils (Potentiometric Method), ASTM International, West
Conshohocken, PA, 2010.
7. ASTM D4929-04: Standard Test Method for Salt in Crude
Oils (Potentiometric Method), ASTM International: West
Conshohocken, PA, 2010.
8. EPA Standard Method 9075: Test Method for Total Chlorine in New and Used Petroleum Products by X-Ray Fluorescence
Spectromety (XRF), U.S. Environmental Protection Agency,
Washington DC, 1994.
9. Antes, F. G.; Dullius, E.; Costa, A. B.; Molz, R. F.; Paniz, J. N. G.; Flores, E. M. M.; Dressler, V. L.; Microchem.J. 2013, 109, 117. 10. Hammerli, J.; Rusk, B.; Spandler, C.; Emsbo, P.; Oliver, N. H.
S.; Chem.Geol. 2013, 337-338, 75.
11. Haraguchi, H.; Fuwa, K.; Spectrochim.Acta,PartB1975, 30, 535.
12. Dittrich, K.; Schneider, S.; Anal.Chim.Acta1980, 115, 189. 13. Dittrich, K.; Schneider, S.; Anal.Chim.Acta1980, 115, 201. 14. Dittrich, K.; Vorberg, B.; Anal.Chim.Acta1982, 140, 237. 15. Dittrich, K.; Vorberg, B.; Anal.Chim.Acta1983, 152, 149. 16. Welz, B.; Lepri, F. G.; Araujo, R. G. O.; Ferreira, S. L. C.;
Huang, M. D.; Okrussc, M.; Becker-Ross, H.; Anal.Chim.Acta
2009, 647, 137.
17. Butcher, D. J.; Anal.Chim.Acta2013, 804, 1.
18. Welz, B.; Becker-Ross, H.; Florek, S.; Heitmann, U.;
High-Resolution Continuum Source AAS - TheBetter Way to
DoAtomic AbsorptionSpectrometry, 1st ed.; Wiley-VCH:
Weinheim, Germany, 2005.
19. Heitmann, U.; Becker-Ross, H.; Florek, S.; Huang, M. D.; Okruss, M.; J.Anal.At.Spectrom.2006, 21, 1314.
20. Fechetia, M.; Tognon, A. L.; Veiga, M. A. M. S.; Spectrochim. Acta,PartB2012, 71, 98.
21. Enders, M. S. P.; Gomes, A. O.; Oliveira, R. F.; Guimarães, R. C. L.; Mesko, M. F.; Flores, E. M. M.; Müller, E. I.; Energy
Fuels2016, 30, 3637.
22. Parvinen, P.; Lajunen, L. H. J.; Talanta1999, 50, 67. 23. Nakadi, F. V.; Veiga, M. A. M. S.; Aramendía, M.; García-Ruiza,
E.; Resano, M.; J.Anal.At.Spectrom.2015, 30, 1531. 24. Dittrich, K.; Spivakov, B. Ya.; Shkinev, V. M.; Vorob’eva, G.
A.; Talanta1984, 31, 341.
25. Butcher, D. J.; Microchem.J.1993, 48, 303.
26. Huang, M. D.; Becker-Ross, H.; Florek, S.; Heitmann, U.; Okruss, M.; Spectrochim.Acta, PartB2006, 61, 959. 27. Pereira, E. R.; Welz, B.; Lopez, A. H. D.; Andrade, J. B.;
Spectrochim.Acta,PartB2014, 102, 1.
28. Pereira, E. R.; Rocha, L. M.; Cadorim, H. R.; Silva, V. D.; Welz, B.; Carasek, E.; Andrade, J. B.; Spectrochim.Acta,PartB2015,
114, 46.
29. Ozbek, N.; Akman, S.; J.Agric.FoodChem.2016, 64, 5767. 30. Guarda, A.; Aramendía, M.; Andrés, I.; García-Ruiz, E.;
Nascimento, P. C.; Resano, M.; Talanta2017, 162, 354.
Table7. Chlorine concentration, via MgCl molecule, in crude oil samples at a 95% confidence level (n = 3) by HR-CS MAS
Sample Cl concentration /
(mg kg -1) RSD / % REC / %
Crude oil 1 < 14 – 117
Crude oil 2 < 14 – 98
Crude oil 3 26.8 ± 0.7 3 95
Crude oil 4 50 ± 3 5 92
Crude oil 5 < 14 – 93
Crude oil 6 25 ± 1 5 103
Crude oil 7 < 14 – 90
Crude oil 8 < 14 – 107
31. Bechlin, M. A.; Ferreira, E. C.; Gomes Neto, J. A.; Microchem. J.2017, 132, 130.
32. Pearse, R. W. B.; Gaydon, A. G.; TheIdentificationofMolecular
Spectra, 4th ed.; Chapman and Hall: London, UK, 1976, p. 217.
33. Medeiros, R. L. S.; Souza, S. O.; Araujo, R. G. O.; Silva, D. R.; Maranhão, T. A.; Talanta2018, 176, 227.
34. Resano, M.; Briceño, J.; Aramendía, M.; Belarra, M. A.; Anal.
Chim. Acta2007, 582, 214.
35. de Paula, C. E. R.; Cruz, G. F. B.; Rezende, C. M. S. P.; Cassella, R. J.; Microchem.J.2016, 127, 1.
36. Bruns, R.; Scarminio, I.; Barros Neto, B.; StatisticalDesign -
Chemometrics, 1st ed.; Elsevier: Amsterdam, Holland, 2006.
37. International Union Of Pure And Applied Chemistry;
Spectrochim.Acta, PartB1978, 33, 247.
38. Eaton, A. D.; Clesceri, L. S.; Rice, E. W.; Greenberg, A.
E.; StandardMethods fortheExamination of Water and
Wastewater, 21st ed.; American Public Health Association:
Washington, USA, 2005, p. 15.
Submitted:August1,2017
Published online: September 22, 2017