M
ASTER
F
INANCE
M
ASTER
´
S
F
INAL
W
ORK
P
ROJECT
E
QUITY
R
ESEARCH
:
F
ERRARI
N.V.
D
IOGO
M
ARTINS DE
F
REITAS
M
ASTER
F
INANCE
M
ASTER
´
S
F
INAL
W
ORK
P
ROJECT
E
QUITY
R
ESEARCH
:
F
ERRARI
N.V.
D
IOGO
M
ARTINS DE
F
REITAS
S
UPERVISION:
P
H.D.
P
ROFESSORC
LARAR
APOSOGLOSSARY
BoD - Board of Directors
CAGR - Compound Annual Growth Rate CAPEX - Capital Expenditures
CAPM - Capital Asset Pricing Model DCF - Discounted Cash Flow
EBIT - Earnings Before Interest and Taxes
EBITDA - Earnings before Interest, Taxes, Depreciation and Amortization ECB - European Central Bank
EV - Enterprise Value
FCA- Fiat Chrysler Automobiles FCFF - Free Cash Flow to the Firm GDP - Gross Domestic Product
NAFTA - North Atlantic Free Trade Agreement NOPLAT - Net Operating Profit Less Adjusted Taxes NV - Dutch Public Company
NWC - Net Working Capital MRP - Market Risk Premium LATAM - Latin America
OPEX - Operational Expenditures ROIC - Return on Invested Capital S.p.A - Italian Public Company SUV - Sport Utility Vehicle TOC - Total Cost of Ownership
WACC - Weighted Average Cost of Capital YoY- Year over Year
ABSTRACT,KEYWORDS AND JELCODES
O presente relatório de Equity Research tem por objectivo determinar o justo valor da fabricante italiana de supercarros de luxo, Ferrari. Nesse sentido, um preço-alvo para o final do ano de 2018 foi desenvolvido e posteriormente concretizado numa recomendação de investimento, tendo por base o processo de avaliação e o preço atual da acção.
A primeira etapa do processo de avaliação compreende uma breve análise macroeconómica da indústria em que a empresa se insere, seguida de uma análise operacional. Posteriormente segue-se um tratamento de dados financeiros fundamentais para o desenvolvimento do modelo de Discount Cash Flow (DCF) e para o modelo de avaliação relativa com em base em Múltiplos.
O modelo de Discount Cash Flow (DCF) deriva um preço por acção no final de 2018 de € 121.21. Em contraste, a abordagem via múltiplos é ligeiramente mais conservadora, com um valor-alvo por acção de € 115.36. Em 30 de Junho de 2018, o preço da acção em mercado foi fixado em € 116.50, o que deixa espaço para um potencial de valorização de cerca de 4%, considerando o valor obtido através do modelo DCF. O rendimento futuro dos dividendos é esperado ser de 0.70%.
Desde o início do ano, o retorno anualizado da acção foi de 36%, juntamente com uma volatilidade anual de 31%, valores estes que podem ser explicados pela ainda recente IPO e a consequente descoberta de preço pelo mercado
No dia 25 de julho de 2018, Sergio Marchionne, Presidente e CEO da Ferrari e também CEO do Grupo FCA, faleceu inesperadamente. No entanto e apesar deste triste acontecimento, o analista acredita firmemente que o recém-nomeado CEO, Louis Camilleri, ex-CEO da Philip Morris Intl., irá manter as metas e planos estratégicos de Marchionne para a empresa, pelo menos a curto / médio prazo. Certamente será o mais razoável de assumir visto que o recém-nomeado CEO vem de uma indústria completamente diferente, enquanto Marchionne tinha o consenso unânime de ter sido um CEO revolucionário na indústria automóvel, especialmente pela impressionante reviravolta do Grupo FCA e pelas ideias inovadoras aplicadas na Ferrari.
Dito isto, o analista reafirma a sua análise sobre a empresa, a qual está devidamente refletida neste relatório.
KEYWORDS: Equity Research; Valuation; Due Diligence; Discount Cash Flow; Luxury Industry;
Value Creation
TABLE OF CONTENTS
Glossary………...i
Abstract, Keywords and JEL Codes………..ii
Table of Contents………...iii
Table of Figueres………...iv
Acknowledgments………...v
1. Equity Research Note………....1
2. Business Overview………2
3. Management and Corporate Governance………..5
4. Industry Overview……….7
5. Competitive Positioning………..12
6. Investment Summary………...16
7. Financial Analysis.………..18
8. Key Investment Risks.………...25
9. References………...28
TABLE OF FIGURES
FIGURE 1- Revenue Generating Segments as % of Total Revenues, 2017………...4
FIGURE 2 - Company’s Worldwide Car Sales, 2017……….4
FIGURE 3 - Shareholder Structure, 2018………...4
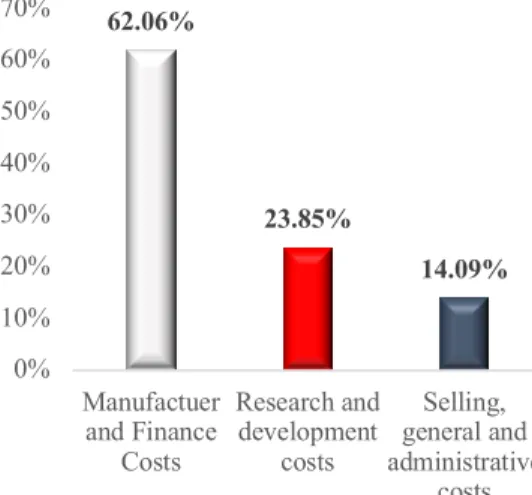
FIGURE 4 - Cost Breakdown, 2017………...4
FIGURE 5 - Shareholders’ Voting Rights, 2018………6
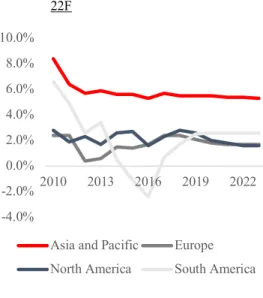
FIGURE 6 - Real GDP Growth Forecast, by Region, 2010-22F………....10
FIGURE 7 - Euro Performance against Renminbi, USD Dollar and GB Pound………..10
FIGURE 8 - Consumer Confidence Index 2013-Mid 18………..10
FIGURE 9 - Composite Leading Indicator, 2013-Mid 18………10
FIGURE 10 - Worldwide Sales Volume of Luxury Performance Cars by brand, 2015-17……… 15
FIGURE 11 - Relative Market Share of the Luxury Supercar segment by brand, 2017……… .15
FIGURE 12 - Relative Market Share of SUVs within the automotive industry,2014- 17………...15
FIGURE 13 - Projected Formula 1 payments to top 5 constructors, $ millions, 2016- 17………. 15
FIGURE 14 - Average Specific CO2 Emissions of Ferrari’s Fleet for the European Market, 2007-17F………15
FIGURE 15 - CAPEX vs D&A, € millions, 2016-22F……….20
FIGURE 16 - Company’s Debt Structure, 2017………...20
FIGURE 17 - Ferrari Vs Peers on EBITDA and Net Profit Margins, € millions, 2015-22F………....24
FIGURE 18 - Op. Cash Flow margin, € millions, 2016-22F………24
FIGURE 19 - FCFF Margin, € millions, 2017-22F………..24
FIGURE 20 - Total Debt & Net Debt, € millions, 2015-22F………...24
FIGURE 21 - Ferrari’s ROIC vs Avg. Peers ROIC 2015-18F……….25
Acknowledgments
Firstly, I would like to take this opportunity to express my sincere and deepest gratitude to my parents who have always encouraged and made it possible for me to pursue my college studies. In memory of my father, I’m especially grateful to him for everything he taught me, the life values he passed me overtime and for always having supported me throughout my all life.
Secondly, I would like to thank Professor Clara Raposo for her advisory, guidance and feedback throughout the project.
Lastly, I want to thank my friends and colleagues that direct or indirectly were part of this journey and made it special.
INTRODUCTORY RESEARCH NOTE
Date: 30/06/2018 Current Price: €116.50 Recommendation: Buy and Hold Ticker: RACE.MI (Reuters) Target Price: €121.21
RACE:IM(Bloomberg)
A recommendation to adopt a Buy-and-Hold strategy is initiated for Ferrari N.V. (RACE) stock. The target share price towards the end of the year is set at €121.21, which represents an upside potential of about 4% from the latest closing price of €116.50 on 30th June 2018. The target price is backed up by
the discounted free cash flow method. The relative valuation based on multiples is in line with the hold recommendation.
Despite the low upside potential, Ferrari definitely has a solid business on hands. For the moment, this is clearly the type of investment that is not oriented for capital gains, but rather for the strong and solid cash flows the company is able to achieve. Besides, it has been able to generate a robust Return on Invested Capital (24% in 2017) above the average of its peers within the luxury industry. This is important as it tells investors how funds invested in the business are being putted to good use, and thus it’s also a long-term performance measure.
Since its incorporation, Ferrari has been distributing part of its free cash flows as dividends to its equity holders. The forward dividend yield it’s set to 0.70% which is not impressive, but at the same time is aligned with the industry that tend to offer very solid and stable dividends, that are less prone to suffer cut backs.
For the stock justify a higher price than the proposed target, Ferrari must clarify whether the “self-imposed” maximum threshold of 10.000 cars produced yearly is to be maintained on the future or not. 0.0 € 20.0 € 40.0 € 60.0 € 80.0 € 100.0 € 120.0 € 140.0 € 3/16 6/16 9/16 12/16 3/17 6/17 9/17 12/17 3/18 6/18
Closing Price (EUR) 116.5
52 Week Range (EUR) 73.55-129.50
Avg. Volume (‘000) 620.428
Volume as % of shares outstand. 0.33% Shares Outstanding 185,690,987 Market Capitalization (EUR ‘000) 21,633 Institutional Ownership 8.60% Insider Ownership 34.29% Free Float 57.11% P/E ratio 40.08 EPS 2.95 Market Profile
INTRODUCTORY RESEARCH NOTE
Moreover, it’s not completely clear if Maranelo plant is able to keep up with a production way over the defined threshold. Even in a scenario where production is ramped up, Ferrari is already selling a lot more cars than its direct competitors (approx. 120% more than Lamborghini in 2017) which despite being very positive can also pose a threat to brand exclusivity, and consequently a loss in pricing power.
To overcome this issue, the company can try leverage its sales by acquiring Maserati so that the increase on total revenues it’s not entirely achieved by sacrificing brand exclusivity. Typically, in the luxury industry it’s very hard to increase volume and product margins at the same time, at least for extending periods, as product exclusivity, scarcity and, ultimately, personalization are paramount factors both for the producer to offer and to the consumer to appreciate.
The current target price is highly supported by a stable demand from the two main markets: Europe and North America which account for 70% of total volume. China and other Asian-Pacific countries represent also the emerging part of the business, approx. 22% of total demand. The operational efficiency of the company is also above the industry’s average with EBITDA and NOPLAT margins of 37% and 17%, respectively.
Ferrari has also been adopting a deleveraging strategy which is backed by strong operating cash
flows that allow for the repayment of such debt. It’s expected that by the end of 2021 Net Debt will become negative, as the company increases cash balances at a greater pace than its leverage. It’s a common sign in the luxury industry, Enterprise Values to be lower than Equity Values exactly due the existence of negative Net Debt. Under-Leverage will help to smooth out the WACC as the firm becomes more liquid and thus, investors will be exposed to less risk and consequently will demand a lower cost of equity. In the case of Ferrari is quite important as the market value of its equity outweighs by a long distance the total market value of debt. Moreover, is always good to have enough cash around to expand the business through acquisitions or invest on new projects.
2017 2018F 2019F 2020F 2021F 2022F Total Revenues 3416.89 3741.40 4085.00 4462.18 4894.26 5372.49 NOPLAT 609.22 644.12 678.26 725.45 786.88 856.62 Total Assets 4141.10 4639.43 5180.21 5790.63 5809.02 6609.50 Total Liabilities 3357.17 3384.42 3419.18 3461.43 2844.63 2928.83 Total Debt 1806.18 1761.17 1712.66 1689.28 979.91 967.57 FCFF 415.77 470.29 573.77 595.13 638.95 733.70 NOPLAT Margin 17.83% 17.22% 16.60% 16.26% 16.08% 15.94% ROA 12.98% 13.56% 13.58% 13.64% 15.31% 15.17% ROE 68.55% 50.12% 39.96% 33.92% 30.00% 27.24% Debt-to-EBITDA (x) 1.74 1.50 1.30 1.15 0.59 0.53
Business Description
Ferrari N.V. is a leading Italian luxury brand focused on the production of luxury performance sports
cars. Currently it’s incorporated in the Netherlands as a public company with limited liability. The company is listed under the ticker RACE in both NYSE (New York Stock Exchange) and MTA (Mercato Telematico Azionario di Borsa Italiana).
In 1939, Enzo Ferrari founded the company alongside with his own racing team, Scuderia Ferrari. The first race and road car were launched in 1947 and 1948, respectively. The initial participation in the Formula 1 World Championship goes back to 1950, which makes Scuderia Ferrari the longest running F1 team. The success of the manufacturer caught the attention of Fiat Group, that in 1969 acquired a 50% stake in the company, later increased to 90% after Enzo Ferrari’s death.
On October 29, 2014, Fiat Chrysler Automobiles (FCA), former Fiat Group, announced the intention to separate Ferrari from its operations (spin-off), in a process that was known as the “Separation”. The operation was fully completed on January 3, 2016.
The company’s production facility and corporate headquarters are located in Maranello, region of Modena, Italy. There’s also a second plant in this region allocated just for the production of automobiles’ bodywork and chassis. The design, development and assembly of both Sport and GT cars, as well as, F1 cars takes place in the Maranello plant. All post-production road tests are performed in the Fiorano racing track, that is adjacent to the plant. Besides the production of both road and racing cars, Ferrari has an agreement with Maserati to supply it with V6 and V8 petrol engines until 2020, an arrangement that may be extended in the future.
The business has a significant dependence on raw materials, mainly aluminium, composite materials like carbon fiber and some precious metals such as palladium and rhodium that are sourced from a limited number of suppliers. Also, because the price of these raw materials fluctuate overtime, the company is subject to some degree of commodity exposure.
Source: Company Data
Source: Company Data
Source: Company Data Figure 3. Cost Breakdown, 2017
Shareholder Structure
Currently, the BoD owns approx. 34.29% of the outstanding shares. Among board members 0.79% of the shares (contingent of free float) are directly owned by executive and non-executive members, 10% directly owned by Enzo’s Ferrari son, Mr. Piero Ferrari (Co-Vice Chairman) and 23.5% indirectly through Exor. Blackrock and T. Rowe Price Associates, two U.S. investment firms who traditionally seek long term investments, hold 3.6% and 5.0%, respectively. The remaining 57.11% is free float.
Source: Company Data
71.88% 10.93%
14.46% 2.74%
Cars and Spare Parts Engines Sponsorship, commercial and brand Other 44.50% 33.50% 7.30% 14.70% EMEA Americas Greater China Rest of APAC 57.9% 23.5% 10.0% 5.0% 3.6% Free Float Exor N.V. Piero Ferrari T.Rowe Price Assoc. Blackrock 62.06% 23.85% 14.09% 0% 10% 20% 30% 40% 50% 60% 70% Manufactuer and Finance Costs Research and development costs Selling, general and administrative costs
Figure 1. Revenue Generating Segments as % of
Total Revenues, 2017
Figure 2. Worldwide Car Sales, 2017
Figure 4. Cost Breakdown, 2017 Figure 3. Shareholder Structure, 2018
Source: Company Data Source: Company Data
Management and Corporate Governance
Corporate Governance
Ferrari is organized under the Dutch Corporate Governance Code and is also qualified as foreign
private issuer under the NYSE listing standards. Both Dutch and NYSE governance models were adopted as they are based on the same principals, though with some differences. As a foreign private issuer, Ferrari does not have to comply with the NYSE specific applicable rules for U.S. domestic companies. Whenever that’s the case, the procedure is to follow the Dutch Code.
Currently the company deviates from the Dutch Corporate Governance Code in 4 best practices. The risks that can arise from those deviations are related with independence of the BoD, lack of independence of the audit committee when nominating an external auditor and related-party transactions.
The company’s corporate governance model consists of:
Board of Directors- is composed of 13 members (1 executive and 12 non-executive) and currently the majority of the board (8 members) is independent. It’s responsible for both the management and strategic direction of the company and the appointment of the internal committees. The term office is 1 year, and each Director may be reappointed at any subsequent annual general meeting of shareholders;
General Meeting- shareholders appoint the BoD and approve its remuneration policy in articulation with the Compensation Committee which is responsible for performance evaluation and remuneration. It’s composed by 3 independent board members;
Governance and Sustainability Committee- it’s composed by 4 independent board members. It assists and advises the BoD in matters such as: the performance of individual directors; nomination or re-nomination of directors to be appointed in the general meeting; monitoring and evaluation on the company’s sustainable policies and practices, management standards, strategy, performance and governance;
Audit Committee- constituted by 3 independent members, assists and advises the BoD in aspects related with the integrity of the company’s financial reporting and disclosure, tax planning, compliance, etc. It also recommends the external auditor and makes sure it remains independent of the management;
Voting Rights
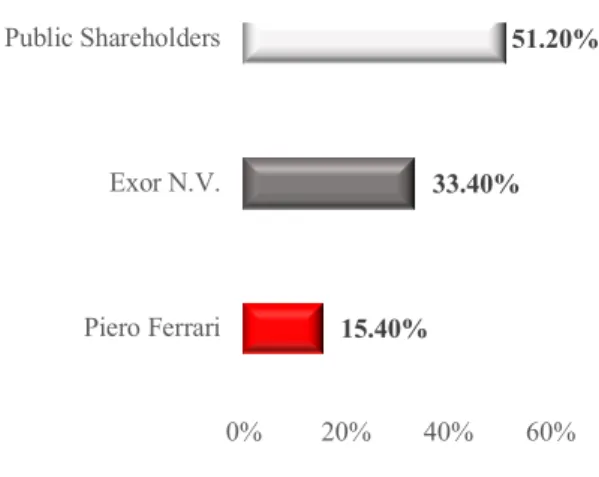
The company’s management holds directly through Piero Ferrari 15.4% and indirectly through Exor 33.4% of the voting rights resulting in a joint control of 48.8% in the company’s current and future strategic guidance. Public shareholders hold approx. 51.2% of the voting power.
Both Piero and Exor shares hold special voting rights that were firstly created after the spin-off from
FCA. The special voting rights are also part of Ferrari’s Loyalty Program that seeks to encourage a
stable shareholder base. Long-term common stock ownership (>= 3 years) grants shareholders the right to receive special voting shares if they apply for this specific program. Nevertheless, voting shares cannot be traded unless they are detached from their special voting rights first.
Since 48.8% of decision power is attributed to the management through stocks that are part of the
Loyalty Program, that’s a way of mitigating hypothetical future agency problems.
In general terms, the BoD and public shareholders have approximately the same degree of voting power which promotes the mutual engagement of these two identities to share a common view on structural points of the business, or at least to reach some sort of shareholders’ agreement.
Management Overlaps- Possible Conflicts of Interest
Mr. Sergio Marchionne was appointed Ferrari’s Chairman and CEO after the spin-off from FCA and holds approx. 0.77% shares. He’s also CEO of FCA. On the other hand, John Elkann, Co-Vice Chairman of Ferrari, assumes at the same time both the positions of Chairman and CEO at Exor, plus the position of Chairman at FCA. Exor owns 29.4% common stock and 43.3% voting rights in FCA. Additionally, it’s relevant to stress that Mr. John Elkann is also Chairman of Giovanni Agnelli B.V. which holds 52.99% of Exor. That helps to explain the indirect influence of Exor on Ferrari’s BoD. For all these reasons, conflicts of interest can arise as these two individuals owe duties to more than one company. 15.40% 33.40% 51.20% 0% 20% 40% 60% Piero Ferrari Exor N.V. Public Shareholders
Industry Overview
Luxury Industry Overview
The luxury industry is comprised by many segments. According to Bain & Company, luxury cars, luxury hospitality and personal luxury goods segments account for more than 80% of the market. In 2017 the industry grew 5% (YoY) to an estimated global value of € 1.2 trillion. In particular, sales of luxury/premium cars increased 6% (YoY) which translates into a total global value of €489 billion.
Demand Outlook
The real source of demand in the luxury industry is the consumer’s dream. Indeed, it’s the dream of possessing a luxury good or experiencing a luxury moment what makes an individual to make a positive movement towards the purchase. Inherent to this consumer feeling, is the fact that luxury brands must continuously evoke status (brand strength), outstanding quality and performance, style and novelty on their product line-up, so that demand can remain alive. After all, there would be no consumer dream if no brand didn’t come up with products that embed the dream of a luxury life, in the first place.
The main source of growth continues to be driven by consumers in emerging markets. China was the top performer, backed by an increase on consumer confidence levels and by the rise of a new fashion trend preeminent on the upper-middle class. Also, according to 2017 Forbes list of billionaires there are 2043 billionaires around the world, which corresponds to a 13% increase (YoY). China accounts for ± 400 billionaires, representing an increase of 26% (YoY). Lower prices differentials with the rest of world also helped to boost sales on China mainland, partly due a strengthen of the Renminbi against the Dollar.
This important as luxury companies respond to currency movements in order to maintain their price structures among the various countries in which they are present. For instance, after the British referendum, the sterling pound fell by 18% against the dollar. In order to adjust for currency, brands responded by raising their prices in the UK. However, despite this type of adjustments, price disparities within the luxury goods market may still exist. Therefore, arbitrage opportunities can arise. Industry’s sales in China summed up to € 20 billion, a 15% increase (YoY). In addition, also in Asia, Japan continuous to be a key market for luxury brands. The market grew 4% (YoY) with a total sales value of €22 billion.
Once again, the appreciation of Renminbi against the Yen helped fuel purchases from Chinese travellers. Internal demand, was special higher on the second half of the year when the Yen strengthen against the Dollar, boosting consumer purchasing power.
Europe is the region that best performs when it comes to luxury sales by value. Nonetheless, sales are expected to remain quite stable on a modest growth trajectory. Sales totalized € 87 billion, a 6% increase (YoY). In general, European domestic shoppers and wealthy tourists are quite cautious about spending. It’s also important to stress, that Europe is the region that is home for the majority of luxury brands out there.
Both North and Latin America markets showed a very modest growth of 2% (YoY). Nevertheless, in 2017, total sales value in these two markets combined was €84 billion, which puts the American market right next to the European market, in terms of sales value, thus crucial for luxury brands. In LATAM, Mexico is the largest country for the luxury goods market followed by Brazil. By contrast, United States, the world’s largest country for luxury goods, has experienced a slow down on sales.
Macro Analysis – A quick glance on key luxury markets
China- Economic growth in China has been one of the strongest in the world. In 2017 GDP increased by 6.8% with future forecasts pointing for a 6% growth. China’s monetary policy is pretty much focused towards a very competitive currency in order to favour exports, the main growth driver of the economy. In other words, China’s economy is very sensitive to Governmental policies. A stronger Renminbi is a good sign for internal purchasing power, especially for imported goods, such as luxury. Since the beginning of 2017, Chinese currency has been appreciating especially against the dollar. This poses a threat on the competitive ability of the currency and consequent slow down on external demand for Chinese exports. Given this, it’s most likely that currency appreciation will not be sustainable in the future, especially because of governmental intervention.
Japan- This economy is very peculiar as Japan is the most indebted country in the world (239% of GDP). Most of the debt is domestic (owned by the central bank and domestic financial institutions) so debt default is a very remote possibility, as by declaring it the government would have to recapitalize itself. The country does not simple financial implode, mainly due to: low interest rates, very tight control of spending and high taxes. As long as, there’s a balance surplus and debt can be repaid, Japan’s economy, in theory, will not crash.
Given this panorama, luxury industry in this country could face volatile times ahead, primarily linked to currency fluctuations and also due to the high taxes both on consumption and personal income. In 2017 Japan’s GDP grew by 1.7% and forecasts are pointing for a future growth rate of 0.7%.
United States- One of the biggest fears in currency markets right now is that inflation picks up on the U.S. Dollar. The Federal Reserve most likely will raise fund-rates as a way to contrary the erosion in currency value, after years of economic stimulus. As consequence, US sovereign debt yields are raising, as demand for dollars is decreasing due to inflation concerns. Also, the stock market is highly inflated after following a bull market pattern for quite a few years until now. This, in theory, will have a direct negative impact on imported goods, as internal purchasing power will most likely decrease, as well as, on consumer confidence levels.Incentives to protect U.S. economy are also expected to occur. China’s currencystrengthen can be partially explaineddue to the fact that investors are allocating more funds in its economy, as a safe heaven, and also due to a decrease in foreign exchange reserves of the People’s Bank of China, namely in dollar terms, as United States represent the biggest market for China’s exports. In general terms, a weaker dollar is positive for U.S exports and negative for imports, namely luxury.
United Kingdom (UK)- Currently there’s a big unknown about the future post-Brexit trade relationship between the EU and UK. There still no clear agreement especially on matters related with external tariffs, quotas and customs clearance on exported/imported goods. Nonetheless, chances are that a Free Trade Agreement will eventually be achieved between these two parties in a near future. Since the Brexit referendum, the GBP has been depreciating in value in relation to both the Euro and U.S. Dollar which negatively affects imported goods, especially luxury items, from these two regions. An “unsolved” Brexit situation poses a serious threat on the performance of UK’s economy, affecting negatively consumers’ confidence levels and ultimately internal demand. In 2017, GDP grew 1.7% (YoY) and look-ahead forecasts expect the same real growth rate of 1.7%, an optimistic forecast, as still there’s a lot of uncertainty around this economy.
Europe (E.U.)- despite the introduction of the quantitative easing program by the ECB which has been aimed to boost the Eurozone economy, overall levels of investment remain relatively weak and unemployment medium-high. Nonetheless, the Eurozone economy is growing at a moderate pace. In 2017, it increased in real terms 2.1% and forecasts indicate a decrease in the growth rate towards the 1.5% in the forthcoming years. It’s also important to stress the economic performance of Germany, given its main role in the European economy and also because its home for the majority of the billionaires in Europe. It recorded a GDP increase of 2% in 2017, in line with EURO area growth. Forecasts estimate a smaller growth in the future of about 1.3%.
LATAM- Mexico is the most relevant market for the luxury industry in LATAM. In 2017 GDP increased 2.1% (YoY). Look-ahead forecasts are projecting a growth of 2.7%. Nevertheless, future growth is highly dependent on the most profitable free-trade agreement of the country: NAFTA. The thing is that, U.S. is refusing to accept the permanency of the Mexico in NAFTA. Indeed, if it occurs, the impact on the Mexican economy of such decision will be disastrous affecting dramatically Mexican exports and, in turn, the Mexican peso pushing downwards the currency. Alongside with this big uncertainty, there’s also political instability that together can push the Government to tight monetary policies, that will have a negative impact on both private consumption and investment. Due to these reasons, luxury industry in Mexico might face adverse times.
-4.0% -2.0% 0.0% 2.0% 4.0% 6.0% 8.0% 10.0% 2010 2013 2016 2019 2022
Asia and Pacific Europe North America South America
6.5 6.7 6.9 7.1 7.3 7.5 7.7 7.9 0.0 0.2 0.4 0.6 0.8 1.0 1.2 1.4 Ma r-1 5 Ju n-15 Se p-15 De c-15 Ma r-1 6 Ju n-16 Se p-16 De c-16 Ma r-1 7 Ju n-17 Se p-17 De c-17 Ma r-1 8 Ju n-18 EUR/USD EUR/GBP EUR/CNY 94 96 98 100 102 104 Ap r-1 3 Au g-13 De c-13 Ap r-1 4 Au g-14 De c-14 Ap r-1 5 Au g-15 De c-15 Ap r-1 6 Au g-16 De c-16 Ap r-1 7 Au g-17 De c-17 Ap r-1 8 USA China Euro Area
Long Term Base Line
98 99 100 101 102 103 Ap r-1 3 Au g-13 De c-13 Ap r-1 4 Au g-14 De c-14 Ap r-1 5 Au g-15 De c-15 Ap r-1 6 Au g-16 De c-16 Ap r-1 7 Au g-17 De c-17 Ap r-1 8 UK China USA Euro Area
Long Term Base Line
Figure 6. Real GDP Growth Forecast, by Region,
2010-22F
Source: IMF
Figure 7. USD Dollar and GB Pound Performance
against Euro / Euro against Renminbi
Source: Reuters Eikon
Figure 8. Consumer Confidence Index 2013-Mid 18
Source: OECD
Figure 9. Composite Leading Indicator, 2013-Mid 18
Supply Outlook
Supply in the luxury industry is not driven by volume. Most companies operating in this business, indeed chose to adopt a low volume strategy in order to maintain a reputation of exclusivity and scarcity of their brands among customers. Therefore, the production of such goods is adjusted to a lower scale, exactly with the aim of understating demand. Volume turnover is not impressive at all in this industry, however sales turnover is quite the opposite. This can only be explained by the high margins embedded in the prices of this type of goods.
Companies are able to charge extremely high margins due to their strong brand equities and high perceived values. It’s paramount, that such qualities must be maintained throughout time so that margins on new products can be constantly improved. Consumer demand must be stimulated not with the aim of increasing sales volume, but rather with intuit of making the consumer curious and excited about the launch of new products. Therefore, luxury brands are required to have the ability to renew their product line-up quite regularly.
Adjusting Supply to new Industry Trends
One of the most noticeable trends that is taking over the luxury market is product personalization. Indeed, it offers a more luxury experience for the customer besides the luxury product just by itself. It also represents an opportunity for brands to capitalize on their product margins through this type of personal-customization. This trend is particularly incident on luxury cars and on personal luxury goods such as: jewellery, watches, apparel and footwear. According to a Deloitte survey on the subject, about 45% of the inquired population was asking for more personalized products and services.
“Millennialization” is not a quite a new market trend, but rather a generational shift on the customer base that is transversal to all luxury brands. In other words, luxury goods are now spreading into the younger generations (born: 1977-1995) like never before. About 85% of the aggregate 2017’s growth for the industry was attributed to the millennial mindset shift. Therefore, this shift towards luxury products is forcing brands to redefine their value propositions to better address younger generations.
Industry Future Outlook
According to future forecasts, industry growth will continue to be positive, between 4%-5% CAGR for the next three years. In 2017 market conditions changed in a positive direction, about 65% of all luxury brands experienced revenue growth, which represents an increase of 15% from 2016.
However, among the 65% of brands that managed to grow in 2017, only 1/3 actually was also able to grow their profits. This poses uncertainty on long-term value creation, as the improvement of operational efficiency probably will be one of the biggest challenges that luxury brands will need to overcome in the future.
Competitive Positioning
Ferrari, more than ever, wants to be perceived as a luxury brand rather than just an automobile icon.
In fact, its main business is to produce luxury performance cars. However, the level of exclusivity, performance, styling and premium price of their products alongside with strong brand equity sets the company right on the luxury market.
Nevertheless, Ferrari is still a car manufacturer, and, for that reason, some aspects related with the automobile industry must be addressed, such as Governmental regulations (e.g.: CO2 emissions) or benefits (derogations from currently applicable production standards) and other automobile legal requirements than can vary with geographical region (e.g. vehicle safety legislation) that are transversal to all automobiles manufactures. In addition, some broader automobile industry trends (e.g. SUVs) and new technologies (e.g. hybrid/electric) should be also considered.
Luxury Performance Car Segment
Within the luxury/premium automobiles sector, the segment of luxury performance cars comprises all two-door cars powered by engines producing more than 500 HP (horse-power) and with a retail price of at least € 150,000 (VAT included). Manufactures present in this market either belong to large automotive groups or are small producers exclusively focused on performance luxury cars. As for product segmentation, there’s two main segments: Sports Cars and GT (Grand-Tourer) Cars.
The United States remain the world’s largest market for performance luxury cars. About 30% of the worldwide volume sold in 2016, for this specific niche-market, was attributed to this region. Sales increased only 1.1% (YoY), though. Both UK and China markets came second and third, with about 16% and 15% of the worldwide demand, respectively. The growth in the UK market was 15.6% (YoY) and in China, an impressive, 54.2% (YoY).
Direct Competition
Ferrari faces direct competition with other international luxury performance car manufactures, some
of whom are part of larger automotive groups such as: Lamborghini, Bentley, Audi and Porsche that are integrated in the Volkswagen Group and Rolls-Royce that is part of BMW.
Small producers like McLaren and Aston Martin (5% owned by Daimler) are exclusively dedicated on the production of these type of automobiles. Appendix-10; 1-2
Drivers of competition in this market segment: • Price;
• Brand Strength;
• Appeal of the products especially in terms of performance, design, cutting-edge tech. and innovation;
• Ability to frequently renew the product line-up to stimulate customer demand;
• The size of financial resources interlinked with flexible planning and capital spending;
• Total Cost of Ownership is extremely important as overtime a high resilience on the devaluation of these cars reduces the TOC, and thus promotes repeated purchases by clients that often flip their cars or hold them as investments (Ferrari dominates the top-dollar collector car world, holding seven of the top ten highest prices ever paid for automobiles at an auction; a 1963 Ferrari 250 GTO holds the record, sold at a private auction for a reported $70 million);
Ferrari’s Strategical Options- Adjusting the business towards Competitive Advantage 1. Introduction of a luxury performance SUV
The SUV hype present in the automobile industry is making its move to the segment of luxury performance cars. In fact, the SUV segment represents 34% of global auto sales, an increase of 3% in market share since 2016 and 11.5% since 2014. Bentley was pioneer by bringing a luxury SUV to this niche-market and, at the end of the day, it “open the doors” for a new segment: Luxury Performance SUV. Lamborghini recently launched its first ever Performance SUV, too.
Ferrari will not fall behind and already has plans to launch its own interpretation of a luxury performance SUV, the FUV (Ferrari Utility Vehicle), by the end of 2019. According to Ferrari’s CEO it will be the fastest SUV on the market, and it will drive and feel like a proper Ferrari.
2. Hybrid and Electric Technology
The transition to hybrid technology is becoming a reality for luxury performance cars, although at very slow pace when compared to mass market vehicles. Ferrari intends to use its expertise on this department, as this technology is currently being fully applied on their F1 engines. It’s expected the transition of Ferrari’s product portfolio to hybrid tech by 2019.
Ferrari also has plans to launch an electric supercar by 2020 to compete directly with Tesla, the
In addition, it’s also a way to capitalize on the hybrid tech as going from there to fully electric, certainly doesn’t require much operational investment as it’s represents an extension of the concept.
3. Formula 1
Ferrari’s marketing strategy is mostly entirely carried out by its present in the Formula 1 World
Championship. The continuous success and appeal of the brand is connected with the success of the Scuderia Ferrari. The latest cutting-edge technology is implemented in the racing cars, so F1 may be perceived as a demonstration of Ferrari’s latest technological capabilities. Revenues from F1 come from sponsorship agreements and broadcasting rights. It’s estimated that in 2017, Ferrari received broadcasting proceeds of $180 million, about 1/5 of the total pot to be distributed for all racing teams. Ferrari continues to be the top earner, alongside with the title of the most successful team in F1 history. The company’s R&D costs are mainly incurred by the F1 Racing Team. Technologies developed by that department are then usually transferred and adapted to road model automobiles, both Sport and GT versions. The racing DNA is present across all Ferrari models, reason why it remains a true value booster for the brand.
4. Product Licensing on adjacent luxury categories
Ferrari licenses its own brand to third parties which produce personal luxury goods. Partnerships
are made with the objective, once again, of enhancing brand value and in certain way to reach the segment of personal luxury goods, to clearly affirm the exclusivity of the brand. In this field, the most notorious partnership is with the Swiss watchmaker Hublot that is part of the LVMH luxury conglomerate. More recently, Luxottica, the owner of Ray-Ban, has become a partner, too.
Regulatory Risks
All car manufactures are subject to laws and regulations related to fuel economy requirements, reduction of pollutant emissions and vehicle safety that can compromise both the cost structure of the company and, ultimately, the final product proposition to the consumer.
Currently Ferrari is considered a small volume manufacturer (SVM; production < 10,000 cars/year) and because of that status is able to benefit from a derogation linked to emissions requirement in both E.U. and U.S.A., otherwise the costs of compliance for that matter would be significantly higher. Furthermore China, Canada and some M.E. countries are now creating new policies to address these issues and they can be even more stringent putting additional pressure on the company. Hybrid tech, in some way, mitigates the problem but does not solve it for good, hence the presence of regulatory risk which can lead to an increase on compliance costs. In the extreme case, Ferrari can become ineligible to sell its cars in certain regions if the required compliance is not properly addressed.
22.40% 26.50% 30.80% 34% 0.0% 5.0% 10.0% 15.0% 20.0% 25.0% 30.0% 35.0% 40.0% 2014 2015 2016 2017 0 50 100 150 200 250 Ferrari Mercedes Red Bull Racing Mclaren Williams
2016 2017
Figure 13. Projected Formula 1 payments to top 5
constructors, $ millions, 2016- 17
Figure 12. Relative Market Share of SUVs within
the automotive industry,2014- 17
Source: Jato Dynamics Note: values are not disclosed by Liberty Media
nor the teams
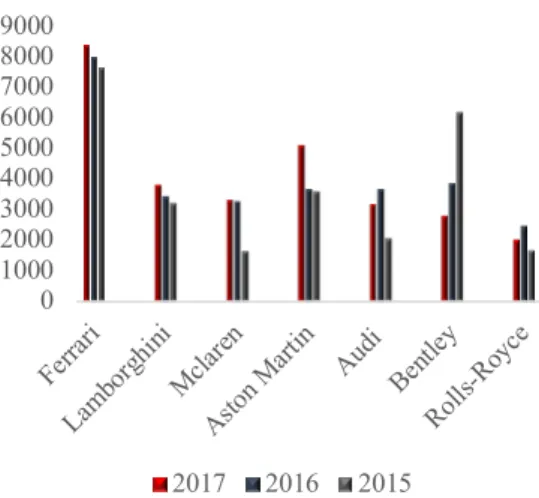
Source: Autosport 0 1000 2000 3000 4000 5000 6000 7000 8000 9000 Ferra ri Lamb orghi ni Mclar en Aston Mart in Audi Bentl ey Rol ls-Royc e 2017 2016 2015 29.27% 13.30% 11.64% 17.83% 11.08% 9.80% 7.07% Ferrari Lamborghini Mclaren Aston Martin Audi Bentley Rolls-Royce
Figure 10. Worldwide Sales Volume of Luxury
Performance Cars by brand, 2015-17
Source: Companies’ data (Porsche’s data for the
segment not disclosed)
Figure 11. Relative Market Share of the Luxury
Supercar segment by brand, 2017
Source: Companies’ data
Figure 14. Average Specific CO2 Emissions of Ferrari’s
Fleet for the European Market, 2007-17F
Investment Summary
Valuation Methodology
As part of the valuation process, two methods were used to compute Ferrari’s share target price. The first approach was through the discounted cash flow model (DCF) in which free cash flows to the firm (FCFFs) were used to came up with an overall enterprise value, then adjusted for the equity value. The second method was performed as a complement to the DCF model, although not as meticulous. It’s based on a relative valuation principle, in which multiples derived from key financial ratios within a peer group are used to perform a broader valuation of either the equity or enterprise value.
Investment Risks
Despite both the robust ROIC and strong operating cash-flows Ferrari is able to achieve, there’s still uncertainty on the business regarding the total output produced. The company has for now a “self-imposed” maximum threshold of 10,000 units to be produced each year in order to maintain its status of SVM (Small Volume Manufacturer) that has been saving the company a lot of cash in compliance costs. The total real capacity of Maranello factory is not disclosed, but if indeed sales go beyond the 10,000 units/year, it’s highly probable that the company will need new facilities or at least expand significantly the current one.
Also, when comparing with its direct competitors, like Lamborghini and McLaren, Ferrari is selling on average about 100%-120% more automobiles per year, which is a good thing but can also be misleading, as by selling a lot more than the competition the scarcity and exclusivity of its products might be negatively affected. That, in turn, may affect the ability of the company to charge high premiums on its products. So far, Ferrari has managed to increase sales at the same it increases price premiums, but the big question remains: Will the company be able to continue to operate with such profitability in the long-term?
As for demand, it’s expected that the main “Cash-Cows” markets, Europe and North America, remain robust. The main sources of volatility could arise from China and other Asian-Pacific countries like Japan and from the Middle East, especially in the Persian-Gulf area. Together these sources of volatility represent approx. 30% of total sales of the company.
Merger & Acquisition- A possible and plausible future
One of the sources of industrial revenue is the production of petrol engines to Maserati. As consequence, Ferrari is involved as an outsourced party in the supply chain of Maserati, that is part of FCA Group. Because both supply chains are already interlaced in this specific bilateral agreement and, also due to the fact FCA already showed some interest in spinning-off the brand, Ferrari management can try and bid for the acquisition of Maserati. However, investors should keep in mind, that for the acquisition to be value accretive for Ferrari, the company’s current ROIC and the fair value of Maserati’s business must be used as guidelines, because by paying too much of a premium will have a negative impact on ROIC and thus, a negative impact on the overall long-term value being generated for the party that is acquiring.
Definitely this deal can be useful for the company, minding the reasons already mention before. By paying the right amount for Maserati, Ferrari could boost sales without exposing too much its own brand, thus being able to keep the price premium power and also being capable to grow the overall number of automobiles sold each year as a group.
Valuation
Free Cash Flow to the Firm (DCF Model)
In order to access the equity value of Ferrari, the DCF Model was used. That translated into a target price of €121.21, which represents an upside potential in relation to the market valuation of approx. 4 %. The Free Cash Flow to the Firm method aims to determine the amount of cash that is available to be distributed between debtholders and shareholders at the end of the year. Because those are free cash flows then by using the DCF model to discount them, one obtains the firm’s Enterprise Value that further requires the adjustment of net debt and minority interests, to obtain the equity value. The DCF Model is designed as a two-stage process, in which there’s an explicit forecasting period, five years in this case, and subsequently a normalized terminal period that runs into perpetuity with a constant growth rate.
Even though, Ferrari has been paying dividends to its shareholders each year since 2016 and it’s expected to continue to do so, it’s not prudent to disregard the DCF Model in favour of the Dividend Discount Model (DDM), as dividends are far from a mature cycle.
The key aspects that influence the dynamics of DCF model are:
• Industrial Production
The industrial sales are divided into two segments: automobiles/spare parts and petrol engines sourced to Maserati. The total number of units of automobiles/spare parts was forecasted according to the respective weight that each region is expected to contribute yearly, in terms of unit sales. Those assumptions are based on both forward regional CAGRs for the luxury industry and also the historical company’s CAGR- Appendix 8. The total output of petrol engines to be produced for Maserati are expected to grow constant in the forecasted period, as no further information is disclosed and also because Maserati has now at its disposal diesel engines that can be fitted in some of its models, according to customer preference, thus offsetting the need for petrol engines. It’s also assumed that the Maranello factory is working in an order fulfilment basis, which means that it only produces what is requested.
• Sponsorship, Commercial and Brand
Formula 1 World Championship is the big source of income when it comes to sponsorship and broadcasting rights. The dimension of such funds is dependent upon the performance of Scuderia
Racing Team in the competition. Brand licensing to other luxury brands (e.g. Hublot) represents also
a stream of income for the company. Historically, revenues in this specific account have been quite stable and so, the historical CAGR of 1.1% was assumed throughout the forecasting period.
• Ferrari Financial Services (F.F.S)
Financial Services are provided both direct to dealerships and customers. This operation is mostly concentrated in the United States. Its purpose is to expedite the all process of selling a car to the final customer, as the cars are sold first at discount to the dealerships and only then to the customers at a mark-up that is line with Ferrari requirements. For those dealerships that want to leverage their business, the financial services are an option, as well as, for those customers that don’t want to pay fully up-front. Historical revenues have remained quite constant so as the projected years. Financial contracts have an estimated approximate maturity of eight years.
• Manufacturer and Finance Costs of the F.F.S
Ferrari relies on several local suppliers in the region of Modena for raw materials like aluminum and
other precious metals such as rhodium and palladium that are considered commodities and thus, they’re subject to price volatility. For some electronic and mechanic components the company relies on Magneti Marelli, a subsidiary of the FCA Group, Brembo for brakes, Pirelli for tires and on several other strategic partners located in Italy and Germany. Nevertheless, there’s special items like turbochargers that are outsourced from Japan.
In relation to the financial services, funds have been raised using securitizations programs in the United States, often by pledging future financial receivables and credit lines as collateral. Both manufacturer and funding costs are considered in the cost of sales, which are assumed to remain stable in relation to its proportion to total revenues throughout the projected years. Appendix- 12;7
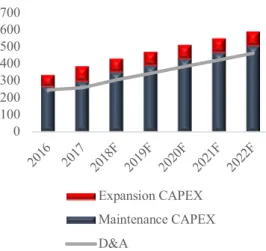
• Depreciation & Amortization and CAPEX
Innovation is paramount at Ferrari. As consequence, each year there’s a lot of investment into the development of car projects and related components alongside with engines and systems for both Formula 1 and road vehicles. All the costs that may be directly attributed to the development process are capitalized as development costs under intangibles assets. Still, there’s also some patents, licenses, concessions and trademarks that also figure under the same balance account, although with less weight. Amortizations of intangibles have a historical average of 35.7%. As for tangible assets, they account for property, plant and equipment, whilst the historical average for depreciation is 21.1%. The business is then highly dependent on the R&D department for continuous innovation and on the cutting-edge manufacturer plant. For those reasons CAPEX is expected to be above total D&A throughout the forecasted period and in the long-term. As consequence, non-current assets are expected to increase every year. It’s expected the company to invest on average, in maintenance and substitution CAPEX approx. € 429 million alongside with € 83 million in expansion CAPEX, for the forecasted years. - Appendix 12;4
• WACC Assumptions
The cost of equity was computed using the CAPM model. The risk-free rates (Rf) used were based on a weighted average of the two most valuable markets for the company, Europe and North America, on respectively the German Bunds and U.S. Treasury Bonds/Notes in accordance to the maturities that best fit the forecast. The same type of logic was implemented to come up with the market risk premium (MRP), but this time by splitting the European region into to the most important countries for the business alongside with their respective CRPs. The United States was also considered. The final result was an MRP of 5.44% that was applied across all years Appendix- 12;2-3
The levered beta was computed through linear correlations between Ferrari’s stock returns against a global market proxy, in this case, the MSCI All Country World Index (Medium-Large Cap). The same methodology was applied for the peers to come up with their own levered betas. After de-leverage all betas and smoothing them for the industry peer group, Ferrari’s re-levered beta was set to 1.14 for 2018. Appendix- 12;1
The cost of debt is quite low, due to the current economic stimulus and low-interest rate environment in both Europe and North America. The business is exposed both to EURIBOR and USD LIBOR rates plus spreads ranging from 60 to 120 bps, as well as, to annual interest payments on issued bonds. After factoring for these considerations, cost of debt was set at 2.17% for 2018. The effective corporate tax has been ± constant since 2015, usually attached with tax benefits that come in the form of deferred tax assets that are due to temporary differences in overpaid taxes that usually are then partially offset with deferred tax liabilities. Ferrari pays its taxes in Italy at both Statutory and Regional levels, despite being incorporated in the Netherlands. A constant marginal tax rate of 24.2% was assumed. Appendix-12;5-9
0 100 200 300 400 500 600 700 2016 2017 2018F 2019F 2020F 2021F 2022F Expansion CAPEX Maintenance CAPEX D&A
Figure 15. CAPEX vs D&A, € millions, 2016-22F
Source: Company Data & Analyst Estimates
68% 28%
3% 1%
Bonds Securitizations Bank Loans Other debt
Source: Company Data
• Terminal Value Considerations
The terminal value aims to normalize the free cash flows that had been forecasted previously, thus smoothing the all process before a perpetuity growth rate is applied. According to Ferrari’s CEO, Maranello plant is not operating at full capacity yet which leaves room for future improvements. It’s highly expected that production reaches the threshold of 10.000 cars in the future, but it’s not disclosed whether that’s also the full capacity of the plant. Nevertheless, the perpetuity growth rate was set to 2.10%. To achieve that value, computations were done so that it was possible to grasp how FCFFs are expected to grow in perpetuity, given the average proportion that each operating and investing cash flow represents on total revenues, adjusted for their respective CAGR on both explicit and terminal periods. Somehow, it’s an attempt to figure out what’s the overall impact on FCFFs given revenue performance.
Peer Selection
As mentioned previously on this report, Ferrari has a singular position when compared to its automotive peers. It’s hard to compare a company that sold roughly 8000 units last year with, for instance, other luxury brands such as Audi that sold almost 2 million cars and even Porsche with approx. 240 thousand units sold. Even if one wants to compare Ferrari with its direct competition:
Lamborghini, Aston Martin, McLaren, Rolls-Royce and Bentley it’s practically impossible as none of
them is publicly traded. So, given this context and bearing in mind the strong brand equity, pricing power, product exclusivity and the high resilience of the business on adverse economic cycles, it’s plausible to allocate Ferrari in the luxury sector, as those attributes are characteristic of luxury brands. The peer group was then composed by six companies: LVMH Moet Hennessy, Ferragamo,
Richemont, Hermès, Kering and Moncler.
Relative Valuation (Multiple Valuation)
As a complement to the DCF method, a relative valuation based on Ferrari’s selected peers was also performed. The valuation was based on two types of multiples, price and enterprise value multiples. Sales based multiples are suitable, as traditionally there’s low volatility in revenues within the luxury industry, as well as, cash flow-based multiples as the ability to generate cash is still king when it comes to value a business. Enterprise value multiples are valuable as they comprise the effect of leverage and cash on the business and for that reason it gives a greater perspective on how capital structure affects the value of a company. On general terms and according to the relative valuation,
Ferrari is priced just about right, €115.36, in relation to the market price at the date of this report,
Financial Analysis
Demand Outpaces Supply
The production at Maranelo plant is adjusted accordingly the dealers’ orders. In other words, Ferrari only produces cars that are certain to be sold, which leaves no room for final product inventory. However, because all the manufacture process is not performed in series, but rather handcrafted assembled with highly customized orders, it makes the all supply chain to eventually bottleneck at same point in the structure, especially due to the fact that demand has been exceeding supply. As a consequence, there’s demand out there that will not be fulfilled, given the supply chain bottleneck on production time and output. However, because awaiting lists can go up as long as two years, in some cases, the company is able to know exactly how much automobiles it’s going to produce for a specific year. Currently, this year’s production is taking place to fulfil 2017 orders. Nonetheless, industrial sales have a historical CAGR of 10.90% and given the described scenario, it’s expected to maintain the same CAGR for the forecasted period (2018-2022).
Operating Costs
Industrial costs and financial funding for the financial services, represent together, as Cost of Sales, 63% of total operational costs. Subsequently, R&D expenses represent 24% followed by SG&A that account for 13%. For the explicit base period, Cost of Sales was set to approx. 42% of total revenues, which is line with historical figures. An additional adjustment for Italy’s expected inflation was also considered in each year, as Ferrari’s main suppliers are located in there. Followed by an increase in industrial production, cost of sales shall increase at a CAGR of 10.69%. The other operating costs were also adjusted for Italy’s expected inflation and shall increase at a weighted CAGR of 8.95%. In overall terms, total operating costs are set to follow a CAGR of 10.06% (2018-2022).
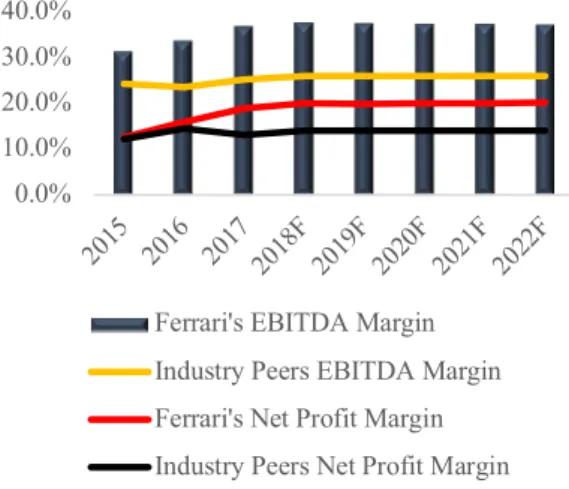
Profitability Margins
Ferrari’s profitability margins are coherent with those practiced in the luxury industry, as well as,
among its peers. Historical figures show average values for Gross, EBITDA and EBIT margins of 67.7%, 33.8% and 23.4%, respectively. In addition, the company tries to mitigate the risk of several foreign currency exchange rates and interest rates through financial hedging given the worldwide exposure of the business. It uses for that purpose both currency and interest rate swaps or futures. The hedging factor is very important has it helps to decrease yearly volatility amongst profitability margins. Moreover, because the brand Ferrari has such an equity and high perceived value, there’s more leeway to stretch margins simply by increasing price premiums on products, a common practice
The result was stronger operating margins for the base period, averaging 66.0%, 37.3% and 27.5% for Gross, EBITDA and EBIT margins.
As production and plant efficiency levels increase to meet demand, both fixed asset turnover and total asset turnover will also suffer a positive upwards shift. The historical average value for fixed asset turnover was 3.81 and by the end of 2022 it’s estimated a value of 5.42. The cash cycle conversion has been negative, and it’s expected to continue that way, as it reflects the continuous firm’s ability off getting paid long before of paying its duties with suppliers.
Debt Management Strategy
Inherent to the incorporation process of Ferrari in the Nederland and consequently spin-off from the FCA group, a considerably amount of debt was raised in 2015, namely: a €2000 million loan, split into a bank syndicated Term Loan of €1500 million and a Bridge Loan of €500 million from FCA. In 2016, the proceeds from the first bond issue, €500 million, were used straight a way to repay the FCA Bridge Loan, as well as, the proceeds from the second bond issue in 2017, €700 million, that were allocated to fully amortize the Term Loan. The company is now free from all the liabilities arisen from its incorporation and separation process, but it’s now liable for the debt that it raised in the fixed income market, that account for approx. 66% of all outstanding debt. As the business has revealed to be very efficient in generating both operating cash flows and free cash flows, in theory,
Ferrari will have no distress managing its debt. In fact, by 2021 forecasts point out that there will be
more than enough cash available to fully reimburse the €700 million of the second bond issue. It’s also expected that by that time net debt will reach negative values, as cash reserves increase.
Currently, the company has a lot more market exposure to equity than to debt and thus is required to respond accordingly, by continuously improving its free cash flows and cash reserves to balance the cost of equity. As the business becomes more liquid, the risk assumed also becomes substantially lower. Leverage-up the company to take advantage of the current low interest rates in the market would only make sense if the marginal effect of having more debt reflects a lower WACC. On the other hand, levered beta equity holders are exposed to CAPM which is also linked to leverage. They are first loss positions and they are exposed to the additional volatility that new debt could create. The scenario among the majority of luxury companies shows that Enterprise Value is often below Equity Value, as net debt is negative. This push firms to deal more with the cost of equity rather than cost of debt, as leverage is residual when compared with cash reserves. Appendix-13;1-2
Robust Return on Invested Capital & Strong Operating Cash Flows
Ferrari’s business has been delivering a very solid return on invested capital, a clear sign of its
strength in relation to operational sustainability and profitability. This metric is extremely important as it gives a glimpse and serves as a proxy to understand how much operational profit is being generated per unit of capital invested in the business via NOPLAT (Net Operating Profit Less Adjusted Taxes). In other words, it measures the aggregated value creation for the shareholders. The higher the spread between ROIC and WACC the greater the value being generated. In 2017 Ferrari archived an impressive ROIC of 24.3% with a WACC of 7.78%, which translates into a spread of 16.52%. In addition, by setting Goodwill aside from invested capital, it’s possible to obtain a value that is not distorted by price premiums paid for acquisitions, and thus ROIC will focus more towards the operating performance of the business. Ferrari’s goodwill adjusted ROIC in 2017 was 33%, which is highly correlated with the strong operating cash flows the company has been able to generate. Forecasts for 2018 point out a ROIC of 22% and an adjusted Goodwill ROIC of 29% alongside with a WACC of 6.54%. -1,500 -1,000 -0,500 0,000 0,500 1,000 1,500 2,000 2,500 2015 2016 20172018F2019F2020F2021F2022F
EBITDA Total Debt Net Debt 0% 20% 40% 60% 80% 100% 0 200 400 600 800 1,000 1,200 1,400 1,600 2016 20172018F2019F2020F2021F2022F Cash Flows from Operating Activities Operating Cash Flow Margin
0% 20% 40% 60% 80% 100% 0 100 200 300 400 500 600 700 800 2017 2018F 2019F 2020F 2021F 2022F FCFF FCFF Margin
Figure 17. Ferrari Vs Peers on EBITDA and Net Profit Margins,
€ millions, 2015-22F
Source: Company Data & Analyst Estimates
Figure 19. FCFF Margin, € millions, 2017-22F
Source: Company Data & Analyst Estimates Source: Company Data & Analyst Estimates
Source: Company Data & Analyst Estimates
Figure 18. Op. Cash Flow margin, € millions, 2016-22F
Figure 20. Total Debt & Net Debt, € millions, 2015-22F
0.0% 10.0% 20.0% 30.0% 40.0% 2015 2016 20172018F 2019F2020F 2021F 2022F Ferrari's EBITDA Margin
Industry Peers EBITDA Margin Ferrari's Net Profit Margin Industry Peers Net Profit Margin
Dividend Policy
The company has been distributing dividends since 2016, and so it’s still on an embryonic phase regarding the ongoing concern of this matter. Nonetheless, the BoD strongly supports the efficient distribution of dividends, despite the absence of a clear dividend distribution policy. An efficient distribution of dividends implies that the future company’s investments and growth are not compromised, at the same time shareholders are fairly compensated. The company’s payout ratio since 2016 has been approx. 22.4%. For 2018, it’s forecasted a payout of 25%, from 2019-2020 a payout of 28% and from 2021 onwards a payout ratio of 28.5% so it’s aligned with the industry average.
Key Investment Risk
Market Risks
Foreign Exchange Rate Risk
Ferrari’s has a worldwide business and for that reason it faces direct foreign country exchange risk.
The company, as an entity, present its accounting numbers in Euros meaning that all cash collected from sales mediated through other currencies must be posteriorly exchanged. In order to mitigate the risk of devaluation of the Euro against other foreign currencies, financial hedging is used through derivative instruments. As consequence, revenues are sensitive to this matter, but as the risk is managed, the degree of that sensitivity is diminished. Historically, the hedging techniques used have been positive for the company. Any positive/negative outcome derived from the hedging process is recognized on the balance sheet under Other Comprehensive Income (OCI) until it’s realized and then recognized on the income statement. As for operational costs, the majority is paid in Euros as the main suppliers are local, as well as, personnel and selling expenses.
13.6% 22.7% 24.3% 22.0% 0.0% 5.0% 10.0% 15.0% 20.0% 25.0% 30.0% 2015 2016 2017 2018F ROIC
Industry Peers Avg.ROIC WACC 0% 25% 50% 75% 100% 0 1000 2000 3000 4000 2015 2016 2017 2018F Revenue NOPLAT Margin
Source: Company Data & Analyst Estimates Source: Company Data & Analyst Estimates
Interest Rate Risk
About 32% of the company’s overall debt is indexed to either USD LIBOR or EURIBOR. So far to this date, Ferrari has been benefiting from the historical low levels of both inter-bank interest rates. However, it’s not expected that they remain in those current levels for long, as baseline fund rates are increasing in order to initiate the process of deleveraging the economy after an economic cycle of expansion, plus there’s also signs of inflation that must be addressed. That’s already occurring in the United States and is a matter of time to reach Europe. The impact on the company is quite relative, as the company is adopting a deleveraging strategy backed by strong operating cash flows.
China and Asian-Pacific Demand
Over the past years, growth in luxury industry has been fuelled by the increasing demand in the Asian-Pacific markets, especially in China. The same is true for Ferrari, as the big source of growth has been coming from those two regions, even though sales by value are not that significant, when compared with North America and Europe. Nonetheless, China as an emerging economy and Japan with its “sloppy” economy could pose a threat in the future organic growth of the business, as the adopted monetary policies by the Central Banks could aim towards the promotion of exports rather than imports, especially luxury goods. As consequence, internal demand would be affected in detriment of a more competitive currency.
Regulatory, Political and Social Risks
Pollutant Emissions and Other Regulations
The company is subject worldwide to increasingly restrict regulatory requirements that directly affect the business, such as: environmental pollution, fuel economy, vehicle safety and noise emission concerns. In order to comply with all these legal laws, regulations and policies Ferrari needs to adjust its production in such a way its cars are fully compliant. That can mean an increase on compliance costs and longer periods to renew product offering, which ultimately can lead to a loss on overall profitability. As already mentioned, the company is fully committed to mitigate these risks, especially fuel economy and CO2 emissions, by progressively introducing hybrid technology in its cars. On that same note, Ferrari’s CEO already declared intentions to introduce a fully-electric supercar in the product line-up, by 2022.
Politically speaking, changes in export/import incentives or tariffs in certain countries may also negatively affect the business. For instance, the U.S.A. is threating to increase tariffs on imported goods from Europe, and China has recently imposed measures indented to limit consumption of luxury goods, including a tax specifically applicable on the purchase of luxury cars.