Roberto Fontana, Diana Moriniello, Andrea Vezzulli
An empirical study of technological
leadership and persistence in product
innovation
WP10/2015/DE/UECE
_________________________________________________________
De pa rtme nt o f Ec o no mic s
W
ORKINGP
APERSAn empirical study of technological leadership
and persistence in product innovation
Roberto Fontana♦, Diana Moriniello♠, Andrea Vezzulli♣
Abstract
We study how technological leadership affects persistence in product innovation. Relying upon a
database of 1818 products marketed between 1990 and 1999 by 265 firms active in three markets of
the Local Area Network (LAN) industry we first construct a measure of technological leadership
and then relate this measure to persistence in innovation. We find that leaders are systematically
more persistent innovators than laggards. We also find that leaders in one market can also
systematically innovate in a related and adjacent market. Finally, we find a positive correlation
between prior patenting activity and persistence in product innovation.
♦ Department of Economics & Management, University of Pavia, Via San Felice 5, 27100, Pavia Italy & CRIOS – Bocconi
University, Via Sarfatti 25, 20139, Milano, Italy. [email protected]
♠CRIOS – Bocconi University, Via Sarfatti 25, 20139, Milano, Italy. [email protected]
1. Introduction
What determines persistence in innovative behaviour? Do technological leaders differ from
laggards in terms of persistence? When are technological leaders in one market able to become
persistent innovators in a related market? These issues have been on the agenda of researchers on
economics, and innovation for quite some time. Early works have highlighted that prior innovative
activity alone is a good predictor for the length of the innovative spell and that it tends to explain
spell length better than other firms’ characteristics such as size (Geroski et al., 1997). ‘Bimodality’
exists in the pattern of persistence suggesting that persistence is stronger for firms that are either
non innovators or great innovators (Cefis and Orsenigo, 2001). Finally, persistence in innovation is
higher in sectors characterised by technological cumulativeness, R&D complementarities and
learning-by-doing processes (Cefis, 2003). A common feature of these early studies is that they
measure innovation persistence in terms of patenting activity.
Alongside patents, new product introduction is another important indicator of innovation and
several studies have analysed instances of product introduction. Khanna (1995) looks at new
product introduction in mainframe computing. Greenstein and Wade (1998) and Stavins (1995)
look at the probability of product entry and exit for computer mainframes and PCs respectively.
De Figuereido and Kyle (2006) analyse the determinants of product turnover in the laser print
market industry. Lerner (1997) and Thomas (1999) study new product introduction in the context
of a ‘technological race’ in the Hard Disk Drive industry. Though these studies analyse the
determinants of the incidence of new product introduction, they do not look explicitly at the issue
of persistence in product innovation (i.e. whether innovators at period t more likely to innovate at the
next time period). In addition, these papers do not look at the relationship between technological
leadership and persistence in product innovation.
There are several reasons why it is relevant to study the relationship between technological
technological leadership may or may not reinforce market leadership depending on the market
structure and the presence of economic incentives to innovate. From a management strategy
viewpoint, in markets characterised by rapid technical change and shortening of product life cycle,
new products incorporate novel characteristics making existing products only an imperfect
substitute for the new good. Within this context, persistence in product innovation may originate
from incumbents’ strategies aimed at maintaining their transitory market power. These strategies
may entail an expansion of the technological frontier, changes in product portfolio through
product proliferation, and extension of product portfolios through innovation in related markets.
Differences between technological leaders and laggards in terms of available resources, capabilities
and complementary assets will translate into differences in persistence in product innovation.
We examine the relationship between technological leadership and persistence in product
innovation in the context of the Local Area Networking (LAN) industry. Our source of information
is a comprehensive database of 1818 new products marketed between 1990 and 1999 in three LAN
markets: hubs (536 products), routers (747 Products), and switches (535 products). For each
product in our dataset we have information on: year of market introduction, technical
characteristics, market price, and name of the manufacturer. Our dataset includes 265 firms which
have been active in the industry. For each firm in the dataset we have collected information about
date of entry into the industry, size in terms of employees, and sales when available. In addition to
these data we also collected information on the patenting activity of the firms included in our
sample. In particular, by looking at the (8 digits) International Patent Classification (IPC) class of
the patents we have been able to link patents to innovative activity in a specific market.
Using these data we carry out the following analyses. First, we employ data on product
characteristics and price to calculate an indicator of technological leadership in each market. Here
we proceed in two steps. For each market, hedonic price regressions are estimated and predicted
and calculate the relative distance of each firm from the frontier. Second, we use this indicator to
distinguish between technological leaders and laggards and produce Transition Probability
Matrices (TPMs) to study persistence in product innovation for both types of firms. Third, we
perform Conditional Risk Set Duration analysis to study the determinants of the probability to
innovate in each period conditional on firms’ initial innovative status and technological leadership
in the prior period. Our covariates include an indicator of technological leadership, as well a series
of firm level controls such as firm size, age, market structure, and possession of intangible capital
in terms of patent stock. Particular attention is devoted to estimating cross market effects (i.e. to
study the impact of technological leadership in one market on persistence in another market) for
multi product firms.
Our main result is that technological leaders are relatively more persistent innovators than
laggards. The closer a firm is to the technological frontier at t the higher the probability to
commercialise a new product in the next time period, though the marginal effect of changes in
distance from the frontier varies across markets reflecting different levels of technological
opportunities. We also find that technological leaders in one market can also systematically
innovate in a related and adjacent market. Additional results highlight a direct relationship between
persistence in product innovation and (lagged) patenting and between the number of (lagged)
patents and persistence in product innovation.
Our findings provide the following contributions. First, they provide novel evidence on the
determinants of innovation persistence. Prior empirical research on innovation persistence has
mainly relied on patents as an indicator of innovative activity. We provide empirical evidence on
persistence in product innovation. Second, we directly relate persistence to an indicator of
technological leadership at the firm level. Prior empirical studies have instead focussed on other
firm characteristics such as size, age, and/or R&D intensity. Third, we consider the case of firms
Some of our findings are consistent the existing empirical literature on the role played by
technological leaders in stretching the technological frontier in ‘technological races’. Other findings
are consistent with prior research on persistence based on patents such as those confirming the
presence of bimodality in persistence. Additional findings, that relate persistence in product
innovation to the stock of patents, qualify the prior evidence highlighting that is the stock of
intangible assets rather than lagged patenting what matters for innovation persistence. Finally, our
findings for the case of related markets allow us to draw some indirect inference about persistence
and firms’ strategies for changes and extension of their product portfolios. While both
technological leaders and laggards could in principle extend their product portfolio to include
related products, only technological leaders can effectively do it in the case of complex products.
Laggards instead have to innovate at the lower end of the product spectrum.
The paper is structured as follows. In Section 2 we review the literature on persistence in
innovation and propose our framework for analysis. Section 3 introduces some necessary
background information on the LAN industry. Section 4 presents our data and method. Section 5
introduces our empirical strategy. Results are presented in Section 6. Section 7 concludes.
2. Conceptual framework
One of the earliest discussions in the industrial organization and innovation literature has
revolved around the relationship between innovation and market structure. While there is a
general agreement that innovation is a source of monopolistic rents and therefore market power,
less consensus exists on the relationship between market power and persistence in innovation. Two
opposite views exist depending on the assumptions made on the incentives for incumbents to
On the one hand, there is the view that incumbents with high market power have low incentive to
continuously engage in innovation (Arrow, 1962) both because of the nature of the knowledge,
which is assumed to be equally accessible to all firms, and because they are afraid of cannibalising
their current source of revenues (Reinganum, 1983; 1985). Because of this ‘replacement effect’ their
market power is temporary as their dominant position is quickly challenged and eroded by
competitors. New innovators, which are typically small, and newly established firms,
systematically substitute for incumbents.
On the other hand, there is the view that considers persistence in innovation as crucial for
maintaining market power. In this case incumbents have an incentive to continuously engage in
innovation to maintain their dominant position (‘efficiency effect’) either because there are
increasing returns to R&D or because they spend more in innovation (Scherer, 1965), or because
the return to leaders of innovating and maintaining monopoly rents out-weight the replacement
effect (Gilbert and Newbery, 1982).
Prior empirical studies on innovation persistence have produced a series of ‘stylized facts’. First,
production of innovations is subject to little dynamic economies of scale (the
‘success-breeds-success’ paradigm) as the effect becomes apparent only after a ‘minimum innovation threshold’ is
reached (Geroski et al., 1997). The threshold level of patents likely to induce a patenting spell of 3
or more years is around 5 patents. A firm that produces 5 or more patents has roughly twice the
probability of enjoying a patenting spell of any length greater than 3 years than a firm that
produces only 4 patents.1 Second, there is bimodality in the pattern of innovation persistence (Cefis
and Orsenigo, 2001). In particular, persistence is stronger for firms that are either non innovators
or great innovators (i.e. having 6 or more patents in a year). This means that most firms innovate
only occasionally or do not innovate at all. Yet innovative activities are to a significant extent
generated by few firms that innovate persistently over time. Institutions and history do influence
differ across countries. Third, persistence in innovation is related to the characteristics of the
technology (Cefis, 2003) as it is higher in sectors characterised by technological cumulativeness,
R&D complementarities and learning-by-doing processes.
A common feature of these studies is that they measure persistence in terms of patenting activity.2
In contrast with this focus on patents as an indicator of innovation we consider the case of product
innovation. In differentiated, fast changing technology markets, such as the LAN industry studied
in this paper, product innovation is a paramount source of market power for incumbents who
compete by incorporating in products novel features which make existing products only an
imperfect substitute for the new good (Bresnahan et al., 1997).3 This paper moves the focus beyond
the perfect/ imperfect substitutability distinction. In our setting, incentives to persist in product
innovation depend on the extent of technological leadership measured in terms of proximity to the
technological frontier. We expect to observe differences in persistence between technological
leaders and laggards for several reasons.
First, technological leaders operate very close to the technological frontier. Though for them the
marginal benefits from commercialising ‘yet another product’ may be decreasing, leaders are
better placed to grasp new technological opportunities by extending the frontier, provided they
have the resources and the convenience to do that.4 Greenstein and Wade (1998) look at the
product life cycle in the commercial mainframe market. They find that ‘stretching’ the
technological frontier leads to more frequent (i.e. persistence in) product introduction in a specific
product class. In a study of new production introduction in high-end mainframe computing
Khanna (1995) provides evidence that designers engage in ‘racing behaviours’ when they compete
at the frontier. On the contrary technological laggards are not able to extend the frontier and they
have fewer incentives to participate in the technological race. Product innovation in this case
would largely consist in imitation of existing products (Lee et al., 2011) or be restricted to
expect to find that the closer a firms is to the technological frontier, the more likely it is to persist in
product innovation.
Scholars of innovation strategy have also looked at persistence in product innovation. This
literature has mainly explained persistence in terms of the characteristics of technology as well as
in terms of firms' absorptive capacity (Cohen and Levinthal, 1990). If technology has a strong tacit
component and is highly specific to individual firms (Penrose, 1959; Nelson and Winter, 1982) then
innovation results from the accumulation of technological competencies by heterogeneous actors.
Over time the firm specific, tacit and cumulative nature of the knowledge-base builds high barriers
to entry. As a result, a few and large firms eventually continue to dominate the market in a stable
oligopoly.
According to this approach, instead of emerging from a ‘technological race’, persistence in product
innovation may also be the consequence of product differentiation strategies linked to either
growth in the product portfolio or to an extension of product portfolio. Growth in the product portfolio
occurs when firms introduce many products in the same market. On the one hand there are
product proliferation strategies when incumbents enter into unexplored areas of the same market
mainly to cater for existing needs and/or to pre-empt competitive entry from potential
competitors (Schmalensee, 1978). On the other hand, new products are rarely introduced alone in
the market as firms choose instead to compete on the basis of product families (Draganska and
Jain, 2005). Introducing product families allows incumbents to offer different variants of the same
product in order to cater for different customer preferences. In her study of PC industry, Stavins
(1995) relates pre-emption to incumbent’s experience as she shows that incumbents disperse more
their products in the quality spectrum by exploiting advantages in terms of both reputation and
economies of scope. Looking at product turnover in the desktop laser printer industry de
Figuereido and Kyle (2006) find a positive correlation between the frequency of new product
Incidence of entry is even higher for firms that are both innovative and have a strong brand.
Sanderson and Usumeri (1995) show how leaders can rely upon their superior design capabilities
and division of labour to change product characteristics and tailor them to specific needs. Thus, we
expect that the closer a firm is to the technological frontier in a specific market, the more likely is to
persist in product innovation in the same market.
Extension of product portfolio occurs instead when firms decide to enter into related markets
(Raubitschek, 1987; Bayus and Putsis, 1999).6 In this case, persistence may be beneficial for
technological leaders that possess the resources to spread the risk of innovating over several
markets (Bonanno, 1987; Bhatt, 1987). However, important limitations to portfolio expansion exist.
Dowell (2006) finds that wide product portfolios can be detrimental to firms’ performance when
they include products with very different designs. Similarly, Wezel and van Witteloostuijn (2006)
show that benefits from product portfolio extension are inversely related to the technological
distance between the existing and the new products inside the portfolio. These findings highlight
that firms’ benefits from portfolio extension may depend on whether changes in new products
entails incremental or improvements or radical departures from their existing designs. Within this
context, radical departures from an existing design will be less likely pursued because of lack of
organizational capabilities (Henderson, 1993), excessive myopia (Tripsas and Gavetti, 2000), strong
commitment to an existing customer base (Christensen, 1997) and/or high level of product
complexity (Levinthal, 1997).7 While technological leaders possess the required capabilities to
persist in product innovation in their own focal market, they can be expected to enjoy a relative
advantage over competitors as long as innovating in the related market does not entail a radical
departure from the product design in their focal market. We thus expect to find that, in the case of
related markets, the closer a firm is to the technological frontier in a specific market, the more
likely it to persist in product innovation in an adjacent market.
3. Background on the industry
In this paper we study persistence in product innovation for a sample of manufacturers active in
the LAN industry between 1990 and 1999. LANs are the infrastructure that enables data
communication to occur within localised areas (i.e. a company and/or a university campus). LANs
are systems made of technologically related components which play different functions within the
network and embody technologies of different level of complexity.8 Hubs were relatively
unsophisticated products whose function was mainly to link computers together. Routers were the
most complex from the technological viewpoint as they were able to determine the best path for
sending the data. Switches were more complex than hubs but (at least initially) less than routers.
During the 1990s additional features (i.e. Layer 3 functionality, and Virtual LAN support), as well
as a combination of hardware and software based changes (i.e. the adoption of ASICs based
architecture and the implementation of new algorithms for forwarding data packets), enabled
switches to directly compete with routers. Thus if we had to ‘rank’ LAN equipment available
during the 1990s in terms of technological complexity we would have hubs at the bottom, switches
somewhat in the middle, and routers at the top.
Early LANs were adopted in organizations such as firms and universities during the 1970s. At that
time they were closed systems based on proprietary communication standards (i.e. DECnet, SNA)
and using computer mainframe and/or minicomputers. Their diffusion took off during the 1980s
thanks to the definition of common transmission standards (i.e. Ethernet and Token Ring), the
advent of Personal Computers, and innovation in hubs and routers (von Burg, 2001). They
diffused widely during the 1990s thanks to new high speed standards (i.e. Fast Ethernet, FDDI,
Gigabit Ethernet), the wide adoption of the internet protocol (i.e. TCP/IP) and the introduction of
LAN switches (Fontana, 2008).
While the overall structure of the LAN industry would eventually consolidate and evolve toward a
market was polarised with few leader firms dominating the high-end of the market and
responsible for innovations along the established trajectory and several firms at the ‘fringe’
producing only relatively unsophisticated products (i.e. ‘scaled down’ versions) for low-end
customers. The router market was also highly concentrated with few firms dominating. Entry was
virtually blockaded at the high-end (i.e. the so called multi-protocol router segment) and occurred
mainly at the low-end (i.e. the access router segment). During the 1990s, the LAN switch market
was in its infancy and characterised instead by lower entry barriers and an intense entrepreneurial
activity with new solutions marketed by young start-ups as well as by established firms already
active in the other two markets.
There are at least two reasons why this industry between 1990 and 1999 represents an interesting
case to study persistence in product innovation. First, there is the very fast rate of technical change
and the shortening of the product life cycle. New equipment embodied new characteristics, both in
the form of new communication standards, new hardware, and/or software. Persistence
ultimately depended on the capability of incumbents to move forward the technological frontier
and/or grow and extend their product portfolio.
Second, manufacturers had a strong incentive to entry into related markets. Being part of a
technical system, hubs, switches and routers might or not be produced by the same manufacturer.
From the customer viewpoint, combining products from the same producer increased utility as
benefits from interoperability and standardisation could be reaped. From the viewpoint of the
manufacturers, expansion into related markets could enlarge the installed base and strengthen
their market position (Chen and Forman, 2006). In this case, persistence was a consequence of the
4. Data and method
Our source of information is a comprehensive database of new products marketed between 1990
and 1999 in the LAN industry. The dataset contains 1818 products commercialised in three
markets: hubs (536 products), routers (747 Products), and switches (535 products). For each
product in our dataset we have information on: year of market introduction, technical
characteristics, market price, and name of the manufacturer. This dataset was constructed using
information from specialized trade journals (Network World and Data Communications), which
periodically published Buyers’ Guides and details on new product introductions. Our dataset
includes 265 firms which have been active in the industry. These firms represent the population of
the firms that introduced at least one new product in the LAN industry between 1990 and 1999.
Most of the firms in the dataset were located in US and, though they operated globally, most of
their sales were generated in the US in the period considered in this paper. For each firm in the
dataset we have collected information about their entry date in the industry, size in terms of
employees, and sales when available. This information was gathered from a variety of sources,
such as COMPUSTAT, the D&B Million Dollar Database and firms’ annual reports. 174(65% of the
total) firms in our sample were active in just one market. 67(25%) in two markets. 25(9%) in three
markets. 15 firms were active in both hubs and routers. 24 were active in both routers and
switches. 28 were active in both hubs and switches. 121 have introduced at least one hub, 136 at
least one router, 126 at least one switch. In addition to these data we also collected information on
the patenting activity of the firms included in our sample. This information was retrieved from the
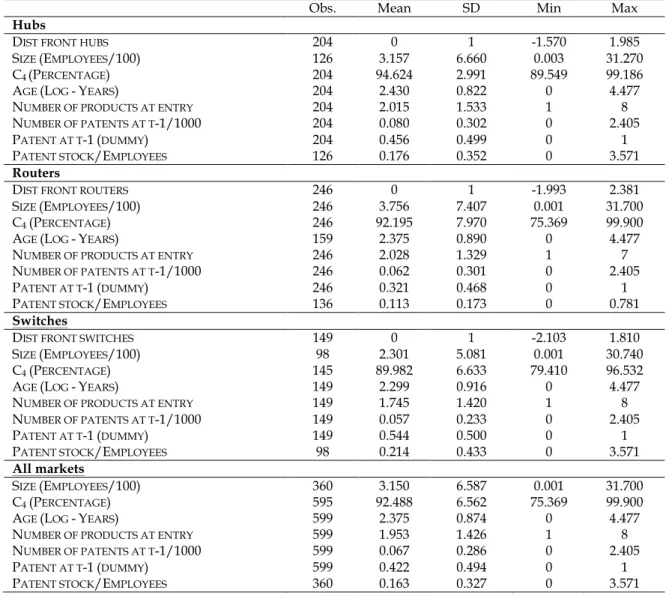
latest version of the NBER patent database (Hall et al., 2001). Table 1 reports overall summary
statistics and broken down by market.
5. Empirical strategy
5.1. Empirical model
Econometric studies of innovation persistence falls within two groups. One group of studies relies
upon the estimation of hazard models for innovation spells (Geroski et al., 1997). Another group of
studies (Peters, 2009; Clausen et al., 2010) has instead employed random effect probit models
(Wooldridge, 2005) to estimate the effect of previous innovative efforts on the probability to
further innovate at a specific point in time. In this paper we follow the former approach.
In particular, we model product innovation by the firms in our sample as a repeated event and
assume that after the first product introduction event is observed, the second and the following
introductions are different from the first event. The implicit assumption that we are making is that,
all the rest being equal, the more innovative events we observe for a firm the more likely is for that
firm to experiment again the event in the future. Within this context, not taking event dependency
into account would lead to incorrect estimates of the likelihood to innovate over time. Since we are
considering a sample of firms that introduced at least one new product between 1990 and 1999, our
sample is both right and left censored. It is right censored because we observe new products’
introduction only up to the end of 1999. It is left censored because firms enter the study at different
points in time corresponding to the year in which we observe their second product innovation
event.9
Our analysis of time to product introduction event employs variance-corrected semi-parametric
Cox’s Proportional Hazard (CPH) model. A variance corrected CPH model allows to control for
the effects of repeated and interdependent events on the variance-covariance matrix in order to
produce robust coefficients and standard errors. The approach we follow here is the conditional
risk-set model proposed by Prentice et al. (1981).10 According to this model, at each time t we can
define a risk set for observing a product innovation event k by considering all the firms that, at
cannot be at risk of innovating for the fourth time without having already innovated three times
before. This approach takes into account the order of the events and estimates are stratified by the
rank of the event (i.e. the second product, the third product etc.).
Let’s define with Tik the ‘true’ total time taken for firm ith to experience the kth product introduction
event. Cik is the censoring time for the kth product introduction event and Xik is the observed
duration (with Xik = min(Tik , Cik)). Finally, we define δik = I(Tik ≤ Cik), where I(.) indicates whether
censoring occurs or not and we define inter-event times as: Gik = Xik - Xi,k-1. Xi0 = 0 is the time when
the firm enters the study (i.e. the time of first product introduction).
The hazard function for the kth product introduction for firm ith at time t is given by:
(
t
Z
)
h
(
t
t
)
(
Z
( )
t
)
h
ik ik k k ' ik1
0
exp
;
=
−
−β
(1),where Zik is the vector of explanatory variables for firm ith with respect to the kth product
introduction. h0k(t) is the event specific baseline hazard for the kth product introduction. β’ is the
vector of parameters to be estimated.
Let tj be the jth ordered event time and R(ti) the set of firms at risk at time ti , the partial likelihood L
can be defined as:
( )
( )
( )
( )∏ ∑
= ∈=
d
j k Rt k j
j
t h t h L
1
β (2),
( )
(
(
)
)
(
)
(
(
)
)
∏∏
∑
= = = # # # # # $ % & & & & & ' ( = n i K k n j ik jk ik jk ik ik ik X Z X Y X Z L 1 1 1 ' exp ' exp δ β ββ (3),
where Yjk(t) = I(Gik > t).
5.2. The model specification
The equation introduced above is specified with several covariates. The first, and most important
covariate, is a measure of technological leadership. Three types of indicators of leadership can be
found in the literature. Indicators based on labour (Amable et al., 2007) or multifactor productivity
(Nicoletti and Scarpetta, 2003; Bos et al., 2013); indicators based on financial assets such as Tobin’s q
(Coad, 2011); indicators based on product characteristics and quality (Stavins, 1995). According to
this approach product quality may be used to ‘rank’ firms in terms of distance to the technological
frontier. Technological leaders can be distinguished from laggards and their behaviour in terms of
persistence analysed.
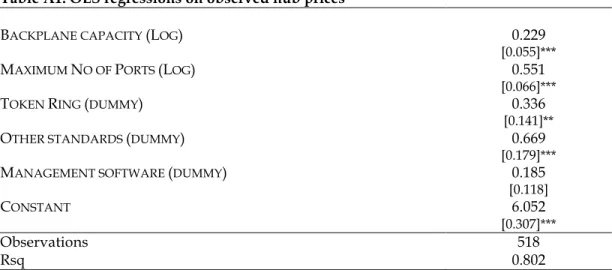
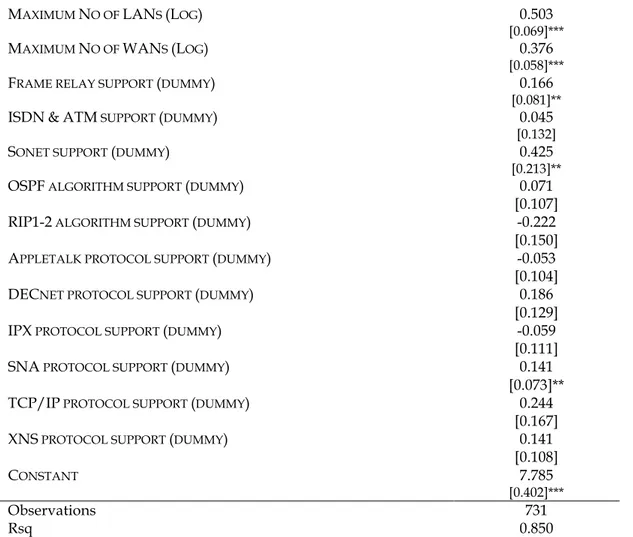
To construct our measure we follow Fontana and Nesta (2009) and proceed in two steps. First, for
each market, hedonic price regressions are estimated and predicted prices are calculated. Second,
predicted prices are used to compute a measure of technological frontier and calculate the relative
distance of each firm from the frontier. In the first step, we estimate the following hedonic
equation (one separate regression for each market):
∑∑
+ + + + = t j mit i t tjm tj mit zp α β α µ ε (4),
where pmit is the price of model m introduced by firm i at time t, ztjm is a vector of product
is a time fixed effect, and µi is a firm fixed effect capturing the impact on the price of firms’ pricing
practices unrelated to product characteristics such as reputation, market power and/or other
unobserved characteristics.11
In the second step we take the quality adjusted predicted price as an indicator of overall product
quality and use it to rank products on ‘vertical’ product space:
' '
ˆmit mit p
q = (5),
we then compute for each product a distance from the technological frontier:
( )
'max
mit t f
mit q q
d = − (6).
The higher is this distance the farther is the product from the frontier. Since firms may introduce in
several products in each market in a given year, we calculate for each firm the minimum distance
to technological frontier as follows:
[ ]
it f mit fit d
d =min (7).
This indicator is our main measure of technological leadership (DISTANCE TO FRONTIER).
Technological leaders (laggards) in a specific market would display relatively lower (higher)
values for this indicator. As the indicator is normalised by dividing it by its standard deviation, the
distance varies between zero and one. This standardization allows us to perform meaningful cross-
Beside distance to frontier, we consider other control variables that are likely to affect persistence
in product innovation. All these variables capture firms’ characteristics and are, all but two,
time-varying. The variable SIZE is constructed on the basis of the number of full time employees. The
existing literature has generally highlighted the presence of a positive relationship between firms’
size and persistence in innovation (Cohen and Levin, 1989; Kamien and Schwartz, 1982).12
However, in some case a non linear trend has been found. To take this into account we include also
the square of size (SIZE SQ). To capture market structure we use an index of market concentration
(C4) defined as the sum of the market shares (in percentage) of the four largest companies (in terms
of total turnover) in each market and for each year. Turnover is measured in million of US dollars.
We control for the impact of knowledge and intangible assets on persistence in innovation by
relying upon some indicators of firms’ patenting activity. PATENT STOCK/EMPLOYEES is the sum of
the past patents granted to the firm in each year. It is an indicator of the stock of technological
experience available to firms.13 Generally, past technological experience should impact positively
on innovative activity through economies of scale in R&D (Cohen and Levin, 1989), learning by
doing and/or by using (Rosenberg, 1982; Cohen and Klepper, 1996). However, we may expect this
impact to vary also depending on the level of technological opportunity available to the firms.
Firms maybe expected to make the most(least) out of technological experience when technological
opportunities are the highest(lowest). As the accumulated measure of patents tends to be
correlated to the size of the firm, we divide patent stock by the number of employees to make sure
that our measure can be interpreted as an indicator of the pool of technology assets available to the
firm.
Alongside this variable we introduce two variables aimed at accounting for recent patenting
activity. PATENT (T-1) is a dummy which is equal to one is the firm has filed for a patent in the
previous year. This variable is supposed to capture the relationship between patenting activity and
accounting for the number of patents filed by the firm in the previous year (NUMBER OF PATENTS
(T-1)). Though a one to one relationship between a single patent and a product is impossible to
establish, we expect persistence in product innovation to be positively associated to patenting.14
Finally, we control for the ‘initial condition’ by including a variable measuring the number of new
product at entry (NUMBER OF PRODUCT AT ENTRY).
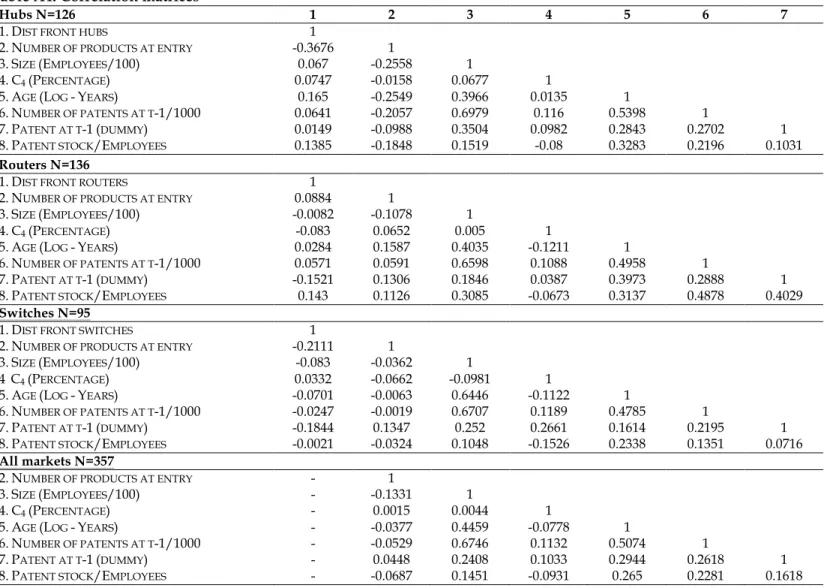
A correlation table for our covariates is reported in the Appendix (Table A4).
[Insert Table A4 about here]
It should be noted the presence of a positive correlation among our patent based indicators. The
level of the coefficients is sometimes high but within an acceptable range.15
6. Results
6.1. Univariate analysis
We provide preliminary evidence on technological leadership and persistence in product
innovation by estimating two states TPMs for several sub-samples of our sample of innovative
firms. Cefis (2003) defines persistence in terms of the probability for a firm to remain in the same
state it was in period t at the subsequent period t+1. We are particularly interested in ‘persistent
innovators’ (i.e. firms that persistently remain in the innovator state).
Table 2 reports our preliminary results for each of the three markets.
[Insert Table 2 about here]
In the case of hubs, the probability of being a persistent product innovator is around 44%, it
‘systematic’ innovators are more likely to be found in the case of more complex products. New
entry in innovative behaviour is the highest in switches (around 37%) followed by routers (24%)
and it is the lowest in hubs (22%). I the light of what we said in Section 3, this latter pattern clearly
reflects changes in market opportunities in the LAN industry during the 1990s with the opening
up of the switch market and the decline of hubs. In Table 3 we distinguish between technological
leaders and laggards.
[Insert Table 3 about here]
A first look at the results suggests that leaders are always more likely to be ‘systematic’ innovators
than laggards. I this case, probabilities seem to reflect the level of product complexity with leaders
displaying the highest persistence in innovation in the case of routers (63%), followed by switches
(52%), and hubs (49%). It is interesting to note that laggards in complex products seem to be more
persistent than laggards in less complex products. However, the difference between persistent
leaders and laggards is slightly higher for complex products (10% in the case of routers vs. 9% in
the case of switches and hubs). Laggards are also less likely than leaders to go from a non
innovative to an innovative status. The difference is particularly large in the case of switches (44%
vs. 33%) suggesting that there might have been new opportunities to innovate in this growing
market, however only technological leaders seemed able to capture them. The following section
presents our results for the multivariate analysis.
6.2. Multivariate analysis
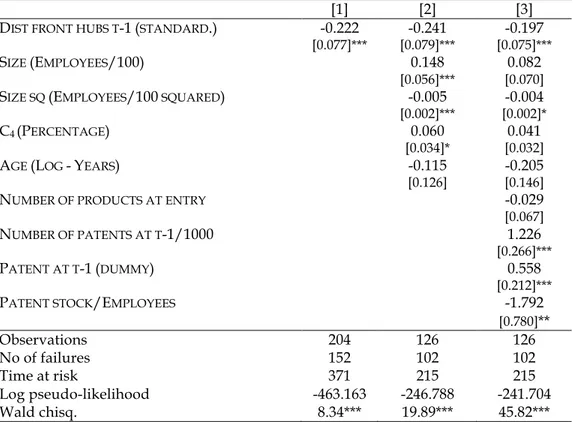
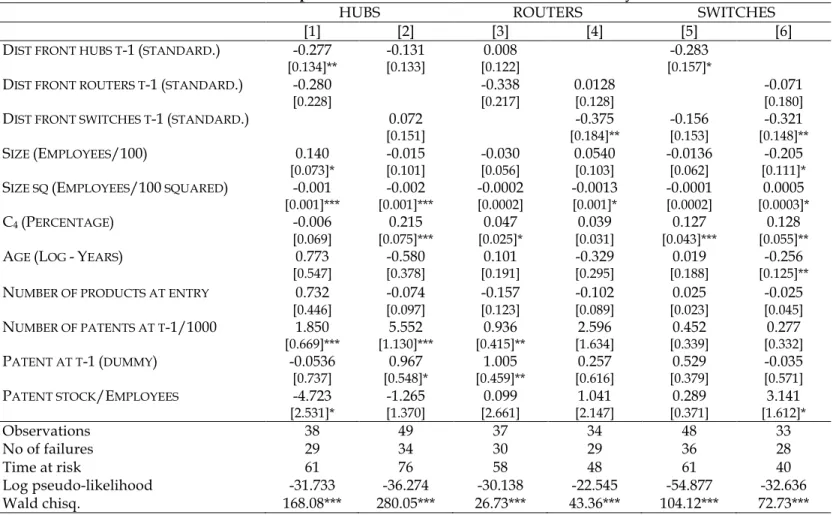
Table 4 reports the results of the Cox conditional risk set estimates for persistence in innovation in
the hub market. Explanatory variables are introduced in sequence.
Model (1) considers the effect on persistence of distance to frontier only. The coefficient is negative
and significant suggesting that firms located closer to the technological frontier at time t have a
higher likelihood to introduce a new product in the following period. In other words, leaders are
relatively more persistent innovators than laggards. The sign is robust to the inclusion of
additional explanatory variables. One unit decrease in the distance to frontier increases the
likelihood to innovate of about 19.7%.16 In model (2) we control for the impact of firm size, market
concentration, and age on persistence. The inclusion of these variables decreases the number of
observation to 126 due to missing information. Consistently with previous findings (Geroski et al.,
1997) our results suggest that large firms are more likely to innovate though the relationship seems
to be non linear as indicated by the negative coefficient of SIZE SQ. Each additional employee
increases the likelihood to innovate on average by 9.5%. The coefficient of C4 is positive and
weakly significant. This evidence suggests that the degree of market concentration positively
affects innovation persistence. The coefficient of AGE is not significant. In the final specification
(model 3) we include our indicators of intangible capital based on patents. We first control for the
presence of ‘state dependence’ by looking at whether product innovation at t is associated to the
patenting decision (PATENT) and to the number of patents (NUMBER OF PATENTS) at t-1. In both
cases the coefficients are positive and significant. Finally, we further control for the intensity of
firm’s innovation cumulativeness by dividing the overall stock of patents by the number of
employees (PATENT STOCK/EMPLOYEES). Altogether, these results indicate the presence of a ‘state
dependence effect’ in which product innovation in one period is positively associated to both
patenting and the number patents filed in the previous period. These effects notwithstanding, the
relationship between possession of intangible capital and product innovation is not
straightforward given that the coefficient for innovation propensity, as captured by the stock of
patents per employees, is negative and significant.
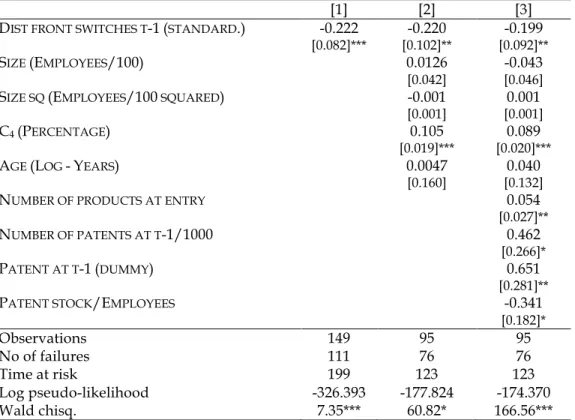
[Insert Table 5 about here]
The coefficient for distance to frontier is negative and significant suggesting that the farther firms
locate from the technological frontier the lower is the likelihood of introducing a new product in
the subsequent year. Again technological leadership seems positively associated to persistence in
innovation and in this case the magnitude of the impact is greater than in the case of hubs. In
particular a one unit decrease in the distance to frontier increases the likelihood to innovate of
about 20% suggesting that in the switch market being leaders is crucial for continuing to innovate.
Concerning our control variables, we do not find a significant effect of firm size and age but our
control for market concentration (C4) has a positive and significant coefficient. All our patent
indicators are instead significant. In particular, we find evidence of state dependence as suggested
by the positive and significant coefficient for the lagged patent dummy. Also, the likelihood of
introducing a product innovation increases with the number of patents filed at t-1.
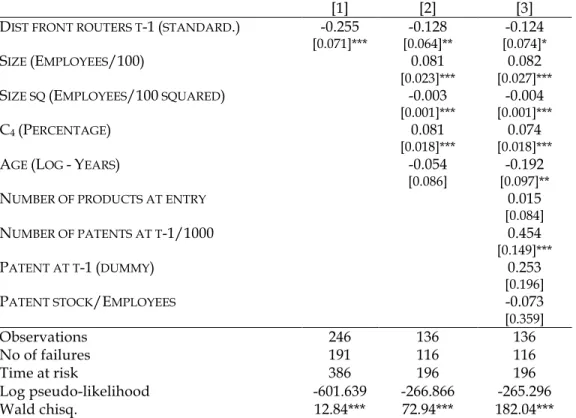
Results for the router market are summarised in Table 6.
[Insert Table 6 about here]
As in the previous cases, the coefficient estimate for distance to frontier is negative and significant
indicating that technological leadership seems to positively affect persistence in product
innovation. In this case the effect of leadership is smaller than in the case of hubs and switches as a
one unit decrease in the distance to frontier increases the likelihood to innovate of 12.4%. The
coefficient is quite stable across specification though the significance level changes as additional
variables are added. The coefficient of AGE is now negative and significant indicating that in this
market young firms are relatively more innovative than older ones. Also, our control for market
concentration (C4) has a positive and significant coefficient. Finally, as in the previous cases, the
We turn now to the analysis of leadership and innovation in related markets.
6.3. Leadership and persistence in innovation in related markets
As discussed in Section 3, hubs, switches, and routers are component of technological systems and
may or may not be manufactured by the same firm. In this context it is interesting to understand
whether technological leadership in a focal market could lead to persistence in a related market for
those firms active in more than one market. We explore this possibility in Table 7 which reports a
series of conditional risk set Cox models for firms active at least in two markets.17
[Insert Table 7 about here]
Model (1) considers the likelihood of introducing a new hub for those firms manufacturing both
hubs and routers. The coefficient for distance to frontier is negative and significant confirming that
technological leadership in the hub market increases the likelihood to innovate in hubs. The
coefficient for distance to frontier in the router market, though negative, is not significant an
indication that leadership in this related market is not associated to persistence in product
innovation in hubs. Model (2) analyses the effect on the likelihood of persisting in innovation in
hubs of leadership in the switch market. In this case leadership in switches is not associated to
persistence in the hub market.
Given that routers and switches are more complex products than hubs
represent the two ‘extremes’ of complexity in the LAN product spectrum (i.e. they are not adjacent
markets) this result is somewhat expected .
In Model (3) we look at persistence in routers for routers and hubs producers. The coefficient
concerning the relatively ‘un-relatedness’ of the two markets. Model (4) relates persistence in
routers to technological leadership in the switch market. The negative and significant coefficient
for distance to frontier in the switch market indicates that leadership in switches positively affects
persistence in innovation in routers. A one unit decrease in the distance to frontier in the switch
market increases the likelihood to innovate in routers of 27.9%. This evidence suggests that switch
leaders could persistently innovate in the router market.
Finally, we look at how leadership in related markets affects persistence in innovation in switches.
Model (5) considers the case of leadership in hubs. The coefficient estimate for distance to frontier
in hubs is negative and significant indicating that leadership in the hub market is positively
associated to persistence in switches. Since hubs and switches are adjacent markets, we find again
that the closer a firm is to the technological frontier in a specific market (hubs in this case), the
more likely is to persist in product innovation in an adjacent market (switches). In this case, a one
unit decrease in the distance to frontier in the hub market increases the likelihood to innovate in
switches of 36.5%. Leadership in routers instead does not seem to affect persistence in switches
(Model (6)).
To summarise, our findings generally show a positive correlation between technological
leadership in a specific market and persistence in innovation in a related market. However, this
correlation is found only in the case of leaders entering in more adjacent and more complex
markets (i.e. hub leaders in switches and switch leaders in routers). If we compare product
innovation activity in the LAN industry to ‘climbing a ladder’ with more complex products (i.e.
routers) on top and less complex (i.e. hubs) at the bottom, our findings indicate that technological
leaders could move up to the next step of the ladder (i.e. innovate in more complex products) but
not ‘leap’ straight to the top. In addition to this, leaders generally did ‘descend‘ the ladder (i.e.
innovate in less complex products). Technological laggards instead could neither reach higher
7. Sensitivity analysis
Though interesting, it may be argued that our results suffer from important limitations. The first
limitation concerns the presence of reverse causality. Our main argument is based on the idea that
technological leadership leads to product innovation. However, in the industrial organization
literature it is often argued that incumbents innovate in order to deter market entry or catching up
by followers. If this is true, then technology leadership would follow persistence. To account for
this possibility is particularly important in our setting given that our period of observation is, for
all but one of the markets, two-sided censored. The second limitation is that the analysis may
suffer from an omitted variable bias. Due to information availability constraints in our analysis we
are not controlling for any R&D input measures. If one assumes that R&D spending and product
innovation are positively related and that persistent innovators spend continuously more on R&D,
then it may be argued that our results follows from the fact that R&D spending correlates both
with persistence in innovation and technological leadership.
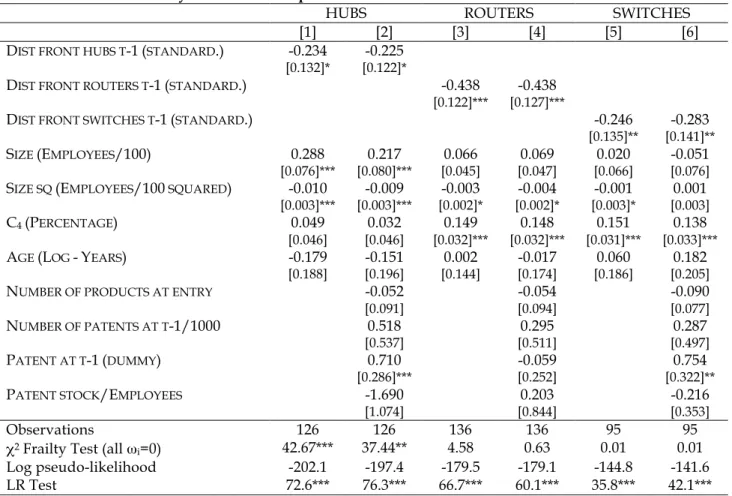
In order to tackle these two limitations, in this section we generalize the CPHM introduced in
Section 5 by adding an individual time-invariant frailty term (ωi) to the hazard function (1). The
purpose of this generalization is to separate the persistence effect driven by true event dependence
form the spurious one caused by time-invariant unobserved heterogeneity across individuals. We
adopt the specification of the Conditional Frailty Cox (CFC) model proposed by Box-Steffensmeier
and De Boef (2007)18 by generalizing the hazard and partial likelihood functions (1) and (3) as
follows:
h
ik
(
t
;
Z
ik)
=
h
0k(
t
−
t
k−1)
exp
β
'Z
ik
( )
t
+
ω
iL
( )
β
=
exp
(
β
'
Z
ik(
X
ik)
+
ω
i)
Y
jk(
X
ik)
exp
(
β
'
Z
jk(
X
ik)
+
ω
i)
j=1 n
∑
"
#
$
$
$
$$
%
&
'
'
'
''
δikk=1 K
∏
i=1n
∏
(9)Maximization of (9) is performed using the Expectation-Maximization (E-M) algorithm and
assuming a gamma distribution for ωi and treating them as missing data. Controlling for
unobserved heterogeneity allows us to partially solve the ‘initial condition’ problem for left
censored observed spells (Ham and Lalonde, 1996) mentioned above. As we do not observe the
initial state of the firm in each market, with the exception of the market for switches, our results
may be biased by the presence of the ’initial condition‘ problem. As the CFC model assumes a
functional form for the duration distribution of each initial state that is different not only from that
of the other spells, but also from that of the other individuals, we can draw more robust
conclusions in term of causality interpretation by allowing each firm’s initial state to be correlated
with its time-invariant unobserved characteristics. Concerning the omitted variable bias, the CFC
model can alleviate the problem as long as we assume that some important factors omitted from
the hazard equation, such as R&D input measures, do not significantly change over time.19
Results from the estimation of the CFC model are reported in Table 8 in which the main findings of
the CPHM are confirmed.
[Insert Table 8 about here]
In particular, the coefficient of the distance to the technological frontier is negative and significant
in each of the three markets. The magnitude of this effect, which is comparable across markets as
the distances to the frontier are standardized, is larger in the case of routers, with a coefficient
of switches (and also in the case of routers, but to a lesser extent), the Frailty χ2 Test does not reject
the null hypothesis of the absence of a significant unobserved heterogeneity factor (ωi) for this
sub-sample. As the switch market is the only one in our sample which we can observe since its
inception, this result suggests that the CFC model is actually helpful in taking into account the
initial condition problem that potentially affects the left-censored observations in both the hubs
and the routers markets.
8. Conclusion
This paper has studied the relationship between technological leadership and persistence in
product innovation for a sample of firms operating during the 1990s in three markets in the LAN
industry a high-tech sector. During the period analysed here, the three markets under
consideration (i.e. hubs, routers, and switches) differed in terms of product complexity,
opportunity to innovate, barrier to entry and exit, and levels of concentration thus providing an
interesting case to study persistence in product innovation. We first carried out a univariate
analysis based on TPMs. Our analysis has revealed that persistence in product innovation is
relatively higher for complex products (i.e. product with many technical characteristics and high
interdependencies among them). In complex product markets technological leaders seem to
innovate more systematically than in non-complex products.
We then carried out a multivariate analysis by estimating conditional risk sets duration analysis.
This analysis has revealed that, controlling for firm size and market structure, technological
leadership seems to be always an important prerequisite for persistence in product innovation
with technological leaders always more persistent innovators than laggards. Our results have
highlighted the presence of a direct relationship between persistence in product innovation and
(lagged) patenting. In addition to this, we also found that the number of (lagged) patents increases
persistence in product innovation. Finally, we also found that technological leadership plays an
can also systematically innovate in an adjacent more complex market. Our sensitivity analysis has
revealed that our main results are robust to control for unobserved heterogeneity and reverse
causation.
These results have implications for our understanding of firms’ strategies for product innovation
in high-tech industries. In particular, the finding that technological leaders are more persistent
innovators than laggards suggests that these firms are responsible for extending the technological
frontier which is not inconsistent with findings from other studies of technological races in hi-tech
industries (Khanna, 1995; Lerner, 1997).
Our results also allow us to speculate about the determinants of product portfolio changes and
extensions. Our finding that technological leaders are more persistent is consistent with a situation
in which they mainly change their product portfolio through product proliferation and the
introduction of product families. Our finding for related markets suggests instead that we should
expect to find differences between incumbents in terms of expansion of their product portfolio
with technological leaders more able to ‘stretch’ their product portfolio farther than laggards as
they can innovate in more complex but adjacent markets.
Though interesting, our analysis is not without important limitations. First, we have considered
the case of a specific industry characterised by high dynamism and high rate of innovation. Ideally
one would like to compare our results with the case of other industries both high-tech but also
low-tech in which technological leadership may be expected to play a less important role for
innovation persistence. Second, our analysis is restricted to a ten years time span. Future research
should try to extend the time series. Finally, our analysis has focussed on the relationship between
technological leadership and innovation persistence. It has remained silent about the issue of
persistence in technological leadership. Whether persistence in leadership can be considered a
REFERENCE LIST
Arrow, K. J., 1962. Economic welfare and the allocation of resources to invention. In: The rate and direction of economic activity: economic and social factors. Princeton University Press, Princeton.
Amable, B., Demmou, L., and Ledezma, I., 2007. Competition, innovation and distance to frontier. Mimeo.
Bayus, B., and Putsis, W., 1999. Product proliferation: an empirical analysis of product line determinants and market outcomes. Marketing Science 18, 137-153.
Bhatt, S., 1987. Strategic product choice in differentiated markets. Journal of Industrial Economics 36(2), 207–216.
Bonanno, G., 1987. Location choice, product proliferation and entry deterrence. Review of Economic Studies 54, 37–45.
Bos, J.W.B., Economidou, C., and Sanders, M.W.J.L., 2013. Innovation over the industry life-cycle: evidence from EU manufacturing. Journal of Economic Behavior & Organization 86, 78-91
Box-Steffensmeier, J. M. and De Boef, S., 2006. Repeated events survival models: The conditional frailty model. Statistics in Medicine 25, 3518–3533.
Bresnahan, T.F., Stern, S. and Trajtenberg, M.T., 1997. Market segmentation and the sources of rents from innovation: Personal Computers in the late 1980s, The RAND Journal of Economics 28(0), S17-S44.
Manez, J.A., Rochina-Barrachina, M.E., Sanchis, A., and Sanchis, J.A., 2009. The role of sunk costs in the decision to invest in R&D. The Journal of Industrial Economics, 57(4), 712-735.
Cefis, E., 2003. Is there any persistence in innovative activities? International Journal of Industrial Organization 21(4), 489-515.
Cefis, E. and Orsenigo, L., 2001. The persistence of innovative activities. A cross-countries and cross-sectors comparative analysis. Research Policy 30(7), 1139-1158.
Chen, P. and Forman, C., 2006. Can vendors influence switching costs and compatibility in an environment with open standards? MIS Quarterly 30, 541-562.
Choi, C. J. and Scarpa, C. 1992. Credible spatial preemption through reputation extension. International Journal of Industrial Organization 10, 439–447.
Choi, J. P. 1998. Brand extension and informational leverage. Review of Economic Studies 65, 655– 669.
Christensen, C. M., 1997. The Innovator's Dilemma. New York, Harper Collins.
Clausen, T.H., Pohjola, M., Sapprasert, K. and Verspagen, B., 2012. Innovation strategies as a source of persistent innovation. Industrial and Corporate Change 21(3), 553-585.
Cohen, W. and Klepper, S., 1996. A Reprise of Size and R&D, Economic Journal 106, 925-951.
Cohen, W. and Levin, R., 1989. Empirical Studies of Innovation and Market Structure, in Schmalensee R., and Willig, R., Handbook of Industrial Organization North Holland, 1060-1107.
Cohen, W. and D. Levinthal (1990). Absorptive capacity: A new perspective on leaming and innovation, Administration Science Quarterly, 35, 128-152.
de Figueiredo, J. M., and Kyle, M. K., 2006. Surviving the gales of creative destruction: the determinants of product turnover, Strategic Management Journal 27(3), 241–264.
Dowell, G., 2006. Product line strategies of new entrants in an established industry: evidence from the U.S. bicycle industry, Strategic Management Journal 27(10), 959–979.
Draganska, M. and Jain, D.C., 2005. Product-line length as a competitive tool. Journal of Economics and Management Strategy 14(1), 1-28.
Firth D (1993). Bias reduction of maximum likelihood estimates. Biometrika 80, 27–38.
Fontana, R., 2008. Competing technologies and market dominance: standard “battles” in the Local Area Networking industry. Industrial and Corporate Change 17(6), 1205-1238.
Fontana, R. and Nesta L., 2009. Product Innovation and Survival in a High-Tech Industry. Review of Industrial Organization 34(4), 287-306.
Geroski P. A., Van Reenen J. and Walters C. F., 1997. How persistently do firms innovate? Research Policy 26(1), 33-48.
Gilbert, R. J. and Newbery, D. M., 1982. Preemptive Patenting and the Persistence of Monopoly. American Economic Review 72(3), 514-26.
Greenstein, S. M. and Wade, J. B., 1998. The product life cycle in the commercial mainframe computer market, 1968-1982. RAND Journal of Economics 29(4), 772-789.
Hall, B.H., Jaffe A., Trajtenberg M., 2001. The NBER Patent Citations Data File: Lessons, Insights and Methodological Tools, NBER Working Paper # 8498.
Ham J. C. and Lalonde R. J., 1996. The effect of sample selection and Initial conditions in duration models: evidence from experimental data on training, Econometrica 64(1), 175-205.
Heinze G and Schemper M (2001). A Solution to the Problem of Monotone Likelihood in Cox Regression, Biometrics 57(1), 114-119.
Henderson, R., 1993. Underinvestment and incompetence as responses to radical innovation: evidence from the photolithographic equipment industry, RAND Journal of Economics 24(2), 248-270.
Himmelberg C. P. and Petersen B. C., 1994. R&D and Internal Finance: A Panel Study of Small Firms in High-Tech Industries, Review of Economics and Statistics 76, 38-51.
Kamien, M. and Schwartz, N., 1982. Market Structure and Innovation, Cambridge University Press.
Khanna, T., 1995. Racing behavior: technological evolution in the high-end computer industry, Research Policy 24, 933–958.
Jeongsik Lee, J., Byung-Cheol, K. and Young-Mo L., 2011. Dynamic competition in technological investments: An empirical examination of the LCD panel industry, International Journal of Industrial Organization 29(6), 718-728.
Lerner, J., 1997. An empirical exploration of a technological race, The Rand Journal of Economics 28, 228–247.
Levinthal, D. A., 1997. Adaptation on rugged landscapes. Management Science 43(7), 934–950.
Malerba, F., Orsenigo, L. and Perreto, P., 1997. Persistence of innovative activities, sectoral patterns of innovation and international technological specialization. International Journal of Industrial Organization 15, 801-826.
McElheran, K. S., 2011. Do market leaders lead in business process innovation? The case(s) of E-business adoption. Harvard Business School Working Paper 10-104.
Metcalf, C.J., 2011. Persistence of technological leadership: emerging technologies and incremental innovation. The Journal of Industrial Economics LIX(2), 199-224.
Nelson,R. and Winter, S., 1982. An evolutionary theory of economic change. Harvard University Press, Cambridge
Nicoletti, G. and Scarpetta, S., 2003. Regulation, productivity and growth: OECD evidence. Economic Policy April, 9–72.
Penrose, E., 1959. The theory of the growth of the firm. M.E. Sharpe, White Plains, NY
Peters, B., 2009. Persistence of innovation: stylised facts and panel data evidence. Journal of Technology Transfer 34, 226-243.
Prentice, R. L., Williams, B. J. and Peterson, A. V., 1981. On the regression analysis of multivariate failure time data. Biometrika 68, 373–379.
Raubitschek, R., 1987. A model of proliferation with multiproduct firms. The Journal of Industrial Economics 25, 269-279.
Raymond, W., Mohnen, P., Palm, F., and van der Loeff, S. S., 2010. persistence of innovation in Dutch manufacturing: is it spurious?. The Review of Economics and Statistics 92(3), 495-504
Reinganum, J. F., 1983. Uncertain innovation and the persistence of monopoly. American Economic Review 73, 741-748.
Reinganum, J. F., 1985. Innovation and industrial evolution, Quarterly Journal of Economics 100, 81–99.
Rosenberg, N., 1982. Inside the black box. Cambridge University Press.
Sanderson, S. and Uzumeri, M., 1995. Managing product families: The case of the Sony Walkman. Research Policy 24, 761-782.
Scherer, M., 1965. Firm Size, Market Structure, opportunity, and the output of patented innovations, American Economic Review 55, 1097-1125.
Schivardi, F. and Schneider, M., 2008. Strategic experimentation and disruptive technological change. Review of Economic Dynamics 11, 386-412.
Schmalensee, R., 1978. Entry deterrence in the Ready-to-Eat breakfast cereal industry. Bell Journal of Economics 9, 305–327.
Stavins, J. (1995). Model entry and exit in a differentiated-product industry: the Personal Computer market. Review of Economics and Statistics 77, 571–584.
Squicciarini, M., 2009. Science parks: seedbeds of innovation? A duration analysis of firms’ patenting activity. Small Business Economics 32, 169–190.
Thomas, L.A., (1999). Adoption order of new technologies in evolving markets. Journal of Economic Behavior & Organization 38, 453-482.
Tripsas, M. and Gavetti G., 2000. Capabilities, cognition, and inertia: evidence from digital imaging. Strategic Management Journal 21(10-11). 1147-1161.
von Burg, U., 2001.The Triumph of Ethernet. Stanford University Press, Stanford
Wezel, F. C. and van Witteloostuijn, A., 2006. From scooters to choppers: Product portfolio change and organizational failure: evidence from the UK motorcycle industry 1895 to 1993. Long Range Planning 39(1), 11-28.
LIST OF TABLES
Table 1: Summary descriptive statistics
Obs. Mean SD Min Max
Hubs
DIST FRONT HUBS 204 0 1 -1.570 1.985
SIZE (EMPLOYEES/100) 126 3.157 6.660 0.003 31.270 C4 (PERCENTAGE) 204 94.624 2.991 89.549 99.186
AGE (LOG -YEARS) 204 2.430 0.822 0 4.477
NUMBER OF PRODUCTS AT ENTRY 204 2.015 1.533 1 8 NUMBER OF PATENTS AT T-1/1000 204 0.080 0.302 0 2.405 PATENT AT T-1(DUMMY) 204 0.456 0.499 0 1 PATENT STOCK/EMPLOYEES 126 0.176 0.352 0 3.571
Routers
DIST FRONT ROUTERS 246 0 1 -1.993 2.381
SIZE (EMPLOYEES/100) 246 3.756 7.407 0.001 31.700 C4(PERCENTAGE) 246 92.195 7.970 75.369 99.900
AGE (LOG -YEARS) 159 2.375 0.890 0 4.477
NUMBER OF PRODUCTS AT ENTRY 246 2.028 1.329 1 7 NUMBER OF PATENTS AT T-1/1000 246 0.062 0.301 0 2.405 PATENT AT T-1(DUMMY) 246 0.321 0.468 0 1 PATENT STOCK/EMPLOYEES 136 0.113 0.173 0 0.781
Switches
DIST FRONT SWITCHES 149 0 1 -2.103 1.810 SIZE (EMPLOYEES/100) 98 2.301 5.081 0.001 30.740 C4(PERCENTAGE) 145 89.982 6.633 79.410 96.532
AGE (LOG -YEARS) 149 2.299 0.916 0 4.477
NUMBER OF PRODUCTS AT ENTRY 149 1.745 1.420 1 8 NUMBER OF PATENTS AT T-1/1000 149 0.057 0.233 0 2.405 PATENT AT T-1(DUMMY) 149 0.544 0.500 0 1 PATENT STOCK/EMPLOYEES 98 0.214 0.433 0 3.571
All markets
SIZE (EMPLOYEES/100) 360 3.150 6.587 0.001 31.700
C4(PERCENTAGE) 595 92.488 6.562 75.369 99.900
AGE (LOG -YEARS) 599 2.375 0.874 0 4.477