Gene Ontology Classification: Building High-level Knowledge using
Genetic Algorithms
Laurence Rodrigues do Amaral and Estevam Rafael Hruschka Junior
Abstract— Computational approaches have been applied in many different biology application domains. When such tools are based on conventional computation, they have shown limitations to approach complex biological problems. In the present study, a computational evolutionary environment (CEE) is proposed as tool to extract classification rules from biological datasets. The main goal of the proposed approach is to allow the discovery of concise, yet accurate, high-level rules (from a biological database) which can be used as a classification system. More than focusing only on the classification accu-racy, the proposed CEE model aims at balancing prediction precision, interpretability and comprehensibility. The obtained results show that the proposed CEE is promising and capable of extracting useful high-level knowledge that could not be extracted by traditional classifications methods such as Decision Trees, One R and the Single Conjunctive Rule Learner using the same dataset.
I. INTRODUCTION
Molecular Biology has important areas that can benefit from the development and application of computer-based techniques. Computational approaches can be applied in different biology challenges such as, identification and anal-ysis of gene expressions, comparison of sequences (DNA, RNA and proteins), assembly of fragments, recognition of genes, determination of the structure of proteins [1] [2] and unification of the representation of gene and gene product attributes across species [20].
Due to the great amount of information and its complexity, tools based on conventional computation have shown limita-tions to model complex biological problems. One explanation for such difficulty is the inefficiency of conventional tools to work with large volumes of data, as well as, dealing with problems where finding the optimal solution (or a good approximate solution) can not be easily done. Following along those lines, computational intelligence (CI) techniques, such as, genetic algorithms, are being more and more used to solve problems in Molecular Biology. The growth in the use of CI techniques happens mainly due to specific characteristics such as their ability to automatically learn from data producing relevant results [2].
Several intelligent techniques have been applied in the analysis of biological data, such as Artificial Neural Net-works [7] [8], Support Vector Machines [9] [10], Genetic Algorithms (GAs) [17] [15] [16] [14] [12] [13] [11] and
Laurence Rodrigues do Amaral, Department of Computer Sciences, Federal University of Goias/Jatai, Unidade Jatoba, Rodovia BR 364 192, Jatai - GO, Brazil (email: [email protected]).
Estevam Rafael Hruschka Junior, Department of Computer Sciences, Federal University of Sao Carlos, Rod. Washington Lus, Km 235, Sao Carlos - SP, Brazil (email: [email protected]).
others. One of the main motivations for employing GAs, to solve problems in the molecular biology domain, is their potential in avoiding local optima and finding global optimum solutions. In the present study, such characteristic is explored aiming at discovering concise, and still accurate, high-level rules which can be used as a classification system.
It is worth mentioning that prediction accuracy is not the only important issue in a classification system. Inter-pretability and comprehensibility are key aspects in a system designed to help classification in real world domains. It happens mainly because the simple prediction cannot, itself, give to the users much information to help them to better understand the target problem, neither to learn more about the relationships among the variables1involved in the application
domain. In this sense, having a system that simply classify a given instance, giving no insight (or ”explanation”) about the obtained results, might not be so useful (or suitable) as a system capable of classifying and generating rules describing variable relevance and relations.
Taking into consideration the aforementioned ideas about more suitable classification systems, the rules generated by our proposed GA tend to have a reduced set of antecedents and can be used to predict the class of a ”term” (an instance having gene and gene product attributes based on a subset of ”Gene Ontology” database [20] containing 13,091 records). In addition, the system does not make use of ”default rules”. The GA output intend to reducing the problem to few variables for each class and never classifying a given instance based only on the higher frequency class. Therefore, besides outputting classification results, the results obtained by the rules may help to reveal relations among variables and to understand which of them are more relevant when predicting each one of the three classes: biological process, cellular component and molecular function.
In the GO ontology, each new term insertion or updated is performed manually by GO curators. Thus, the high-level knowledge generated by the GA proposed in here can help in new terms classification, making the classification task less complex for these GO curators. In [26], Bodenreider and collaborators built cross-subontological relations using lexical and association approaches applied in GO databases, our work does not use such relations.
1In this work we use the words ”variable” and ”attribute” as synonyms
that can refer to any one of the antecedents of a classification rule, as well as, to any one of the characteristic of a term given in the GO database WCCI 2010 IEEE World Congress on Computational Intelligence
II. GO CONSORTIUM
The Gene Ontology (GO) project is a collaborative effort addressing the need for consistent descriptions of gene prod-ucts in different databases. GO collaborators are developing three structured and controlled vocabularies (ontologies) that describe gene products in terms of their associated biological processes, cellular components and molecular functions in a species-independent manner. In [20] the authors defines three separate aspects to this effort:
1) Writing and maintaining the ontologies;
2) Making cross-links between ontologies and genes, and also between ontologies and gene products in the collaborating databases;
3) Developing tools to help the creation, maintenance and use of GO ontologies.
As stated in [20], ontologies are used mainly because they can provide a vocabulary for representing and communi-cating knowledge about a topic, and a set of relationships that hold among the terms of the vocabulary. They can be structurally very complex, or relatively simple. In addition, ontologies can capture domain knowledge in a way that can easily be dealt with by a computer. Also, considering that terms in an ontology and relationships among terms are carefully defined, the use of ontologies makes easier the generation of standard annotations, improves computa-tional queries, and can support the construction of inference statements from the information at hand. The ontologies are developed to include all terms falling into these domains without consideration of whether the biological attribute is restricted to certain taxonomic groups. Sharing gene prod-uct names would entail tracking evolutionary histories and reflecting both ”orthologous” and ”paralogous” relationships between gene products.
It is also important to recall that GO is not a system for naming genes and proteins; it also does not attempt to describe all of biology, neither to define a nomenclature for genes or gene products. The vocabularies describe molecular phenomena (e.g. programmed cell death), not biological objects (e.g. proteins or genes).
Another relevant idea is that different research communi-ties have different naming conventions. Different organisms have different numbers of members in gene families. The GO project focuses on the development of vocabularies to describe attributes of biological objects, not on the naming of the objects themselves. This point is particularly important to understand because many genes and gene products are named for their function [20].
III. EVOLUTIONARYENVIRONMENT
A. Introduction
Genetic Algorithms (GAs) are computational search meth-ods based on natural evolution and genetic mechanisms, sim-ulating Darwins’s natural selection theory [4]. A GA can be classified as an Evolutionary Computation approach, which is a subarea of Artificial Intelligence focused on the study
of computational methods based on Darwin’s evolutionary theory.
GAs are parallel algorithms which manipulate a group (populations) of individuals representing chromosomes. Ge-netic algorithms transform a current population in a new one applying reproduction and survival operators, based on the fitness function [5].
In the evolutionary process performed by a GA (when searching for a solution), a population of possible solutions evolves using probabilistic operators conceived from biolog-ical metaphors (crossover and mutation). This evolution is performed in such way that the fitness of individuals that represent the best solutions increases as the evolutionary process goes on [6].
The GA implemented in our evolutionary environment was adapted from [18]. The GA in [18] was developed in GALLOPS tool [19] and it was elaborated to generate IF-THEN classification rules in clinical databases. Fidelis et al.’s environment [19] was applied in databases whose registers were characterized by patient’s data such as age, familiar historical and a series of specific symptoms. Our evolutionary environment, developed in the Java programming language, was adapted to work with Gene Ontology data. The main characteristics of our Evolutionary Environment are detailed in the following subsections.
B. Dataset
The dataset used in our work was generated based on the GO portal (http://www.geneontology.org/). As shown in the following itemized list, there are different GO data files archives [20]:
• The go-termdb files are generated daily and contain only
the ontology terms and their relationships;
• The go-lite files (assocdb and seqdb) are generated three
times a week and include the ontology terms, all gene products and their sequences, except for IEA (inferred from electronic annotation) associations;
• The go-full files are generated once a month and
con-tains all data, including IEA associations.
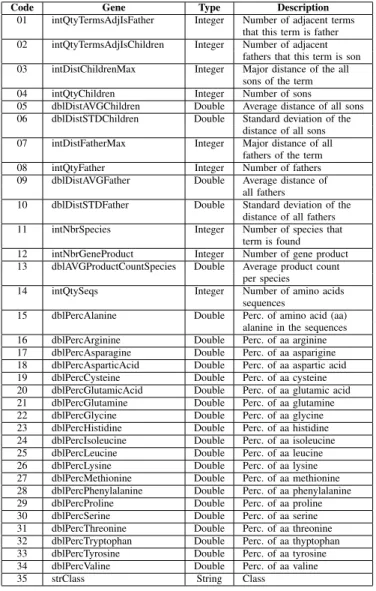
In order to customize a dataset suitable to our goals, we have built an SQL statement selecting thirty five attributes from the seqdb database (go-lite files), distributed in three classes. Table I shows the distribution of records per class. Each record in the database corresponds to a term deposited by a researcher in the GO environment. Table II explains each attribute, where the first column is the gene code, the second, is the gene name and the third column shows the description of each attribute.
TABLE I RECORDS DISTRIBUTION
Class Number of records Percentage of records
Biological Process 7,739 59.12% Cellular Component 1,293 9.88% Molecular Function 4,059 31.01%
TABLE II ATTRIBUTES’DESCRIPTION
Code Gene Type Description
01 intQtyTermsAdjIsFather Integer Number of adjacent terms that this term is father 02 intQtyTermsAdjIsChildren Integer Number of adjacent
fathers that this term is son 03 intDistChildrenMax Integer Major distance of the all
sons of the term 04 intQtyChildren Integer Number of sons
05 dblDistAVGChildren Double Average distance of all sons 06 dblDistSTDChildren Double Standard deviation of the
distance of all sons 07 intDistFatherMax Integer Major distance of all
fathers of the term 08 intQtyFather Integer Number of fathers 09 dblDistAVGFather Double Average distance of
all fathers
10 dblDistSTDFather Double Standard deviation of the distance of all fathers 11 intNbrSpecies Integer Number of species that
term is found 12 intNbrGeneProduct Integer Number of gene product 13 dblAVGProductCountSpecies Double Average product count
per species
14 intQtySeqs Integer Number of amino acids sequences
15 dblPercAlanine Double Perc. of amino acid (aa) alanine in the sequences 16 dblPercArginine Double Perc. of aa arginine 17 dblPercAsparagine Double Perc. of aa asparigine 18 dblPercAsparticAcid Double Perc. of aa aspartic acid 19 dblPercCysteine Double Perc. of aa cysteine 20 dblPercGlutamicAcid Double Perc. of aa glutamic acid 21 dblPercGlutamine Double Perc. of aa glutamine 22 dblPercGlycine Double Perc. of aa glycine 23 dblPercHistidine Double Perc. of aa histidine 24 dblPercIsoleucine Double Perc. of aa isoleucine 25 dblPercLeucine Double Perc. of aa leucine 26 dblPercLysine Double Perc. of aa lysine 27 dblPercMethionine Double Perc. of aa methionine 28 dblPercPhenylalanine Double Perc. of aa phenylalanine 29 dblPercProline Double Perc. of aa proline 30 dblPercSerine Double Perc. of aa serine 31 dblPercThreonine Double Perc. of aa threonine 32 dblPercTryptophan Double Perc. of aa thyptophan 33 dblPercTyrosine Double Perc. of aa tyrosine 34 dblPercValine Double Perc. of aa valine
35 strClass String Class
C. Individual Representation
In our evolutionary environment, each individual is com-posed by thirty four (34) genes (one for each attribute in the GO Database, expect strClass). The first gene of each individual corresponds to the first attribute (code 01) found in the database and successively until all attributes are represented. A general example is illustrated in Figure 1.
Fig. 1. Individual representation
For every individual, thei-th gene (i=1...N) is subdivided into three subfields: weight (Wi), operator (Oi) and value
(Vi), as illustrated in figure 1. Each gene corresponds to
one condition in the antecedent part of the rule (IF) and the individual as a whole is the rule antecedent. The weight field is an integer variable and its value must be defined between 0 and 10 (Wi=wi,j|wi,j= 1..10). It is important to mention
that this weight field determines the insertion or the exclusion of its correspondent gene in the rule antecedent. If the weight value is less than a boundary-value the gene will not appear in the rule, otherwise the gene appears. In this work, after a preliminary parameter analysis, the value 8 was used as the boundary-value. The operator field can be<or≥. The value field is an integer or floating-point number which can range from the minor to the larger gene expression value found in the database.
D. Genetic Operators and Parameters
Stochastic tournament with Tour of size 3 is used as the selection method for crossover. Two-point crossover with probability equal to 100% is applied to each couple of selected individuals generating two new ones. Mutation is applied to the new individuals. An specific mutation operator is used to each type of gene field with a rate of 30%. During the weight field mutation, the new value is given by the new draw. The mutation changes the current operator field to other valid operator. In this work it was used only two operators (< and ≥). We also used an elitist reproduction strategy, where the best individual of each generation was passed having no modification to the next generation. We used 100 individuals, evaluate our GA per 100 generations, set the weight field to 8 and the decimal floating point of Value field equal a 1. This environment was obtained after testing various configurations, such as:
• Population size: 100, 200 and 400; • Generations: 50, 100 and 200;
• Selection method: Roulette and Stochastic tournament; • Weight field: 5, 6, 7 and 8;
• Decimal floating point of Value field: 1, 2 and 3.
To define the best configuration, we ran 35 times each possible setting combination (based on the aforementioned list) using different random seeds and compared the obtained results considering a significance test using α= 0.05.
E. Fitness Function (FF)
In general, the individual fitness quantifies its quality as a solution for the target problem. In this work, FF evaluates the quality of the rule associated to each individual. Some concepts must be explained before defining our FF. When a rule defined for the classification of an specific class C and is applied to a known case, four different types of results can be observed, depending on the class predicted by the rule and the true class of the case [22]:
• True Positive (tp) - The rule classifies the case as class
C and the case really belongs to class C;
• False Positive (fp) - The rule classifies the case as class
C, but the case does not belong to class C;
• True Negative (tn) - The rule does not classify the case
as class C and the case does not belong to class C;
• False Negative (fn) - The rule does not classify the case
indicators commonly used in medical domains, called Sen-sitivity (Se) and Specificity (Sp) which can be defined as follows:
Se= tp
(tp+f n) (1)
Sp= tn
(tn+f p) (2)
Using the sensitivity and specificity concepts, FF is defined as the combination of these two indicators, Se and Sp, as follows:
F itness= (Se+Sp)/2 (3)
The goal is to maximize, at the same time,Se as well as Sp. In each execution, the GA works in a binary classification problem, that is, when the GA is searching for rules associ-ated to a given class C, all the other classes are grouped in one unique class (not C).
IV. RESULTS
Table III show results obtained using our environment in a 10-fold cross-validation classification run. Each line of the table shows each composition of the 10-fold cross validation. It is possible to see that all obtained values are very similar, i.e. there are no big differences in results for each composi-tion. The results for the Biological Process class presented standard deviation equal to 0.02 while the results for the Biological Process, as well as for the Cellular Component classes presented 0.01 standard deviation. Also, we obtained an average precision of 0.686 (or 68.6%) using training data and 0.688 (or 68.8%) using test data forBiological Process; 0.644 (or 64.4%) in training and 0.643 (or 64.3%) in test for Cellular Component and 0.758 (or 75.8%) in training and 0.759 (or 75.9%) in test forMolecular Function. These results are comparable with other traditional classification methods (as we will discuss below).
TABLE III
PRECISION OF THE RESULTS OBTAINED IN A10-FOLD CROSS
VALIDATION CLASSIFICATION TASK
Biol. proc. Cell. comp. Mol. func. Composition Train Test Train Test Train Test
1111111110 0.692 0.701 0.649 0.643 0.767 0.764 1111111101 0.691 0.705 0.646 0.663 0.772 0.776 1111111011 0.694 0.680 0.657 0.647 0.756 0.755 1111110111 0.694 0.680 0.636 0.620 0.750 0.756 1111101111 0.693 0.696 0.628 0.628 0.763 0.768 1111011111 0.630 0.633 0.653 0.647 0.718 0.724 1110111111 0.694 0.679 0.652 0.640 0.776 0.757 1101111111 0.692 0.698 0.619 0.634 0.749 0.756 1011111111 0.690 0.718 0.651 0.671 0.762 0.775 0111111111 0.693 0.691 0.651 0.641 0.773 0.760
Average 0.686 0.688 0.644 0.643 0.758 0.759
As mentioned before, the main goal of our work is to pro-pose an evolutionary system that can extract knowledge (IF-THEN rules) from a dataset built from GO database. In
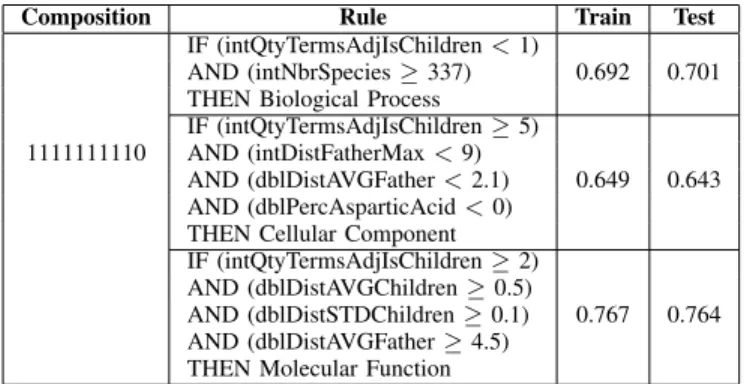
ad-dition, the system’s output should go beyond a simple classi-fication task, it should also be a source of useful information regarding the relevance of the attributes to each class, as well as, about the relationship among the most relevant attributes. Table IV shows the rule sets obtained for 1111111110 com-position. The 1111111110 composition was chosen randomly (see full set in http://www.dc.ufscar.br/˜estevam/wcci2010/). Table IV shows the rules for Biological Process, Cellular ComponentandMolecular Function. In these results, it is im-portant to note the presence of the intQtyTermsAdjIsChildren attribute in all three classes. For Cellular Component and Molecular Functionit is interesting to observe the presence of several attributes related to distances, such as intDistFa-therMax, dblDistAVGChildren, dblDistSTDChildren, etc and the presence of attributes based on average and standard deviation.
TABLE IV
RULES OBTAINED IN1111111110COMPOSITION
Composition Rule Train Test
IF (intQtyTermsAdjIsChildren<1)
AND (intNbrSpecies≥337) 0.692 0.701 THEN Biological Process
IF (intQtyTermsAdjIsChildren≥5) 1111111110 AND (intDistFatherMax<9)
AND (dblDistAVGFather<2.1) 0.649 0.643 AND (dblPercAsparticAcid<0)
THEN Cellular Component IF (intQtyTermsAdjIsChildren≥2) AND (dblDistAVGChildren≥0.5)
AND (dblDistSTDChildren≥0.1) 0.767 0.764 AND (dblDistAVGFather≥4.5)
THEN Molecular Function
Table V shows the number of antecedent conditions present in the classification rules for each composition (for all 10 folds) and each class. ConsideringBiological Process, values range from 1 to 3 having, on average, 2.1 attributes. When concerning results for Cellular Componentthe rules’ length ranges from 2 to 6 (having 4 antecedent conditions on average). And forMolecular Functionthe shortest rules have 3 antecedent conditions, while the longest ones have 7 (thus, having 4.5 attributes on average). It is possible to notice that Biological Process has the lower number of attributes in its IF clauses, followed by Cellular Component and then by Molecular Function. In order to give a broader idea of the obtained results, some traditional classification methods were also applied using the same dataset (and the same 10-fold cross-validation strategy). The number of attributes (or antecedent conditions) obtained with the proposed AG is lower than the ones obtained using the other traditional classification methods employed in this work.
TABLE V
RULES LENGTH PER COMPOSITION
Composition Biol. proc. Cell. comp. Mol. func.
1111111110 2 4 4
1111111101 1 6 5
1111111011 1 4 4
1111110111 3 4 4
1111101111 3 4 4
1111011111 3 2 3
1110111111 1 5 4
1101111111 3 2 5
1011111111 2 6 5
0111111111 2 3 7
Average 2.1 4.0 4.5
Min 1 2 3
Max 3 6 7
most relevant attribute had its weight set to the maximum value, while the least relevant attribute’s weight was set to the minimum value. All the other attributes weights were calculated based on an interpolation-based method. A set of pairs (defining the maximum and the minimum weights were tested), whereas the maximum values used were arbitrarily set as 2, 3, 4, 5 and 7 in each experiment, and the minimum value was fixed as -1.
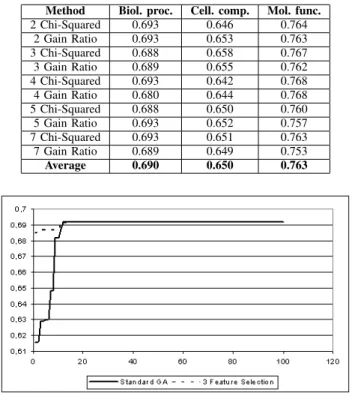
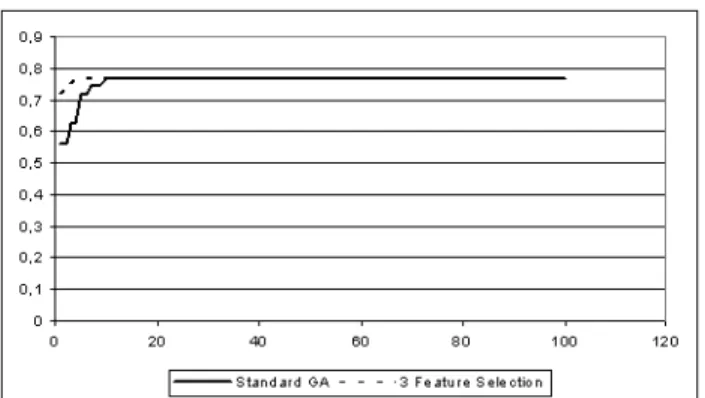
Table VI shows the results obtained when using each one of the feature selection metrics, as well as, when using each of the possible ”maximum” weights. As shown in Table VI, the results obtained using a feature selection approach to define the initial population of the GA did not impacted the accuracy results in a strong way. Also, the results obtained with Chi Squared were slightly better than the ones obtained using Gain Ratio. And the better results obtained in this analysis are described by the ”3 - Chi Squared”. However, to have a better idea of the influence of the feature selection methods in our method, a convergence analysis is necessary. Following along these lines, Figures 2, 3 and 4 show converge curves for our Standard GA (our proposed evolutionary environment having a random initial population - without feature selection), and for the GA that uses the ”3 Chi-Squared” initial-population-definition method in 100 generations.
In spite of the final convergence being almost the same, the ”3 Chi-Squared” method presented the best results. This method (”3 Chi-Squared”) contributed to a quicker conver-gence. A faster convergence is important mainly when it is necessary to stop the application when a certain accuracy is achieved (for example, fitness>0.75).
In order to better evaluate the empirical results obtained using our proposed AG, a comparative analysis was con-ducted considering the accuracy of other three traditional classification algorithms, namely Decision Trees [24], One R [25] and Single Conjunctive Rule Learner [23]. Table VII shows our methods (Standard GA and 3 Chi-Squared) accuracy compared to the three aforementioned traditional algorithms accuracy results. To make the analysis simpler, we divided it in a two-fold comparison. First, we compared our methods with Decision Tree and One R, and later, we
TABLE VI
RESULTS OBTAINED IN10-FOLD CROSS VALIDATION USING
TRADITIONAL STRATEGIES FEATURE SELECTION(RESULTS PER METHOD AND WEIGHT)
Method Biol. proc. Cell. comp. Mol. func.
2 Chi-Squared 0.693 0.646 0.764 2 Gain Ratio 0.693 0.653 0.763 3 Chi-Squared 0.688 0.658 0.767 3 Gain Ratio 0.689 0.655 0.762 4 Chi-Squared 0.693 0.642 0.768 4 Gain Ratio 0.680 0.644 0.768 5 Chi-Squared 0.688 0.650 0.760 5 Gain Ratio 0.693 0.652 0.757 7 Chi-Squared 0.693 0.651 0.763 7 Gain Ratio 0.689 0.649 0.753
Average 0.690 0.650 0.763
Fig. 2. Standard GA vs. 3-Feature Selection - Biological process
Fig. 3. Standard GA vs. 3-Feature Selection - Cellular component
compared the proposed AGs with the Single Conjunctive Rule Learner.
Fig. 4. Standard GA vs. 3-Feature Selection - Molecular function
results, our proposed methods presented better results than both traditional algorithms (Decision Trees and One R). To be more precise, in the Decision Trees experiments, the final achieved tree has 722 leaves and size 1,443. The One R results generated 185 rules in total. On other hand, our environment built simple single IF-THEN rules for each class, with at the most 7 antecedent conditions. When comparing our methods with the Single Conjunctive Rule Learner, the ”Standard GA” as well as the ”3 Chi-Squared” version obtained better prediction accuracy for Cellular Component. For the others two classes, our methods tended to present less accuracy precision. But here again, a more careful analysis is necessary. In spite of generating a single rule, the Single Conjunctive Rule Learner (SCRL) uses the default rule when performing the classification task, thus, this method cannot be considered such a good alternative when concerning the explanation for the classification results. To help understanding the impact of the use of the default rule in the classification process, let us analyze in more detail the results given by the SCRL when applied in our data set. The single rule generated by SCRL was:
If (intQtdePais ≥ 11.5) and (fltDistDesvPadFilhos ≥ 0.8011) Then strTRMtermType = MolecularFunction Else use the default rule.
The default rule is a classification rule that classifies any instance (data set register) as being member of the most frequent class. In our data set, the most frequent class is Biological Process (59.12% - see Table I), thus, for all instances that do not match to the antecedent conditions, SCRL classifies them as Biological Process. In this sense, the Cellular Componentclass will never be assigned to any instance. In addition, the only information given to the user (besides the classification) is related toMolecular Function. Our proposed methods, on the other hand, built an IF-THEN rule for each class, building knowledge per each class, and presented acceptable prediction accuracy.
V. FINALREMARKS
As discussed in the initial section of this paper, many complex biological problems have received more attention from part of the computational intelligence community manly because of the great amount of information available in
TABLE VII
COMPARISON BETWEEN OUR METHODS AND OTHER TRADITIONAL
METHODS USING THE FITNESS FUNCTION DESCRIBED BY THE EXPRESSION3
Method Biol. proc. Cell. comp. Mol. func.
Our method (Standard GA) 0.688 0.643 0.759 Our method (3 Chi-Squared) 0.688 0.660 0.767 Single Conj. Rule Learner 0.730 0.500 0.820 Decision tree 0.838 0.769 0.900
One R 0.810 0.677 0.871
electronic repositories and their complexity. In this work, we proposed an evolutionary environment to extract high-level knowledge (IF-THEN rules) from a specific Gene Ontology database subset. Taking into consideration that a classification system should go beyond prediction accuracy we have implemented a fitness function based on features which can help obtaining comprehensible and interpretable results while keeping acceptable classification accuracy.
Comparing the convergence rate of both proposed AGs, namely the Standard GA and its Hybrid Feature-Selection-based version, it is possible to notice that the Standard GA doesn’t need help to achieve the best classification accuracy, but the Hybrid Feature-Selection-based GA, on the other hand, achieves very similar results in a lower number of gen-erations. In general the proposed methods allowed to obtain simple classification rules with low number of attributes per class. Both proposed methods obtained good convergence rates and presented more informative and comprehensive results than other traditional classification methods also used in our comparative analysis. Therefore, it is possible to con-clude that the use of the proposed evolutionary environment is indicated mainly when classifying real problems where the discovery of high-level knowledge about the domain is crucial.
As future works, we hope to include other data sources in this environment, seeking to build accurate rules and that can bring knowledge to the biological area experts. In addition, we intend to proceed along these lines of investigation trying to incorporate the ideas of continuous learning to improve the performance of evolutionary algorithms in the biological domain.
VI. ACKNOWLEDGMENT
Authors acknowledge the Brazilian research agencies CNPQ, CAPES and FAPESP for its financial support.
REFERENCES
[1] J. C. Setbal and J. Meidanis,Introduction to Computacional Molecular Biology, Boston: PWS Publishing Company, 1997.
[2] P. Baldi and S. Brunak, Bioinformatics: the Machine Learning ap-proach, MIT Press, 2001.
[3] M. C. P. de Souto, A. C. Lorena, A. C. B. Delbem and A. C. P. L. F. de Carvalho, “Tecnicas de Aprendizado de Maquina para Problemas de Biologia Molecular,”Sociedade Brasileira de Computacao, 2003. [4] David E. Goldberg,Genetic Algorithms in Search, Optimization and
Machine Learning, Adison-Wesley, 1989.
[6] J. Tanomaru, “Motivacao, Fundamentos e Aplicacoes de Algoritmos Geneticos,”Congresso Brasileiro de Redes Neurais, 1995.
[7] Y. Xu and F. M. Selaru and J. Yin and T. T. Zou and V. Shustova and Y. Mori and F. Sato and T. C. Liu and A. Olaru and S. Wang and M. C. Kimos and K. Perry and K. Desai and B. D. Greenwald and M. J. Krasna and D. Shibata and J. M. Abraham and S. J. Meltzer, “Artificial Neural Networks and Gene Filtering Distinguish Between Global Gene Expression Profiles of Barret’s Esophagus and Esophageal Cancer,”Cancer Research, 2002.
[8] J. Khan and J. S. Wei and M. Ringnr and L. H. Saal and M. Ladanyi and F. Westermann and F.Berthold and M. Schwab and C. R. Antonescu and C. Peterson and P. S. Meltzer, “Classifiction and diagnostic prediction of cancers using gene expression profiling and artificial neural networks,” Nature Medicine, 2001.
[9] T. S. Furey and N. Cristianini and N. Duffy and D. W. Bednarski and M. Schummer and D. Haussler, “Support vector machine classification and validation of cancer tissue samples using microarray expression data,”Bioinformatics, 2000.
[10] M. P. S. Brown and W. N. Grundy and D. Lin and N. Cristianini and C. W. Sugnet and T. S. Furey and M. Ares and D. Haussler, “Knowledge-based analysis of microarray gene expression data by using support vector machines,”Stanford University of Medicine, 1999.
[11] I. Zwir and R. R. Zaliz and E. H. Ruspini, “Automated Biological Se-quence Description by Genetic Multiobjective Generalized Clustering,” New York Academy of Sciences, 2002.
[12] C. H. Ooi and Patrick Tan, “Genetic Algorithms applied to multi-class prediction for the analysis of gene expression data,” Bioinformatics, 2003.
[13] Kalyanmoy Deb and A. Raji Reddy, “Classification of Two and Multi-Class Cancer Data Reliably Using Multi-Objective Evolutionary Algorithms,”KanGAL Report, 2003.
[14] Jane Jijun Liu and Gene Culter and Wuxiong Li and Zheng Pan and Sishua Peng and Tim Hoey and Liangbiao Chen and Xuefeng Ling, “Genetic Algorithms applied to multi-class prediction for the analysis of gene expression data,”Bioinformatics, 2005.
[15] Sushmita Mitra and Haider Banka, “Multi-objective evolutionary bi-clustering of gene expression data,”Pattern Recognition, 2006. [16] M. Wahde and Z. Szallasi, “Improving the prediction of the clinical
outcome of breast cancer using evolutionary algorithms,”Soft Comput, 2006.
[17] L. R. Amaral and G. Sadoyama and F. S. Espindola and G. M. B. Oliveira, “Oncogenes Classification Measured by Microarray using Ge-netic Algorithms,”Proceedings of the IASTED International Conference on Artificial Intelligence and Applications, 2008.
[18] M. V. Fidelis and H. S. Lopes and A. A. Freitas, “Discovery Compre-hensible Classification Rules with a Genetic Algorithm,” Proceedings of the Congress on Evolutionary Computation - (CEC-2000), 2000. [19] E. D. Goodman, “An Introduction to Gallops - The Genetic
Algo-rithms Optimized for Portability and Parallelism System,”Tech report - Departament of Computer Science - Michigan State University, 1996. [20] The Gene Ontology Consortium, “Gene Ontology: tool for the
unifi-cation of biology,”Nature Genetics, 2000.
[21] H. S. Lopes and M. S. Coutinho and W. C. Lima, “An evolutionary approach to simulate cognitive feedback learning in medical domain,” Proceedings of the Congress on Evolutionary Computation - (CEC-2000), 2000.
[22] H. S. Lopes and M. S. Coutinho and W. C. Lima, “An evolutionary approach to simulate cognitive feedback learning in medical domain,” Genetic Algorithms and Fuzzy Logic Systems), Edited by E. Sanchez and T. Shibata and L. A. Zadeh, Singapore, 1998.
[23] G. Holmes; A. Donkin and I. H. Witten, “Weka: A machine learning workbench,” Proceedings of the Second Australia and New Zealand Conference on Intelligent Information Systems, 1994.
[24] J. R. QuinlanC4.5: Programs for Machine Learning, Morgan Kauf-mann Publishers, 1993.
[25] R. C. Holte, “Very simple classification rules perform well on most commonly used datasets,”Machine Learning, 1993.