Social Accounting Matrix and the System of National Accounts: An Application.
Susana Santos
Technical University of Lisbon
Institute of Economics and Business Administration (ISEG – Instituto Superior de Economia e Gestão)
Department of Economics
Research Unit on Complexity in Economics Rua Miguel Lupi, 20, 1200-781 Lisboa, Portugal, Tel. 351 21 392 59 53
Fax: 351 21 392 28 08 E-mail: [email protected].
Abstract
The purpose of this session is to show how the System of National Accounts (SNA) and the input-output (supply and use) tables are used to construct a Social Accounting Matrix (SAM).
Based on the country's National Accounts, an aggregate SAM will be constructed for the Portuguese economy and their full consonance will be demonstrated by identifying both the items and balances of the various internal accounts of the System in the constructed SAM.
The SAM will be shown as a working instrument for quantifying the flows in the economic circuit, and blocks of sub-matrices with common characteristics will be described in terms of the accounting transactions that are included in each of them.
As an example, a more detailed SAM will be constructed and the contents of its cells described in strict detail.
The relationship between the SAM and the input-output table will also be briefly analysed.
(Presented to the 15th International Input-Output Conference, held at the Renmin University of China, Beijing, on 28 June 2005)
CONTENTS
1. The SAM and its development ... 1
2. The SAM and the SNA. An example applied to Portugal ... 2
2.1. The generic structure and the blocks of sub-matrices ... 2
2.2. The SAM as a complete account of the circular flow in the economy ... 5
2.3. Possible disaggregations ... 7
2.4. Identifying the identities and balances of the various internal accounts of the SNA in the aggregate SAM ... 7
2.5. Specifying the SAM’s blocks of sub-matrices and their cell contents ... 17
2.5.1. Compensation of factors of production ... 17
2.5.2. Production ... 18
2.5.3. Intermediate Consumption ... 18
2.5.4. Gross Capital Formation ... 19
2.5.5. Net indirect taxes ... 19
2.5.6. Final Consumption ... 21
2.5.7. External Trade ... 22
2.5.8. Current Transfers ... 22
2.5.9. Capital Transfers ... 23
2.5.10. Domestic Saving, Trade Margins, Net lending/borrowing ... 23
2.5.11. Financial Transactions (and the impossibility of working with them) ... 25
2.6. A more detailed SAM for Portugal and the description of its cell contents ... 25
3. The SAM and the Input-Output table ... 35
1. The SAM and its development
A SAM is a square matrix in which each transaction is recorded only once in a cell of its own – it is conventionally agreed that the entries made in rows represent incomes or receipts, whilst the entries made in columns represent outlays or expenditures - so, for each row there is a corresponding column, i.e. for every income there exists a corresponding expenditure, with their totals being equal. These figures will include both production and institutional accounts, which are subdivided into yet other accounts, defined in accordance with the goal of the study and the available information. Thus, the SAM consists of a set of interrelated subsystems that, on the one hand, give an analytical picture of the studied economy in a particular accounting period and, on the other hand, serve as an instrument for assessing the effects of changes on the particular flows represented by it (injections and leakages in the system), which might be the result of policy measures.
Therefore, the SAM can be seen as a working instrument for quantifying the flows in the economic circuit and for simulating the effects resulting from any changes in such flows. This session will not develop the latter aspect (the SAM modelling).
The SAM's particular method of accounting for economic activity dates back to a number of different sources, starting with F. Quesnay's "tableau économique" (18th century). Sir Richard Stone pioneered the development of the SAM framework with his 1954 article "Input-Output and the Social Accounts," working on it for over roughly four decades. The general shape of a SAM framework was first described by Pyatt and Thorbecke (1976). Afterwards Pyatt and Roe (1977) published a book giving a detailed description of the example of Sri Lanka. Since then, SAMs have been applied in a wide variety of (developed and developing) countries and regions, and with a wide variety of different goals. SAMs have been used to study income distribution and redistribution (e.g. Pyatt and Roe, 1977; and Keuning, 1996), regional development (e.g. Cardenete, 2004), growth strategies in developing economies (e.g. Pyatt and Round, 1985; Robinson, 1986; and Vos and Jong, 2003), decomposition of activity multipliers that shed light on the circuits comprising the circular flow of income (e.g. Stone, 1981; Pyatt and Round, 1985; and Santos, 2004), as well as a combination of social, technological/environmental and economic issues (e.g. Resosudarmo and Thorbecke, 1996; Khan, 1997; Duchin1, 1998; and Alarcón and others, 2000).
1
Her very elucidating paper entitled "Global Environmental Degradation in the 21st Century: A Challenge for Input-Output Economics", presented at the 14th International Conference on Input-Output Techniques (Montreal - Canada, October 2002), stresses the importance of the SAM framework.
2. The SAM and the SNA. An example applied to Portugal 2.1. The generic structure and the blocks of sub-matrices
The taxonomy used in a SAM depends on the available data and the purposes of the study underlying its construction. It is, however, fundamental for the success of any analysis, that there should be a definition of an appropriate classification and a characterisation of the production and institutional subsectors.
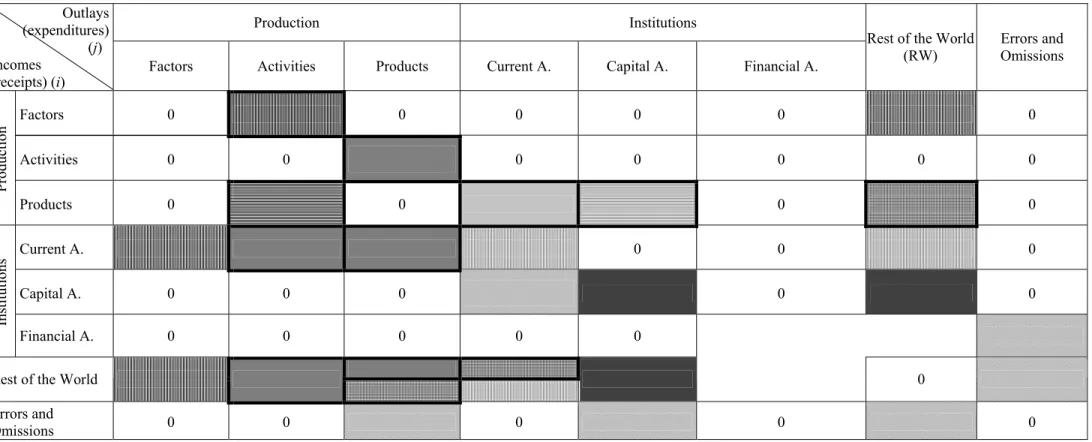
Constantly concerned with adopting a mutually exclusive and, in a certain way, exhaustive classification, the adopted disaggregation should respect, on the one hand, the functional criterion, describing the production processes and pointing out the existing technical-economic relationships between the various productive units and, on the other hand, it should respect the institutional criterion, describing distribution, accumulation and financing activities, and showing the relationships in economic behaviour. We therefore have "Production" divided into factors of production, activities and products and "Institutions" divided into current, capital and financial accounts. We also considered an "errors and omissions" account, which, as we shall see, will assume values that are perfectly justified by the national accounting system.
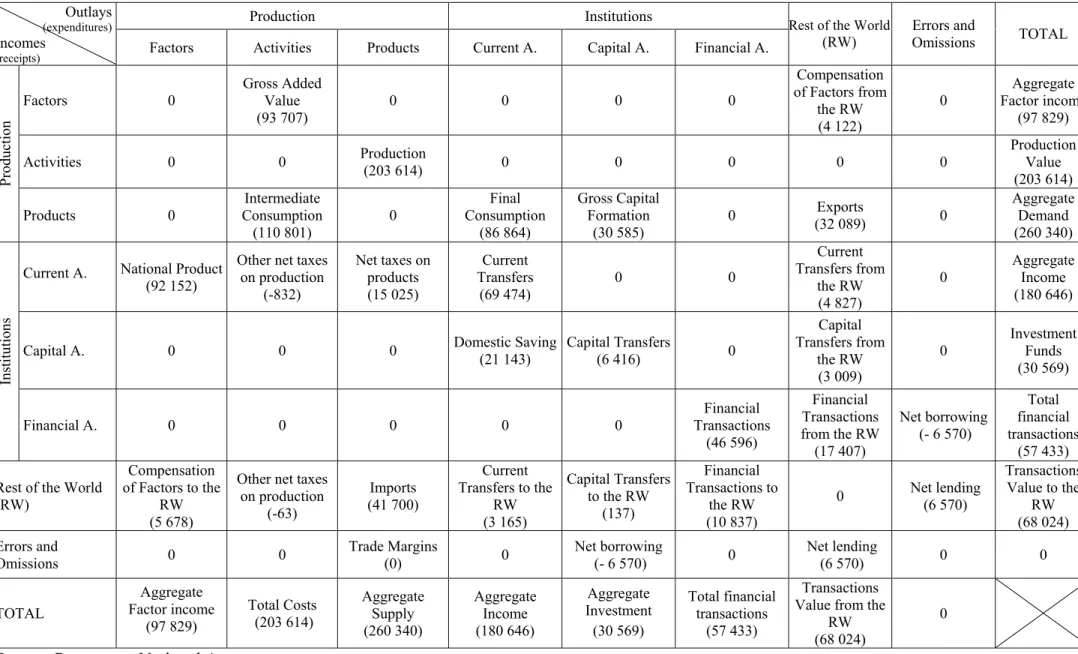
Table 1. Basic Portuguese Social Accounting Matrix (SAM) for 1999 (in millions of euros)
Production Institutions Outlays
(expenditures)
Incomes
(receipts) Factors Activities Products Current A. Capital A. Financial A.
Rest of the World (RW) Errors and Omissions TOTAL Factors 0 Gross Added Value (93 707)
0 0 0 0 Compensation of Factors from
the RW (4 122) 0 Aggregate Factor income (97 829)
Activities 0 0 Production
(203 614) 0 0 0 0 0
Production Value (203 614) Pr odu ction Products 0 Intermediate Consumption (110 801) 0 Final Consumption (86 864) Gross Capital Formation (30 585)
0 Exports
(32 089) 0
Aggregate Demand (260 340)
Current A. National Product (92 152)
Other net taxes on production
(-832)
Net taxes on products (15 025) Current Transfers (69 474) 0 0 Current Transfers from the RW (4 827) 0 Aggregate Income (180 646)
Capital A. 0 0 0 Domestic Saving
(21 143)
Capital Transfers
(6 416) 0
Capital Transfers from the RW (3 009) 0 Investment Funds (30 569) In stitu tion s
Financial A. 0 0 0 0 0
Financial Transactions
(46 596)
Financial Transactions from the RW (17 407)
Net borrowing (- 6 570)
Total financial transactions
(57 433)
Rest of the World (RW)
Compensation of Factors to the
RW (5 678)
Other net taxes on production
(-63)
Imports (41 700)
Current Transfers to the
RW (3 165)
Capital Transfers to the RW
(137)
Financial Transactions to
the RW (10 837)
0 Net lending (6 570)
Transactions Value to the
RW (68 024)
Errors and
Omissions 0 0
Trade Margins
(0) 0
Net borrowing
(- 6 570) 0
Net lending
(6 570) 0 0
TOTAL Aggregate Factor income (97 829) Total Costs (203 614) Aggregate Supply (260 340) Aggregate Income (180 646) Aggregate Investment (30 569) Total financial transactions (57 433) Transactions Value from the
RW (68 024)
0
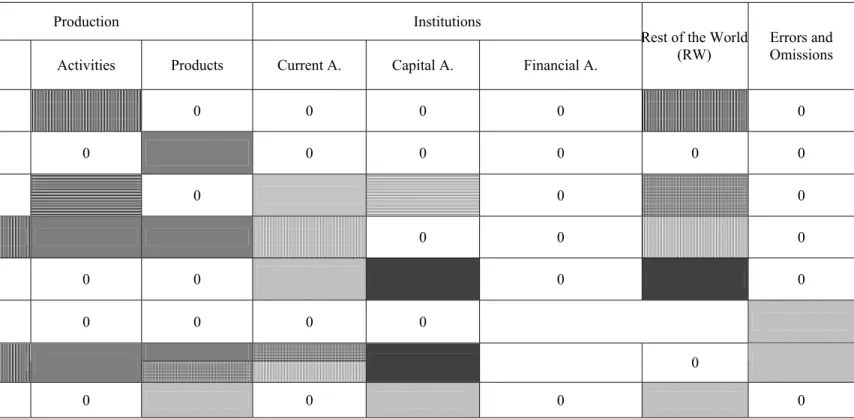
Table 2. Basic Social Accounting Matrix by blocks
Production Institutions Outlays
(expenditures) (j) Incomes
(receipts) (i)
Factors Activities Products Current A. Capital A. Financial A.
Rest of the World (RW)
Errors and Omissions
Factors 0 0 0 0 0 0
Activities 0 0 0 0 0 0 0
Pr
odu
ction
Products 0 0 0 0
Current A. 0 0 0
Capital A. 0 0 0 0 0
In
stitu
tion
s
Financial A. 0 0 0 0 0
Rest of the World 0
Errors and
Omissions 0 0 0 0 0
Blocks:
Compensation of the factors of production Final Consumption Current Transfers
Production Net Indirect Taxes Capital Transfers
Intermediate Consumption Gross Capital Formation Domestic Saving, Trade Margins, Net lending/ borrowing
External Trade Financial Transactions
2.2. The SAM as a complete account of the circular flow in the economy
As far as the flows of money are concerned, the following outline gives us the connections that can be established between the various accounts.
Outline 1: Flows of money between the basic Portuguese SAM accounts
DOMESTIC ECONOMY
This outline represents all the transactions recorded by the SAM, within the (domestic) economy and between it and the rest of the world. The latter are represented by the "rest of the world" account (see Table 1 – 7th column/row), the former are represented by the production and institutional accounts, as described below.
On the one hand, production activities buy "inputs" (intermediate consumption) and factors of production services in order to produce, thereby generating added value. Beyond the subsidies on production (from the government's current account and the rest of the world - European Union institutions), which are deducted from taxes (other net taxes on production), the only receipts of the activities come from the sales of their production which are spent in intermediate consumption, the compensation of factors and the payment of taxes (to the government's current account). Therefore, there is the value of production to balance the total costs of the economy (see the "activities" account, Table 1 – 2ndcolumn/row).
Production
Activities
Products Factors of Production
Production Current Account Capital Account Domestic Saving
REST OF THE WORLD Imports and
net taxes on products
Instit ution s Capital Transfers National Product Compensation of Factors Services (Added Value)
other net taxes on production
Intermediate Consumption
net taxes on products Gross Capital Formation Exports Final Consumption
other net taxes on production
Capital Transfers Current
Transfers Current
On the other hand, the factors of production will sell services to the (domestic and foreign) production activities receiving compensation from these. Since the services of the factors are supplied by (domestic and foreign) institutions, outlays can be made to the domestic institutions (current account), through the national product, as well as to the rest of the world (see the "factors of production" account, Table 1 – 1stcolumn/row).
Beyond the national product, i.e. the compensation of the factors of production, the other income sources of the institutions are (net indirect) taxes and current transfers, as can seen by its "current account", which also shows how the income is spent in final consumption and current transfers or is saved (see Table 1 – 4th column/row).
Through the "products" accounts, there is both supply and demand. As sources of demand, there is intermediate consumption, final consumption, gross capital formation and exports. On the supply side, we have production and imports, to which are added the (net) taxes on products and the trade margins (see Table 1 – 3rd column/row). The products accounts can be seen as the accounts of those that perform intermediation activities and place products on the market, in other words, those that acquire or import products, organise processing (transport and storage), add the corresponding margins to the price, pay indirect taxes to the government and sell the products to the producers, households, government and the rest of the world.
In the "capital account", or capital accumulation account, on the one hand, we can see investment through gross capital formation and capital transfers, and, on the other hand, the funds available for such investments, resulting from domestic saving and capital transfers, as well as from a balance corresponding either to the financing requirements or capacity, depending on its sign (see Table 1 – 5th column/row).
Among other aspects, the "financial account" reveals the financial transactions in the capital account (King, 1981) (see Table 1 – 6th column/row).
Besides all the accounts already mentioned, there is also the "errors and omissions" account, introduced because of the need to consider the balances of financial and capital transactions, on the one hand, and trade margins, on the other hand.
It is also important to bear in mind that "a SAM applies the properties of a matrix format to incorporate specific details on various economic flows" (ISWG, 1993, Prg. 20.26).
2.3. Possible disaggregations
It is possible to break down each account into categories using on occasion sources of information other than the SNA, without losing the consistency of the whole system, that is to say, "a crucial feature is the wide range of possibilities for expanding or condensing such a matrix in accordance with specific circumstances and needs" (ISWG, 1993, Prg. 20.6).
Nowadays, the SNA provides several disaggregation possibilities for products and activities, few possibilities for the institutions' accounts and even fewer for the factors of production2.
Therefore, production accounts, drawn from supply and use tables, can be disaggregated into 95 activities and products, which for some transactions can have yet more disaggregation levels.
Also in relation to production accounts, the factors of production may only be disaggregated into labour and capital, although the former refers only to employees.
In turn, the institutions' accounts can be disaggregated into households, non-financial corporations, financial corporations, general government and non-financial corporations serving households. General government can be disaggregated further into central government, local government and social security funds, whilst financial corporations can be disaggregated into central bank, other monetary financial institutions, other financial intermediaries, except insurance corporations and pension funds, financial auxiliaries and insurance corporations and pension funds.
The rest of the world can also be disaggregated into the European Union (member states and institutions) and non-member countries and international organisations.
2.4. Identifying the identities and balances of the various internal accounts of the SNA in the aggregate SAM
Considering the SNA as the basic information source of the SAM, almost all the flows that are part of the former are integrated into the latter.
The SNA adopted in Portugal since 1995 has been the European System of National and Regional Accounts in the European Community of 1995 - ESA 95 (Eurostat, 1996), which is based on the 1993 version of the International United Nations System of National Accounts - SNA 93, prepared by the Inter-Secretariat Working Group and published by the United Nations Statistical Office
2
(ISWG, 1993). For the latter body, "a SAM is defined as the presentation of SNA accounts in a matrix which elaborates the linkages between a supply and use table and institutional sector accounts" (ISWG 93, Prg.20.4).
Next, we are going to identify the identities and balances of the several (T) accounts of the Portuguese SNA in the SAM constructed for Portugal in 19993 (see Tables 1 and 3), each of them referring to an aspect of the economic circuit (see Outline 1). As uses (outlays or expenditures) and resources (incomes or receipts), always recorded in millions of euros, we will use the designations that we used for the various accounts of the SAM. We will add a " ' " to the SAM balances.
We are going to deal with gross balances and will not therefore take into account the consumption of fixed capital. We will also work upon the goods and services account, at current prices, the current accounts and the accumulation accounts (with the exception of SNA account III.3 - other changes in assets accounts), which are the accounts made available by the Portuguese National Accounts.
Goods and Services Account (SNA account 0) - balanced by definition:
Resources
Output of goods and services... 203 614 Imports of goods and services... 43 293 Taxes on products net of subsidies ... 15 217 Total ... 262 124
Uses
Intermediate consumption... 110 801 Final consumption expenditure/ actual final consumption ... 88 648 Gross capital formation... 30 585 Exports of goods and services... 32 089 Total ... 262 124
This account can be associated with the SAM's "products" account, belonging to the group of "production" accounts.
Thus:
Resources
Intermediate consumption... 110 801 Final consumption expenditure/ actual final consumption of the national
institutions in the economy ... 86 864 Gross capital formation... 30 585 Exports of goods and services... 32 089 Aggregate demand ... 260 340
3
Uses
Output of goods and services... 203 614 Taxes on products received by the national institutions net of subsidies ... 15 025 Imports of goods and services plus taxes, minus subsidies on products
received by the European Union institutions ... 41 700 Aggregate supply ... 260 340
The difference between both accounts is in the "direct purchases abroad by residents" (1 784), considered in the SAM as a "current transfer to the rest of the world".
Production Account (SNA account I) - which describes the transactions that constitute the appropriately named production process:
Resources
Output of goods and services... 203 614 Taxes on products net of subsidies ... 15 217 Total ... 218 831
Uses
Intermediate Consumption... 110 801 (B1g) Gross added value/gross domestic product ... 108 030 Total ... 218 831
We identified this account with the SAM's "activities" account:
Resources
Output of goods and services... 203 614
Uses
Intermediate consumption... 110 801 Taxes on production net of subsidies...- 895
- receipt/expenditure of the (Portuguese) General Government ... -832 - receipt/expenditure of the Institutions of the European Union ..…. -63
(B1g') Gross added value ... 93 707 Total costs (net of subsidies on production) ... 203 614
We have, therefore, a gross added value (B1g') corresponding to gross domestic product at market prices (B1g) minus net indirect taxes (on products and production). In other words, gross added value at factor cost (93 707 = 108 030 - (15 217- 895)).
- Generation of income account (SNA account II.1.1)
Resources
(B1g) Gross added value/gross domestic product ... 108 030
Uses
Compensation of employees paid by the Portuguese institutions... 52 092
- to the national institutions ……… 51 973
- to the rest of the world ………. 119
Taxes on production and imports net of subsidies
paid / received by the Portuguese institutions ... 14 322 (B2g + B3g) Gross operating surplus + Gross mixed income ... 41 615 Total ... 108 030
- Allocation of primary income account (SNA account II.1.2)
Resources
(B2g + B3g) Gross operating surplus + Gross mixed income ... 41 615 Compensation of employees received by the Portuguese institutions ... 51 120
- from the Portuguese institutions ………... 51 973
- from the rest of the world ……… 147
Taxes on production and imports net of subsidies
received/ paid by the Portuguese institutions ... 14 193 Property income received by the Portuguese institutions ... 23 417
- from the Portuguese institutions ………..………...……… 19 442
- from the rest of the world ……… ………. 3 975
Total ... 131 345
Uses
Property income paid by the Portuguese institutions... 25 000
- to the Portuguese institutions ………...……… 19 442
- to the rest of the world ………. 5 559
(B5g) Gross national income ... 106 345 Total ... 131 345
- Primary distribution of income account (generation and allocation - SNA account II.1)
Resources
(B1g) Gross added value/gross domestic product ... 108 030 Property income received by the Portuguese institutions from the Portuguese
institutions ... 19 442 Primary income from the rest of the world ... 4 122
- compensation of employees ……… 147
- property income ……….. 3 975
Total ... 131 593
Uses
(B5g) Gross national income ... 106 345 Property income paid by the Portuguese institutions to the Portuguese
Primary income to the rest of the world ... 5 807
- compensation of employees ……… 119
- property income ………...……….. 5 559
- net taxes on production and imports ...……….………... 129
Total ... 131 593
We can associate these accounts with the SAM's "factors of production" account that has the following composition:
Resources
(B1g') Gross added value ... 93 707 - Labour (wages and salaries paid by the Portuguese institutions) ... 41 174
- Capital ((B2g' + B3g') Gross operating surplus +
Gross mixed income ……….……. 52 534
Compensation of factors from the rest of the world ……….. 4 122
- Labour (wages and salaries) ………...… 147
- Capital ……….. ………... 3 975
Aggregate Income of Factors... 97 829
Uses
(B5g') National product ... 92 152 - Labour (wages and salaries received by the Portuguese
institutions) ……….… 41 202
- Capital ……….... 50 950
Compensation of factors to the rest of the world ... 5 678
- Labour (wages and salaries) ………...… 119
- Capital ……….. ………. 5 559
Aggregate Income of Factors... 97 829
In establishing the connection between those accounts, we have:
National product (B5g') = Gross national income (B5g) – taxes on production and imports net of subsidies received/paid by the Portuguese institutions (92 152 = 106 345 – 14 193).
On the other hand:
Compensation of capital received by the national institutions = (Gross operating surplus + Gross mixed income (B2g' + B3g') - Employers' social contributions4 ) + compensation of capital (or property income) paid by the rest of the world - compensation of capital (or property income) received by the rest of the world = Gross operating surplus + Gross mixed income (B2g + B3g) + compensation of capital (or property income) paid by the rest of the world - compensation of capital (or property income) received by the rest of the world (50 950 = (52 534 – 10 918) + 3 975 – 5 559 = 41 615 + 3 975 – 5 559)
4
Employers' social contributions + wages and salaries = compensation of employees.
Secondary Distribution of Income, Redistribution of Income in Kind and Use of Income Accounts. The first two accounts show how the balance of primary incomes (national income) is transformed into disposable income by the receipt and payment of current transfers; the third account shows how the gross disposable income is distributed between the final consumption and saving.
- Secondary distribution of income and redistribution of income in kind accounts (SNA accounts II.2 and 3)
Resources
(B5g) Gross national income ... 106 345 Current transfers within the Portuguese institutions5 ... 72 728 Current transfers from the rest of the world5... 4 827 Total ... 183 900
Uses
Current transfers within the Portuguese institutions6 ... 72 728 Current transfers to the rest of the world6... 1 381 (B6/7g) Gross disposable income ... 109 791 Total ... 183 900
- Use of income account (SNA account II.4)
Resources
(B6/7g) Gross disposable income ……….. 109 791 Adjustment for the change in the net equity of households in pension funds
reserves ………... 413 Total ……….. . 110 204
Uses
Final consumption ... 88 648 Adjustment for the change in the net equity of households in pension funds
reserves ... 413 (B8g) Gross saving ... 21 143 Total ... 110 204
Here is the SAM's "current" account of the Institutions:
5
Total Current transfers (resources) = 72 728 + 4 827 = 77 555:
Current taxes on income, wealth, etc., received by the Portuguese institutions ... 10 606 Social contributions and benefits, received by the Portuguese institutions...45 529
- Social contributions ………. …... 15 509 - Social benefits other than social transfers in kind ……….…………. … 15 651 - Social transfers in kind... 14 369 Other current transfers, received by the Portuguese institutions ...21 419
6
Total current transfers (uses) = 72 728 + 1 381 = 74 109:
Current taxes on income, wealth, etc., paid by the Portuguese institutions...10 606 Social contributions and benefits, paid by the Portuguese institutions ...45 548
- Social contributions …... 15 509 - Social benefits other than social transfers in kind ………..… 15 670 - Social transfers in kind ... ………... 14 369
Resources
(B5g') National Product ... 92 152
- wages and salaries ………….……… ... 41 202
- compensation of capital ……….……….…………...…. 50 950
Net taxes on production paid to the Portuguese institutions ...- 832 Net taxes on products paid to the Portuguese institutions ... 15 025 Current transfers within the Portuguese institutions ... 69 474 Current transfers from the rest of the world... 4 827 Aggregate income ... 180 646
Uses
Final consumption in the economy ... 86 864 Current transfers within the Portuguese institutions ... 69 474 Current transfers to the rest of the world ... 3 165
- current transfers to the rest of the world ………... 1 381 - direct purchases abroad by residents ... 1 784 (B8g') Domestic saving ... 21 143 Aggregate income ... 180 646
We have, on the one hand, the SAM's saving (B8g'), which we have called domestic saving, equivalent to the gross saving (B8g), and, on the other hand, the total of the SAM's current account, which we have named aggregate income, corresponding to the sum of the items:
Gross national income (B5g) + current transfers within the Portuguese institutions7 + current transfers from the rest of the world (180 646 = 106 345 + 69 474 + 4 827)
or
Gross disposable income (B6/7g) + current transfers within the Portuguese institutions7 + current transfers to the rest of the world (180 646 = 109 791 + 69 474 + 1 381)
Capital Account (SNA account III.1) – which records non-financial investment transactions and capital transfers, considered as the partition of property transactions:
Changes in liabilities and net worth (resources)
(B8g) Gross saving ... 21 143 Capital transfers within the Portuguese institutions ... 6 416 Capital transfers from the rest of the world ... 3 009 Total ... 30 568
Changes in assets (uses)
Gross capital formation... 30 585 Capital transfers within the Portuguese institutions ... 6 416 Capital transfers to the rest of the world ... 137 - Acquisitions less disposals of non-produced non-financial assets …… 9
(B9) Net borrowing ...- 6 570 Total ... 30 568
7
We have the following SAM's "capital" account:
Changes in liabilities and net worth (resources)
(B8g') Domestic saving ... 21 143 Capital transfers within the Portuguese institutions ... 6 416 Capital transfers from the rest of the world ... 3 009 Investment Funds ... 30 569
Changes in assets (uses)
Gross Capital Formation ... 30 585 Capital transfers within the Portuguese institutions ... 6 416 Capital transfers to the rest of the world ... 137
- Acquisitions less disposals of non-produced non-financial assets …….. 9
(B9') Net borrowing ...- 6 570 Aggregate Investment ... 30 569
There is a close relationship between both capital accounts, the difference between them being only a question of rounding off the calculations.
Financial Account (SNA account III.2) – records the transactions in financial assets and liabilities between institutional units, and between these and the rest of the world:
Changes in liabilities and net worth (resources)
Financial transactions within the Portuguese institutions
(net incurrence of liabilities) ... 46 596 Financial transactions from the rest of the world
(net incurrence of external liabilities) ... 17 407 (B9F) Net borrowing ...- 6 570 Total ... 57 432
Changes in assets (uses)
Financial transactions within the Portuguese institutions
(net acquisition of financial assets) ... 46 596 Financial transactions to the rest of the world
(net acquisition of external assets) ... 10 837 Total ... 57 432
We have the following SAM's "financial" account:
Changes in liabilities and net worth (resources)
Financial transactions within the Portuguese institutions
(net incurrence of liabilities) ... 46 596 Financial transactions from the rest of the world
Changes in assets (uses)
Financial transactions within the Portuguese institutions
(net acquisition of financial assets) ... 46 596 Financial transactions to the rest of the world
(net acquisition of external assets) ... 10 837 Total ... 57 433
Therefore, generally speaking, if it were not for the taxation on production, the association of SAM accounts with national (T) accounts would be perfect – with the aggregate SAM being calculated from these accounts, the latter could also be calculated from the former, which may not be true if some disaggregation is undertaken.
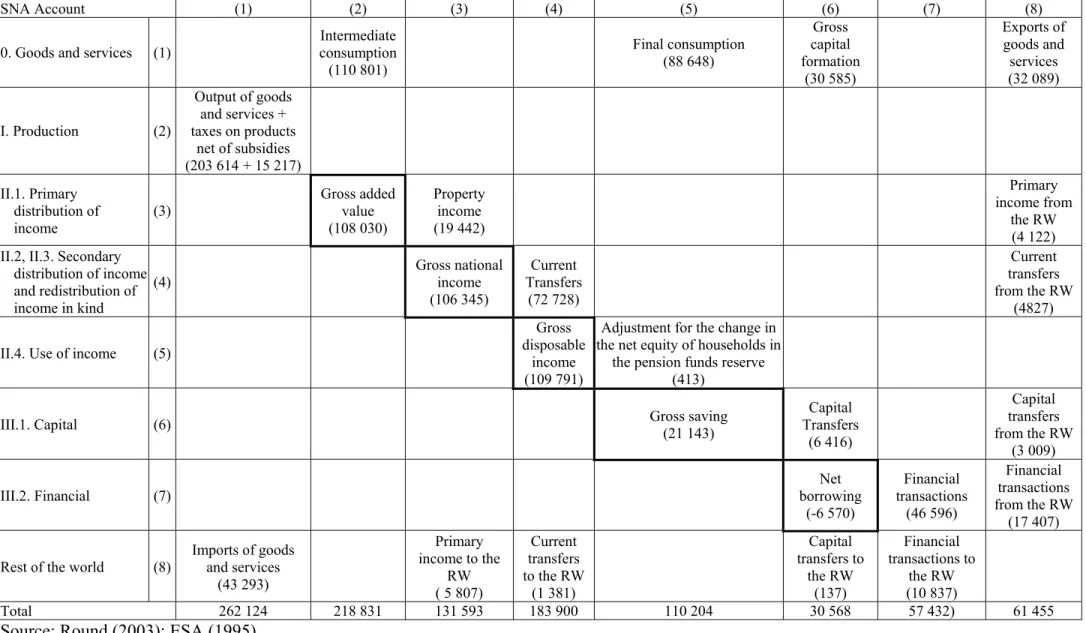
Table 3. Basic Portuguese National Accounting Matrix (NAM) for 1999 (in millions of euros)
SNA Account (1) (2) (3) (4) (5) (6) (7) (8)
0. Goods and services (1)
Intermediate consumption (110 801) Final consumption (88 648) Gross capital formation (30 585) Exports of goods and services (32 089)
I. Production (2)
Output of goods and services + taxes on products
net of subsidies (203 614 + 15 217)
II.1. Primary distribution of income (3) Gross added value (108 030) Property income (19 442) Primary income from the RW (4 122) II.2, II.3. Secondary
distribution of income and redistribution of income in kind
(4) Gross national income (106 345) Current Transfers (72 728) Current transfers from the RW
(4827)
II.4. Use of income (5)
Gross disposable
income (109 791)
Adjustment for the change in the net equity of households in
the pension funds reserve (413)
III.1. Capital (6) Gross saving
(21 143) Capital Transfers (6 416) Capital transfers from the RW
(3 009)
III.2. Financial (7)
Net borrowing (-6 570) Financial transactions (46 596) Financial transactions from the RW
(17 407)
Rest of the world (8)
Imports of goods and services
(43 293)
Primary income to the
RW ( 5 807)
Current transfers to the RW
(1 381) Capital transfers to the RW (137) Financial transactions to the RW (10 837)
Total 262 124 218 831 131 593 183 900 110 204 30 568 57 432) 61 455
2.5. Specifying the SAM's blocks of sub-matrices and their cell contents
Next can be seen all the specificities of the SAM's sub-matrices with common characteristics, i.e. the SAM's blocks, as defined in Table 2. The transactions of the National Accounts will be specified, as well as the (National Accounts) tables, which are the sources of information used to construct the SAMs. The cell contents (i, for rows; j, for columns) will also be specified, as well as the method of calculation used only for those sub-matrices that are not calculated directly from the sources or whenever there are details that justify a reference to them.
2.5.1. Compensation of factors of production
Income of the institutional sectors from the compensation of the services provided through their real and financial assets to the activities of production and to the rest of the world, namely:
− Wages and salaries, in cash and in kind (transaction D11 of the National Accounts), which is the
remuneration, in cash or in kind, payable by an employer to an employee in return for work done by the latter during the accounting period8 (ISWG 93, Prg.7.32-7.42; ESA 95, Prg.4.03-4.07).
− All the above-mentioned income which is not derived from the compensation of employees,
including property income (transaction D4 of the National Accounts), which is the income receivable by the owner of a financial asset or a tangible non-produced asset in return for providing funds to, or putting the tangible non-produced asset at the disposal of, another institutional unit. Property income is composed of interest, the distributed income of corporations, dividends, withdrawals from the income of quasi-corporations, reinvested earnings on direct foreign investment, property income attributed to insurance policy holders and rents (ISWG 93, Prg.7.87-7.133; ESA 95, Prg.4.41-4.76).
Sources
Tables: production account and allocation of primary and secondary distribution income accounts of the institutions (in institutional sectors accounts); employment and compensation of employees by activity; external account of primary income and current transfers (in rest of the world accounts).
Methodology
The compensation of capital in the added value submatrix is calculated through the difference between the total costs, which are equal to the production value, and the other net taxes on production, intermediate consumption and wages and salaries. In the national product submatrix, it
8
is the sum of the gross operating surplus and the balance of the income from property. The gross operating surplus is gross added value (production minus intermediate consumption) minus the (other) taxes paid on production plus the (other) subsidies received on production minus the paid wages and salaries.
Cell contents
Compensation of factors of production i received from the activity j or from the rest of the world; compensation of factors of production j received by the institutional sector i or by the rest of the world.
2.5.2. Production
Output of goods and services (transaction P1 of the National Accounts), which consists of the products created during the accounting period and is subdivided into market output, output produced for own final use, other non-market output (ISWG 93, Prg.6.38-6.51; ESA 95, Prg.3.14-3.68).
Source
Table: supply of products at basic prices (current prices).
Cell contents
Output of j product(s) through the i activity/ies, with: j = i or j≠i.
2.5.3. Intermediate Consumption
Intermediate consumption (transaction P2 of the National Accounts), which consists of the value of the goods and services consumed as inputs by a process of production, excluding those fixed assets whose consumption is recorded as consumption of fixed capital. The goods and services may be either transformed or used up by the production process (ISWG 93, Prg.6.147-6.178; ESA 95, Prg.3.69-3.73).
Source
Table: use of products at basic prices (current prices).
Cell contents
2.5.4. Gross Capital Formation
Gross capital formation (transaction P5 of the National Accounts), which consists of gross fixed capital formation, changes in inventories, acquisitions less disposals of valuables (ISWG 93, Prg.10.32-10.130; ESA 95, Prg. 3.100-3.127).
Sources
Tables: use of products at basic prices (current prices); capital account of the institutions (in institutional sectors accounts); gross fixed capital formation by product and institutional sector.
Methodology
The total gross capital formation by product(s) is calculated from the use of products table.
The total gross capital formation by institution(s) is calculated from the capital account of the institutions table.
The gross fixed capital formation by product(s) and institution(s) is calculated from the table with the same name.
The changes in inventories and the acquisitions less disposals of valuables by product(s) and institution(s) are calculated by applying the share of the product(s) in the total to the total value of the institution(s).
Cell contents
Gross Capital Formation on product(s) i by the institution(s) j.
2.5.5. Net Indirect Taxes
2.5.5.1. Net Taxes on Production
Sources
Tables: allocation of primary income account of the institutions (in institutional sectors accounts); external account of primary income and current transfers account (in rest of the world accounts); use of products at basic prices (current prices).
Methodology
The totals by activity/ies are calculated from the use of products table.
The totals for the government and for the rest of the world are calculated from the table showing the allocation of the primary income account of the institutions (the totals for the rest of the world may also be calculated from the external account of the primary income and current transfers account, and this must be the case if some disaggregation is needed).
The values by activity/ies for the rest of the world are calculated by applying the share of the activity/ies in the total to the total value of the rest of the world. The values (by activity/ies) for the government are calculated by the difference between the total (by activity/ies) and the rest of the world's value.
Cell contents
Other taxes on production paid by j activity/ies minus other subsidies on production received by the same activit/ies from i institution(s) (government or rest of the world), or (other) net taxes on production paid by j activity/ies to i institution(s).
2.5.5.2. Net Taxes on Products
Taxes on products (transaction D21 of the National Accounts) minus the subsidies on products (transaction D31 of the National Accounts). The former consist of taxes that are payable per unit of a good or service produced or transacted (ISWG 93, Prg.7.62-7.69; ESA 95, Prg.4.16-4.21), these being paid to the government and the rest of the world. The latter consist of subsidies payable per unit of a good or service produced or imported (ISWG 93, Prg.7.73-7.78; ESA 95, Prg.4.33-4.35), received from the government and the rest of the world (European Union Institutions).
Sources
Tables: allocation of primary income account of the institutions (in institutional sectors accounts); external account of primary income and current transfers account (in rest of the world accounts); supply of products at basic prices (current prices).
Methodology
The totals for the government and for the rest of the world are calculated from the table showing the allocation of the primary income account of the institutions (the totals for the rest of the world may also be calculated from the external account of the primary income and current transfers account, and this must be the case if some disaggregation is needed).
The values by product(s) for the rest of the world, which will be added to the imports (external trade block), are calculated by applying the share of the product(s) in the total to the total value of the rest of the world. The values (by product(s)) for the government are calculated by the difference between the total (by product(s)) and the rest of the world's value.
Cell contents
Taxes on j product(s) received by i institution(s) (government or rest of the world) minus subsidies on those products received from the same institution(s), or net taxes on j product(s) received by i
institution(s).
2.5.6. Final Consumption
Actual final consumption (transaction P4 of the National Accounts) consists of the goods or services that are acquired by resident institutional units for the direct satisfaction of human needs, whether individual or collective. Goods and services for individual consumption (individual goods and services) are acquired by a household and used to satisfy the needs and requirements of members of that household. Services for collective consumption (collective services) are provided simultaneously to all members of the community or all members of a particular section of the community, such as all households living in a particular region9 (ISWG 93, Prg.9.72-9.74, 9.90-9.92, 9.95-9.97; ESA 95, Prg.3.81-3.99).
Direct purchases abroad by residents are considered in current transfers to the rest of the world (current transfers block).
Direct purchases by non-residents in the domestic market are considered as exports (external trade block).
Sources
Tables: use of products at basic prices (current prices); use of the adjusted disposable income and the redistribution of income in kind accounts of the institutions (in institutional sectors accounts).
9
Methodology
Because the available information by product and institution is supplied by the use of products table and refers to expenditure on final consumption, if some disaggregation is needed, the actual final consumption has to be determined by adding the social transfers in kind to the final consumption expenditure of the households and deducting the same transfers from the final consumption expenditures of the government and non-profit institutions serving households.
Cell contents
j institution’s actual final consumption of i products.
2.5.7. External Trade
Transactions in goods and services (purchases, barter, gifts or grants) from non-residents to residents, or imports (transaction P7 of the National Accounts), and from residents to non-residents, or exports (transaction P6 of the National Accounts) (ESA 95, Prg.3.128-3.14610).
Although the National Accounts consider direct purchases abroad by residents as an import, here they are considered as a current transfer from households to the rest of the world.
Sources
Tables: supply of products at basic prices (current prices), for imports; use of products at basic prices (current prices), for exports.
Cell contents
Imports of j products; exports of i products
2.5.8. Current Transfers
Current taxes on income, wealth, etc. (transaction D5 of the National Accounts), which cover all compulsory, unrequited payments, in cash or in kind, levied periodically by general government and by the rest of the world on the income and wealth of institutional units, as well as some periodic taxes which are levied on neither income nor wealth (ISWG 93, Prg.8.43-8.54; SEC 95, Prg.4.77-4.82).
Social benefits and contributions (transaction D6 of the National Accounts). Social benefits are transfers to households, in cash or in kind, intended to relieve them of the financial burden of a
10
number of risks or needs, made either through collectively organised schemes or outside such schemes by government units and non-profit institutions serving households; they include payments from general government to producers which individually benefit households and which are made in the context of social risks or needs. Social contributions include (employers' and employees') actual social contributions transferred to general government (ISWG 93, Prg.8.67 -8.83 and 8.99-8.106; SEC 95, Prg.4.83-4.108).
Other current transfers (transaction D7 of the National Accounts), which consist of net non-life insurance premiums, non-life insurance claims, current transfers within general government, current international co-operation and miscellaneous current transfers (ISWG 93, Prg.8.84-8.98; SEC 95, Prg.4.109-4.140).
Adjustment made for the change in the net equity of households in pension fund reserves (transaction D8 of the National Accounts), which represents the adjustment needed to cause to appear in the saving of households the change in the actuarial reserves on which households have a definite claim and which are fed by premiums and contributions recorded in the secondary distribution of income account as social contributions (ISWG 93, Prg.9.14-9.20; SEC 95, Prg. 4.141-4.144).
Sources
Tables: secondary distribution of income, redistribution of income in kind and use of adjusted income accounts of the institutions (in institutional sectors accounts); external account of primary income and current transfers account (in rest of the world accounts); "from whom to whom" matrices, made available particularly by the Portuguese Statistical Institute, for the inter-institutional flows.
Cell contents
Current transfers from j institution(s) to i institution(s), with: i = j or i≠j.
2.5.9. Capital Transfers
Capital transfers11 (transaction D9 of the National Accounts), which cover capital taxes, investment grants and other capital transfers (ISWG 93, Prg.10.131-10.141; SEC 95, Prg.4.146-4.167).
Acquisitions less disposals of non-financial non-produced assets (transaction K2 of the National Accounts) - non-financial non-produced assets consist of land and other tangible non-produced
11
assets that may be used in the production of goods and services, as well as intangible non-produced assets (ISWG 93, Prg.10.120-10.130; SEC 95, Prg.6.06-6.13).
Sources
Tables: accumulation accounts of the institutions (in institutional sectors accounts); external accumulation accounts (in rest of the world accounts); "from whom to whom" matrices, made available particularly by the Portuguese Statistical Institute, for the inter-institutional flows.
Cell contents
Capital transfers from j institution(s) to i institution(s), with: i = j or i≠j.
2.5.10. Domestic Saving, Trade Margins, Net lending/borrowing.
All the submatrices of this block are balances; therefore, no mention will be made of either sources or the methodology used for their calculation.
− Domestic saving measures the portion of the aggregate income that is not used for final
consumption expenditure and current transfers to Portuguese institutions or to the rest of the world (saving: ISWG 93, Prg.9.17-9.20; SEC 95, Prg.8.96).
Cell contents: gross savings of institution(s) j ≡ i (the domestic saving matrix is diagonal)
− Trade margins, realised on the goods purchased for resale, are a part of the production of the
wholesale trade services, retail trade services and repair services of motor vehicles, motorcycles and personal and household goods. They are recorded as part of the product trade and are therefore included in the various components of aggregate demand (the total income of the SAM products account). As the latter is equal to aggregate supply (the total outlay of the SAM products account), the difference between this and the total of its components (production, net taxes on products and imports) must be the trade margins, which total zero, since they are negative in relation to the three above-mentioned activities (because the corresponding value has already been recorded in the production submatrix), but positive and having the same amount in relation to all the other ones (ISWG 93, Prg.6.110-6.114, 15.40-15.44; SEC 95, Prg.3.60, 9.38-9.41).
Cell contents: trade margins of j products.
− The net lending (+) or borrowing (-) of the total economy is the sum of the net lending or
opposite mathematical sign, to the net borrowing (-) or lending (+) of the rest of the world (SEC 95, Prg.8.98) .
Cell contents: net lending (+) or borrowing (-) of j institution(s) (for capital account) or i
institution(s) (for financial account).
2.5.11. Financial Transactions (and the impossibility of working with them)
Financial transactions (F1-7 of the National Accounts) are transactions in financial assets and liabilities between institutional units, and between these and the rest of the world. They are classified as monetary gold and special drawing rights, currency and deposits, securities other than shares, loans, shares and other equity, insurance technical reserves, other accounts receivable/payable.
The outlays (expenditures) side of the (financial) account records changes in the assets, i.e. acquisitions less disposals of financial assets. The incomes (receipts) side of the same account records changes in liabilities and net worth, i.e. the incurrence of liabilities less their repayment. The balancing item of the financial account, i.e. the net acquisition of financial assets less the net incurrence of liabilities, is net lending (+)/net borrowing (-) (ISWG 93, Prg.11.1-11.111; SEC 95, Prg.5.01-5.151).
Sources
Tables: financial account of the institutions (in institutional sectors accounts); "from whom to whom" matrices, made available, until 1995, by the Portuguese Statistical Institute, for the inter-institutional flows.
The unavailability12 of these sources made it impossible to work with these transactions in SAMs. The only available information is that of the integrated economic accounts, which only allow for the treatment that is made in Table 1.
Cell contents
Financial transactions from j institution(s) to i institution(s), with: i = j or i≠j.
2.6. A more detailed SAM for Portugal and the description of its cell contents
The SAM presented here as an example was constructed with the aim of studying the effects of changes in the Portuguese government's expenditure and receipts. Other influences affecting its
12
construction were the available data and previous experience in the construction of SAMs (Santos, 1999, 2001, 2003 and 2003a), basically inspired by the works of Graham Pyatt and his associates (Pyatt, 1988 and 1991; Pyatt and Roe, 1977; Pyatt and Round, 1985).
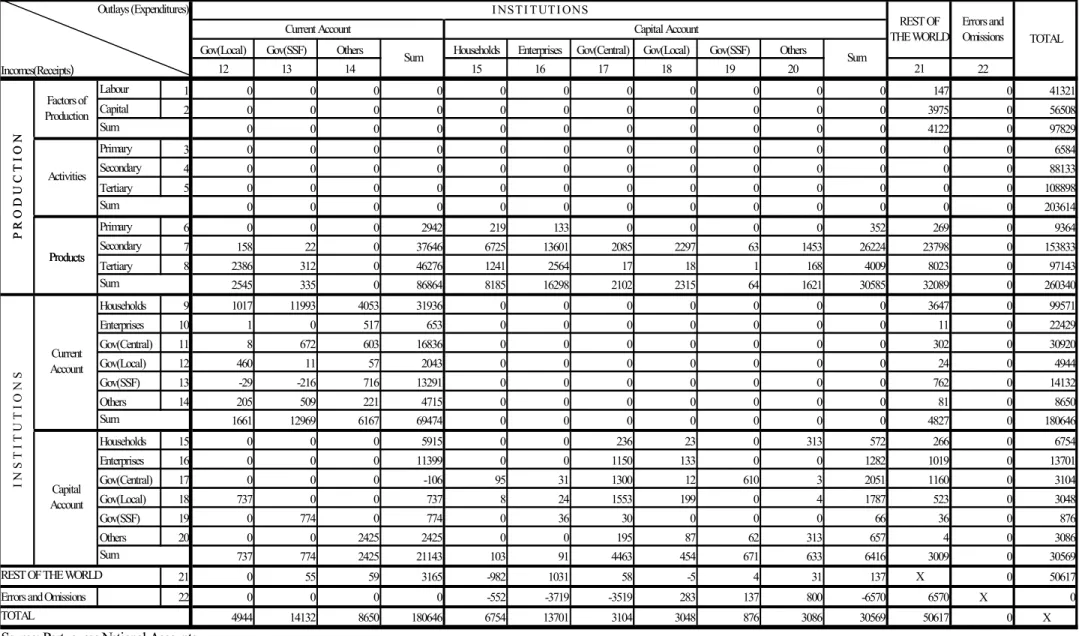
Therefore, further disaggregation was undertaken of the framework described above, always in keeping with the National Accounts Nomenclature. So, in the constructed matrix (see Table 4) the factors of production were disaggregated into labour and capital and the activities and products accounts into primary, secondary and tertiary groups13. On the other hand, the current and capital accounts of institutions were divided into households, enterprises (non-financial corporations), central and local government and social security funds (which constitute the general government), and other institutions (financial corporations and non-profit institutions serving households).
13
Table 4: Portuguese Social Accounting Matrix for 1999 (in millions of euros)
Labour Capital Primary Secondary Tertiary Primary Secondary Tertiary Households Enterprises Gov(Central)
1 2 3 4 5 6 7 8 9 10 11
Labour 1 0 0 0 520 12312 28342 41174 0 0 0 0 0 0 0
Capital 2 0 0 0 3273 16119 33142 52534 0 0 0 0 0 0 0
0 0 0 3792 28431 61484 93707 0 0 0 0 0 0 0
Primary 3 0 0 0 0 0 0 0 6196 362 26 6584 0 0 0
Secondary 4 0 0 0 0 0 0 0 0 87369 763 88133 0 0 0
Tertiary 5 0 0 0 0 0 0 0 8 281 108609 108898 0 0 0
0 0 0 0 0 0 0 6204 88012 109398 203614 0 0 0
Activities
Sum
P
R O D
U C T
I O N
Factors of Production
Sum
Products Incomes(Receipts)
Sum Sum Sum
F a c t o r s of P r o d u ction Products Current Account
Outlays (Expenditures) P R O D U C T I O N I N S T I T U T I O N S
Activities
Primary 6 0 0 0 751 4549 502 5802 0 0 0 0 2942 0 0
Secondary 7 0 0 0 1846 47615 16703 66165 0 0 0 0 36680 0 786
Tertiary 8 0 0 0 400 7739 30696 38835 0 0 0 0 38732 0 4846
0 0 0 2997 59903 47901 110801 0 0 0 0 78353 0 5631
Households 9 41202 22786 63988 0 0 0 0 0 0 0 0 520 1550 12803
Enterprises 10 0 21765 21765 0 0 0 0 0 0 0 0 0 134 2
Gov(Central) 11 0 1206 1206 -174 -171 -413 -758 -229 9596 3968 13334 6240 3458 5855
Gov(Local) 12 0 1218 1218 106 103 251 459 -21 863 357 1199 283 310 922
Gov(SSF) 13 0 121 121 -122 -120 -291 -533 -8 354 146 492 4302 4364 4153
Others 14 0 3854 3854 0 0 0 0 0 0 0 0 1697 1151 933
41202 50950 92152 -191 -187 -454 -832 -258 10813 4471 15025 13042 10968 24668
Households 15 0 0 0 0 0 0 0 0 0 0 0 5915 0 0
Enterprises 16 0 0 0 0 0 0 0 0 0 0 0 0 11399 0
Gov(Central) 17 0 0 0 0 0 0 0 0 0 0 0 0 0 -106
Gov(Local) 18 0 0 0 0 0 0 0 0 0 0 0 0 0 0
Gov(SSF) 19 0 0 0 0 0 0 0 0 0 0 0 0 0 0
Others 20 0 0 0 0 0 0 0 0 0 0 0 0 0 0
0 0 0 0 0 0 0 0 0 0 0 5915 11399 -106
21 119 5559 5678 -14 -14 -34 -63 1936 36829 2936 41700 2261 62 727
Errors and Omissions 22 0 0 0 0 0 0 0 1482 18179 -19662 0 0 0 0
41321 56508 97829 6584 88133 108898 203614 9364 153833 97143 260340 99571 22429 30920
Source: Portuguese National Accounts
REST OF THE WORLD
TOTAL I N S T I T U T I O N S Current Account Sum Capital Account Sum P
R O D
U C T
I O N
Products
Table 4: Portuguese Social Accounting Matrix for 1999 (in millions of euros) (continued)
Gov(Local) Gov(SSF) Others Households Enterprises Gov(Central) Gov(Local) Gov(SSF) Others
12 13 14 15 16 17 18 19 20 21 22
Labour 1 0 0 0 0 0 0 0 0 0 0 0 147 0 41321
Capital 2 0 0 0 0 0 0 0 0 0 0 0 3975 0 56508
0 0 0 0 0 0 0 0 0 0 0 4122 0 97829
Primary 3 0 0 0 0 0 0 0 0 0 0 0 0 0 6584
Secondary 4 0 0 0 0 0 0 0 0 0 0 0 0 0 88133
Tertiary 5 0 0 0 0 0 0 0 0 0 0 0 0 0 108898
0 0 0 0 0 0 0 0 0 0 0 0 0 203614
Sum
Activities
Sum
P
R O D
U C T
I O N
Factors of Production
Products
Current Account
Outlays (Expenditures) I N S T I T U T I O N S
REST OF THE WORLD
Capital Account Errors and
Omissions TOTAL
Incomes(Receipts)
Sum Sum
Primary 6 0 0 0 2942 219 133 0 0 0 0 352 269 0 9364
Secondary 7 158 22 0 37646 6725 13601 2085 2297 63 1453 26224 23798 0 153833
Tertiary 8 2386 312 0 46276 1241 2564 17 18 1 168 4009 8023 0 97143
2545 335 0 86864 8185 16298 2102 2315 64 1621 30585 32089 0 260340
Households 9 1017 11993 4053 31936 0 0 0 0 0 0 0 3647 0 99571
Enterprises 10 1 0 517 653 0 0 0 0 0 0 0 11 0 22429
Gov(Central) 11 8 672 603 16836 0 0 0 0 0 0 0 302 0 30920
Gov(Local) 12 460 11 57 2043 0 0 0 0 0 0 0 24 0 4944
Gov(SSF) 13 -29 -216 716 13291 0 0 0 0 0 0 0 762 0 14132
Others 14 205 509 221 4715 0 0 0 0 0 0 0 81 0 8650
1661 12969 6167 69474 0 0 0 0 0 0 0 4827 0 180646
Households 15 0 0 0 5915 0 0 236 23 0 313 572 266 0 6754
Enterprises 16 0 0 0 11399 0 0 1150 133 0 0 1282 1019 0 13701
Gov(Central) 17 0 0 0 -106 95 31 1300 12 610 3 2051 1160 0 3104
Gov(Local) 18 737 0 0 737 8 24 1553 199 0 4 1787 523 0 3048
Gov(SSF) 19 0 774 0 774 0 36 30 0 0 0 66 36 0 876
Others 20 0 0 2425 2425 0 0 195 87 62 313 657 4 0 3086
737 774 2425 21143 103 91 4463 454 671 633 6416 3009 0 30569
21 0 55 59 3165 -982 1031 58 -5 4 31 137 X 0 50617
Errors and Omissions 22 0 0 0 0 -552 -3719 -3519 283 137 800 -6570 6570 X 0
4944 14132 8650 180646 6754 13701 3104 3048 876 3086 30569 50617 0 X
Source: Portuguese National Accounts
Sum
REST OF THE WORLD
TOTAL Sum I N S T I T U T I O N S Current Account Sum Capital Account P
R O D
U C T
I O N
Description of the SAM cell contents: Row
(i)
Column
(j) Contents
1 3 Wages and salaries paid by primary sector activities
1 4 Wages and salaries paid by secondary sector activities
1 5 Wages and salaries paid by tertiary sector activities
1 21 Wages and salaries paid by the rest of the world (from non-resident employers)
2 3 Gross operating surplus of primary sector activities
2 4 Gross operating surplus of secondary sector activities
2 5 Gross operating surplus of tertiary sector activities
2 21 Property income paid by the rest of the world
3 6 Output of primary sector products through the activities of the same sector 3 7 Output of secondary sector products through the activities of the primary sector 3 8 Output of tertiary sector products through the activities of the primary sector 4 7 Output of secondary sector products through the activities of the same sector 4 8 Output of tertiary sector products through the activities of the secondary sector 5 6 Output of primary sector products through the activities of the tertiary sector 5 7 Output of secondary sector products through the activities of the tertiary sector 5 8 Output of tertiary sector products through the activities of the same sector
6 3 Intermediate consumption of primary sector products through the activities of the
same sector
6 4 Intermediate consumption of primary sector products through secondary sector
activities
6 5 Intermediate consumption of primary sector products through tertiary sector
activities
6 9 Households' actual final consumption of primary sector products
6 15 Gross Capital Formation on primary sector products by the enterprises classified in the household institutional sector
6 16 Gross Capital Formation on primary sector products by non-financial corporations
6 21 Exports of primary sector products
7 3 Intermediate consumption of secondary sector products through primary sector
activities
7 4 Intermediate consumption of secondary sector products through the activities of the
same sector
7 5 Intermediate consumption of secondary sector products through tertiary sector
activities
7 9 Households' actual final consumption of secondary sector products
7 11 Central government's actual final consumption of secondary sector products
7 12 Local government's actual final consumption of secondary sector products
7 13 Social security funds' actual final consumption of secondary sector products
7 15 Gross Capital Formation on secondary sector products by the enterprises classified
in the household institutional sector
7 16 Gross Capital Formation on secondary sector products by the non-financial
corporations
7 17 Gross Capital Formation on secondary sector products by central government
7 18 Gross Capital Formation on secondary sector products by local government
7 19 Gross Capital Formation on secondary sector products by social security funds
7 20 Gross Capital Formation on secondary sector products by financial corporations and
non-profit institutions serving households
Row (i)
Column
(j) Contents
8 3 Intermediate consumption of tertiary sector products by primary sector activities 8 4 Intermediate consumption of tertiary sector products by secondary sector activities
8 5 Intermediate consumption of tertiary sector products by the activities of the same
sector
8 9 Households' actual final consumption of tertiary sector products
8 11 Central government's actual final consumption of tertiary sector products
8 12 Local government's actual final consumption of tertiary sector products
8 13 Social security funds' actual final consumption of tertiary sector products
8 15 Gross Capital Formation on tertiary sector products by the enterprises classified in the household institutional sector
8 16 Gross Capital Formation on tertiary sector products by non-financial corporations
8 17 Gross Capital Formation on tertiary sector products by central government
8 18 Gross Capital Formation on tertiary sector products by local government
8 19 Gross Capital Formation on tertiary sector products by social security funds
8 20 Gross Capital Formation on tertiary sector products by financial corporations and
non-profit institutions serving households
8 21 Exports of tertiary sector products (includes direct purchases in the domestic market by non-residents and the c.i.f./f.o.b. adjustment)
9 1 Wages and salaries received by households
9 2 Gross mixed income plus net property income received by households
9 9 Social benefits other than social transfers in kind and miscellaneous current
transfers within households
9 10 Social benefits other than social transfers in kind and miscellaneous current
transfers from non-financial corporations to households
9 11 Social benefits other than social transfers in kind, social transfers in kind and
miscellaneous current transfers from central government to households
9 12 Social benefits other than social transfers in kind, social transfers in kind and
miscellaneous current transfers from local government to households
9 13 Social benefits other than social transfers in kind and social transfers in kind from social security funds to households
9 14 Social benefits other than social transfers in kind from financial corporations and non-profit institutions serving households to households; social transfers in kind from non-profit institutions serving households to households; non-life insurance claims from financial corporations to households; adjustment for the change in the net equity of households in pension funds
9 21 Social benefits other than social transfers in kind, non-life insurance claims and
miscellaneous current transfers received by households from the rest of the world
10 2 Gross operating surplus plus net property income received by non-financial
corporations
10 10 Miscellaneous current transfers within non-financial corporations
10 11 Miscellaneous current transfers from central government to non-financial
corporations
10 12 Miscellaneous current transfers from local government to non-financial corporations
10 14 Non-life insurance claims and miscellaneous current transfers from financial
corporations to non-financial corporations
10 21 Non-life insurance claims received by non-financial corporations from the rest of
the world
11 2 Gross operating surplus plus net property income received by central government
Row (i)
Column
(j) Contents
government
11 4 Net (other) taxes on production paid by secondary sector activities to central
government
11 5 Net (other) taxes on production paid by tertiary sector activities to central
government
11 6 Net taxes on primary sector products received by central government
11 7 Net taxes on secondary sector products received by central government
11 8 Net taxes on tertiary sector products received by central government
11 9 Current taxes on income, wealth, etc., employees' social contributions, social
contributions by self-employed and non-employed persons and miscellaneous current transfers from households to central government
11 10 Current taxes on income, wealth, etc., and miscellaneous current transfers from non-financial corporations to central government
11 11 Current transfers and miscellaneous current transfers within central government
11 12 Current transfers and miscellaneous current transfers from local government to
central government
11 13 Current transfers and miscellaneous current transfers from social security funds to central government
11 14 Current taxes on income, wealth, etc. paid by financial corporations and non-profit institutions serving households to central government; non-life insurance claims paid by financial corporations to central government; miscellaneous current transfers from financial corporations and non-profit institutions serving households to central government
11 21 Current international cooperation and miscellaneous current transfers from the rest of the world to central government
12 2 Gross operating surplus plus net property income received by local government
12 3 Net (other) taxes on production paid by primary sector activities to local
government
12 4 Net (other) taxes on production paid by secondary sector activities to local
government
12 5 Net (other) taxes on production paid by tertiary sector activities to local government
12 6 Net taxes on primary sector products received by local government
12 7 Net taxes on secondary sector products received by local government
12 8 Net taxes on tertiary sector products received by local government
12 9 Current taxes on income, wealth, etc., employees' social contributions, social
contributions by self-employed and non-employed persons and miscellaneous current transfers from households to local government
12 10 Current taxes on income, wealth, etc., and miscellaneous current transfers from non-financial corporations to local government
12 11 Current transfers from central government to local government
12 12 Current transfers within local government
12 13 Current transfers from social security funds to local government
12 14 Current taxes on income, wealth, etc. paid by financial corporations and non-profit institutions serving households to local government; non-life insurance claims paid by financial corporations to local government; miscellaneous current transfers from financial corporations and non-profit institutions serving households to local government
Row (i)
Column
(j) Contents
13 2 Gross operating surplus plus net property income received by social security funds 13 3 Net (other) taxes on production paid by primary sector activities to social security
funds
13 4 Net (other) taxes on production paid by secondary sector activities to social security funds
13 5 Net (other) taxes on production paid by tertiary sector activities to social security funds
13 6 Net taxes on primary sector products received by social security funds 13 7 Net taxes on secondary sector products received by social security funds 13 8 Net taxes on tertiary sector products received by social security funds
13 9 Employers' and employees' social contributions, social contributions by
self-employed and non-self-employed persons and miscellaneous current transfers from households to social security funds
13 10 Employers' social contributions and miscellaneous current transfers from
non-financial corporations to social security funds
13 11 Employers' social contributions and current transfers from central government to
social security funds
13 12 Employers' social contributions from local government to social security funds 13 13 Employers' social contributions within social security funds
13 14 Employers' social contributions from financial corporations and non-profit
institutions serving households to social security funds
13 21 Current international cooperation from the rest of the world to social security funds 14 2 Gross operating surplus plus net property income received by financial corporations
and non-profit institutions serving households
14 9 Employers' and employees' social contributions, social contributions paid by
self-employed and non-self-employed persons and net non-life insurance premiums received by financial corporations from households; miscellaneous current transfers from households to non-profit institutions serving households
14 10 Employers' social contributions and net non-life insurance premiums received by
financial corporations from non-financial corporations; miscellaneous current transfers from non-financial corporations to financial corporations and non-profit institutions serving households
14 11 Employers' social contributions and net non-life insurance premiums received by
financial corporations from central government; miscellaneous current transfers from central government to non-profit institutions serving households
14 12 Employers' social contributions and net non-life insurance premiums received by
financial corporations from local government; miscellaneous current transfers from local government to non-profit institutions serving households
14 13 Employers' social contributions and miscellaneous current transfers from social
security funds to non-profit institutions serving households
14 14 Employers' social contributions and net non-life insurance premiums paid by
financial corporations and non-profit institutions serving households to financial corporations; non-life insurance claims paid by financial corporations to themselves and to non-profit institutions serving households; miscellaneous current transfers from financial corporations to non-profit institutions serving households and within the latter
14 21 Net non-life insurance premiums and non-life insurance claims received by financial corporations from the rest of the world