Carlos Pestana Barros & Nicolas Peypoch
A Comparative Analysis of Productivity Change in Italian and Portuguese Airports
WP 006/2007/DE _________________________________________________________
Ana S. Branca
The Impact of Cognitive versus Affective Aspects on Consumer Usage of Financial Service Delivery Channels
WP 011/2007/DE _________________________________________________________
Departament of Economics
WORKING PAPERS
ISSN Nº0874-4548
School of Economics and Management
The Impact of Cognitive versus Affective Aspects on Consumer
Usage of Financial Service Delivery Channels
Ana S. Branca
Instituto Superior Técnico / CEG-IST,
Technical University of Lisbon
Av. Rovisco Pais, 1049-001 Lisboa, PORTUGAL
ABSTRACT
This paper explores the consumer decision-making process when using service delivery
channels. Among service delivery channels, the main focus of the research concerns
technology-based delivery channels. Technology continues to change the delivery function of
companies and to affect customers’ usage decisions regarding the delivery channels available.
Understanding how customers react to the technology-content of channels and decide how to
use the delivery channels of the firm is a key asset for achieving profitability and
differentiation. This conclusion is particularly valuable as firms address the financial impact
of new technology-based channels and their success in transferring low value-added
transactions to electronic channels. Despite the development of new technology-based
delivery channels, there is limited knowledge about how customers react to, choose and use
these channels.
The paper addresses this research void by developing a model that describes
customers’ attitudes and usage frequency behavior in the context of banking delivery
channels. A set of hypotheses concerning affective and cognitive determinants of consumers’
behavior is derived from the model. These hypotheses were generated after extensive
research into the fields of services marketing, psychology and innovation theories, together
with insights provided by a series of in-depth interviews conducted with bank managers and
customers. A questionnaire was mailed to users of the four main bank delivery channels. The
findings demonstrate that consumer decision concerning usage frequency differs between
delivery channels, and illustrate which factors should be stressed in order to affect this
decision.
INTRODUCTION
Technology is increasingly transforming the marketplace into a marketspace (Rayport and
Sviokla, 1995), by expanding the delivery channels consumers have available. This
technology infusion in services has changed the nature of service encounters, which are now
conceptualized as “the dynamic relationship between employees, customers, and technology”
(Bitner et al., 2000). The various levels of technology infusion will determine different types
of interaction between a firm and its customers. Conceptually, the delivery channels of a firm
can be categorized according to the type of interaction generated: face-to-face interactions,
Bank interactions through the telephone-based access lie somewhere in the middle, with
moderate personal interaction (when the contact occurs through an human operator) mediated
by a technological device.
Alternatively, Dabholkar (1994) developed a classification scheme for services using
two dimensions: “who delivers and where is the service delivered?”. According to this
scheme, one could think of branch interactions as person-to-person contacts at the service
site, of ATM interactions as person-to-technology contacts at the service site (which
nowadays corresponds to a multitude of locations), of phone interactions as person-to-person
or person-to-technology contacts (depending on the answering system) at customer’s
home/work, and of Internet interactions as person-to-technology contacts at customer’s
home/work. As such, the technology-based delivery channels for the banking industry that
are discussed in the paper correspond to remote interactions mediated by technology, that is,
interactions between a bank and its customers occurring through the ATM network, the
telephone-based and the Internet-based access. The branch interactions are also covered.
Although there are four channels presented, the research and its results are to be analyzed on
a channel basis.
As the main purpose of the research is to understand the determinants of consumers’
usage decisions concerning the frequency with which technology-based delivery channels are
used, two streams of research are combined: consumers’ adoption of innovations and
individual consumption behavior.
Traditionally, consumers’ adoption of innovations is explained with cognitive,
rational reasoning (thinking). Cognitive determinants of adoption behavior are based on
beliefs about the attributes of a product/object or about the consequences of a behavior. In
this study, a model is proposed and tested that considers not only cognitive, but also affective
(feeling), emotional factors to explain consumers’ adoption of innovations. Affective
determinants of adoption behavior are based on the positive/negative feelings that interaction
with an object, or that a behavior, provoke. Additionally, individual consumption has been
found to be determined not only by utilitarian reasons, but also by an experiential perspective
(McGregor, 1974; Holbrook and Hirschman, 1982), in which pursuit of fun and enjoyment
directs customers’ behavior. So, a further objective is to find out if the experiential
perspective can be extended to the use of technology-based delivery channels.
The target behavior of the study is the usage frequency with which a delivery channel
is adopted for interaction with the firm. It is assumed that the usage frequency decision will
service operations available in the main delivery channels of the firm. It is not intended to
study the determinants of channel choice, but rather the determinants that explain why, within
a particular delivery channel, users of that channel adopt more or less frequently the channel.
It is considered that the need to perform a banking transaction can be satisfied through more
than one channel: using a specific delivery channel to satisfy that need will also depend on
how the customer relates to that channel (cognitively and affectively).
This research is valuable for managers in a time when the strategic and financial
importance of increasing usage of remote channels is stressed, together with decreasing usage
of channels based on face-to-face interactions (especially for low value-added operations).
Researchers examining the trade-off between ‘high tech’ versus ‘high touch’ channels,
argued that the former are effective for cost reduction and the latter for relationship building
(Heute and Roth, 1988; Apte and Vepsalainen, 1993; Heim and Sinha, 2000; Walker et al.,
2002). Consequently, there is interest in finding out the relevant predictors of usage
frequency for a specific delivery channel. Service delivery channels poorly designed that are
not able to stimulate a desired increase in usage will reflect high costs without reaching the
target audiences. Therefore, this information will increase companies’ effectiveness and
efficiency in addressing different customer profiles, while enhancing usage of
technology-based service deliveries.
Research has been sparse concerning self-service technologies, as the emphasis has
been to study customer behavior in terms of interpersonal interactions. In the literature,
constant calls have been made for further research on technology-based delivery channels
(Steenkamp et al., 1999; Bitner et al., 2000; Eroglu et al., 2000; Meuter et al., 2000;
Henderson and Kunz, 2001). As a result, this study attempts to contribute to a better
understanding of the consumer/company interaction in the presence of remote channels. The
banking industry was chosen to test the proposed relationships, as it is a service industry with
several delivery channels available for the same set of operations and in which there are
constant efforts to transfer low value-added transactions from the branches to the remote
delivery channels.
LITERATURE REVIEW
The literature streams of marketing and social psychology provide the theoretical background
Technology
Channel technologies, through their impact on firms’ delivery systems, represent a major
stake for service providers (Roth and Velde, 1989; Dabholkar, 1996). The context in which
decisions are taken is changing, as technology developments increasingly allow for remote
service encounters. Additionally, these new delivery options parallel market social trends.
The replacement of human service by a technology usually requires both the development of
new knowledge and behavior associated with the service, and also increased customer
participation and responsibility in the production of the service. Concerning financial
services, information technology is fundamentally changing the financial services industry
worldwide, altering traditional definitions of product, market and customer base (Pyun et al.,
2002). How customers react to this ‘technology infusion’ (Bitner et al., 2000) is something
that needs to be understood so that firms may benefit from the technological element in their
service provision.
Banks and other financial institutions had assumed that customers would accept and
prefer less personal attention and learn the new systems. Customers’ attitudes toward
technology and financial services delivery are changing (Harden, 2002). Some customer
segments are becoming more technically and financially savvy, which motivates them to
self-manage their financial investments (Devlin, 1995; Kimball et al., 1997; Mulligan and
Gordon, 2002) and to use self-service delivery channels. However, evidence suggests that
fewer customers than anticipated have accepted the banks’ perspective and embraced the new
technologies (Sarel and Marmorstein, 2002).
The potential success of self-service technologies depends of customers’ acceptance.
This has led researchers to consider self-service technologies as a ‘double-edged sword’ (Lee
and Allaway, 2002; Walker et al., 2002), and as involving ‘technology paradoxes’ (Mick and
Fournier, 1998). Successful self-service technologies improve service firms’ resource
management by lowering delivery costs and releasing service personnel to provide more
varied and better service (Berry, 1985), but unsuccessful ones add nothing but extra fixed and
operational costs (Lee and Allaway, 2002).
Consumer Behavior
There is debate in the consumer behavior literature over which component(s), cognitive
and/or affective, induces behavior and, for a long time, the prevailing opinion was that
cognitive processes were the trigger to attitude formation and behavior (Fishbein and Ajzen,
on the assumption that all behavior involves a choice and that individuals are quite rational,
making systematic use of the information available.
This cognitive emphasis has been questioned by other researchers who consider that
cognitive evaluations are important, but are not the sole influence on behavior, and that under
different circumstances, individuals might develop other attitude formation processes
(Bettman, 1982; Holbrook and Hirschman, 1982; Zajonc and Markus, 1982; Gatignon and
Robertson, 1985). For these researchers, cognitive and affective factors may interplay in a
variety of combinations and dominances.
As this research covers behaviors that are considered innovative (usage of
technology-based service deliveries), and that might be explained with either a general or
with a more specific model, consumer adoption models were also reviewed. Models such as
the Technology Acceptance Model (Davis et al., 1989), the Innovation Diffusion Theory
(Rogers, 1995), and Gatignon and Robertson’s Diffusion and Adoption Model (1985) have
been developed to explain consumers’ adoption of innovations. These models are based on a
cognitive appraisal, favoring the attributes pertaining to the characteristics of an innovation as
the determining factors of its adoption. Dabholkar (1996) studying service quality found that
consumers deal with unfamiliar or new situations, such as technology self-service options, in
a rational and cognitive way. Parasuraman (2000) proposed the ‘Technology Readiness
Scale’ to represent people’s propensity to embrace and use new technologies for
accomplishing goals. Although this construct is intended to reflect an overall state of mind, it
favors in its components a cognitive evaluation. Similarly, the empirical studies reported on
the adoption of innovations tend to concentrate on cognitive determinants.
MODEL DEVELOPMENT
Based on the literature reviewed, a model is proposed to explain consumer decisions on usage
of technology-based channels. It is assumed that consumer behavior is driven by cognitive
and affective factors. While conclusions from the theories reviewed favor a cognitive-based
evaluation of new technologies, research has also produced examples of the importance of
affect as a behavior determinant (Mehrabian and Russel, 1974; Black et al., 2002). The
combined analysis of these two streams (cognitive and affective-based evaluations) has not
yet been researched for technology-based service deliveries and for their preference over
by attending to only one of them is to neglect important aspects of the consumer psyche
(Olshavsky and Granbois, 1979; Holbrook et al., 1984). Playful consumption has been
studied in relation to hobbies (Bloch and Bruce, 1984), creativity (Hirschman, 1983), leisure
activities (Unger and Kernan, 1983), games (Holbrook et al., 1984), and aesthetic
appreciation (Osborne, 1979). It is intended to extend this perspective to technology.
Interaction with technology-based devices or interfaces can be both a rational and an
affective decision. One can have a preference for the net utility benefits and/or for the playful
aspect embodied in technology as the input(s) for this interaction. Holbrook and Hirschman
(1982) proposed the experiential perspective, in which the consumer is directed by an
hedonic pursuit of pleasure, seeking fun, amusement, fantasy, and enjoyment (or
alternatively, consumers can derive value from avoidance of negative feelings). The logic
behind this perspective of consumer behavior is that consumers appreciate an object for its
own sake, apart from any utilitarian function it may or may not perform.
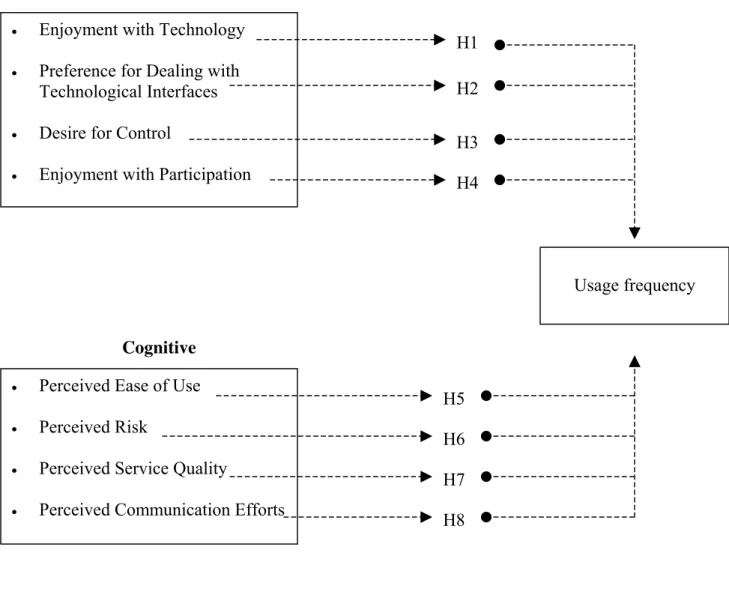
As such, a model (Figure 1) explaining consumers’ decisions on usage frequency of
technology-based delivery channels is proposed, with both cognitive and affective
determinants. The specific factors tested as predictors derive from the literature reviewed and
from a series of in-depth interviews with bank customers and managers. The factors tested as
cognitive influences on usage decision are perceived ease of use, perceived risk, perceived
service quality and perceived communication efforts. These cognitive determinants describe
perceptions about the attributes of the delivery channels, or about the firm, and are rationally
evaluated by customers, weighting the pros and the cons. Similarly, the factors tested as
affective determinants are enjoyment with technology, preference for dealing with
technological interfaces, desire for control and enjoyment with participation. This set of
affective determinants corresponds to feelings, that is, emotional sensations that result from
the interaction with delivery channels. It is recognized that the list of tested determinants
could be extended. Nevertheless, this set was considered the most appropriate considering the
Figure 1: Model of consumers’ usage frequency decision of service delivery channels
Affective
H7
Cognitive
Affective Determinants
Enjoyment with technology
A number of researchers have approached the issue of how consumers deal emotionally with
technology, namely self-service interfaces. Langeard, Bateson, Lovelock, and Eiglier (1981)
found that some people enjoy playing with machines and suggested that these people may
prefer self-service options. Dabholkar (1996) found a positive relationship between expected
enjoyment from using a technology-based self-service option and expected service quality.
Meuter, Ostrom, Bitner, and Roundtree (2003) suggested that customers have to feel
• Enjoyment with Technology
• Preference for Dealing with Technological Interfaces
• Desire for Control
• Enjoyment with Participation
• Perceived Ease of Use
• Perceived Risk
• Perceived Service Quality
• Perceived Communication Efforts
Usage frequency H1
H2
H3
H4
H5
H6
H7
technology anxiety construct, focusing on a user’s state of mind about general technology
tools, influenced self-service technologies’ usage.
It is hypothesized that consumers react affectively to technology and to
technology-based delivery interfaces. Independently of the innovation’s perceived benefits, risks and
complexities, consumers through their personal experiences and characteristics develop a
multitude of affective reactions such as fun, enjoyment or fear toward technology in general.
H1: A consumer’s enjoyment with technology will influence the likelihood of that
consumer using more frequently technology-based service deliveries.
Preference for dealing with technological interfaces
The preference for technological interfaces contrasts with a preference for human interfaces
(i.e., dealing with people instead of machines). Dabholkar (1996) confirmed that the need for
interaction with employees was a negative influence on the intention to use self-service
options, mediated by the expected service quality of those self-service devices. People differ
in how they feel about using machines vs. interacting with people. Zeithaml and Gilly (1987)
found that some people feel strongly that the use of machines (i.e., technology interfaces)
de-humanizes service encounters. Other people negatively value some aspects of human
interaction (e.g., less speed, chance of human error) together with not valuing the social
aspect of human interaction. For these customers, technological interfaces are preferred to
human interactions.
H2: A consumer’s preference for dealing with technological interfaces will influence
the likelihood of that consumer using more frequently technology-based service
deliveries.
Desire for control
Marketing researchers have viewed the term ‘control’ to indicate a person’s exercise of
direction over some object, while researchers of perceived control have defined ‘control’ as a
sensation, rather than just an activity (Tangsrud and Smith, 2001). Perceived control has
been considered to be a global indicator, summarizing the perceptual aspect of an individual’s
service experience, a crucial antecedent of consumer behavior, and a concept useful for
understanding the service encounter (Bateson, 1985b; Bateson and Hui, 1990). Perceptions of
control will evoke positive or negative affect, as they are related to a consumer’s judgment of
Burger and Cooper (1979) introduced the notion of ‘desire for control’ as a stable
personality trait reflecting the extent to which individuals, generally, are motivated to control
the events in their lives. More control in events means more responsibility for the outcomes
of consumers’ choices. When that happens, people are more likely to attribute success to self,
especially in services where the consumer co-participates in the production of the service.
Consumers’ enjoyment with control, and consequent desire for control, will contribute
to their attraction to some delivery channels and avoidance of others. Usually, self-service
delivery channels evoke higher perceived control of the service production and delivery,
because customers have their co-producing role enhanced and a higher content of the service
depends on their inputs and efforts. The more a customer enjoys being in control, the more
he/she will be attracted to a more frequent usage of technology-based (i.e., self-service
delivery) channels.
H3: A consumer’s desire for control will influence the likelihood of that consumer
using more frequently technology-based service deliveries.
Enjoyment with participation
Service participation refers to the degree to which a customer is involved in producing and
delivering the service (Dabholkar, 1990) or, in other words, participation is the consumer’s
ability to exercise options, which affect the sequence and substance of service delivery
throughout the service experience (Goodwin and Radford, 1993). The ‘enjoyment with
participation’ variable refers to the affective compensation that the customer obtains from
being involved and participating in the events in his/her life. Consumers differ in their
willingness to participate in the service encounter.
Bateson’s findings (1985a) revealed that propensity to participate might transcend
particular services, and that for certain individuals ‘doing it themselves’ would be attractive
even when monetary or time-saving incentives were not present. Research results show that
some people find participation intrinsically attractive, while others find more participative
behaviors inherently unattractive (Langeard et al., 1981; Dabholkar, 1996; Bitner et al.,
1997).
H4: A consumer’s enjoyment with participation will influence the likelihood of that
Cognitive Determinants
Perceived ease of use
If an innovation is perceived as complex to use, that will undermine its likelihood to be
adopted. Similarly, if an innovation is perceived as easy to use, that will enhance its adoption
(Davis, 1989; Rogers, 1995). Te’eni (1989) also concluded that perceived complexity affects
the decision maker’s actions and performance.
The less easy to use a technology is perceived to be, the higher the cognitive effort
required. This difficulty, if perceived excessive, may undermine the individual’s interest in
using such a technology and limit his/her usage of a technology-based remote channel.
H5: A consumer’s perceived ease of use of a delivery channel will influence the
likelihood of that consumer using more frequently the delivery channel.
Perceived risk
Perceived risk is particularly relevant in consumer decision-making, as it represents the
uncertainty about the potential outcomes of behavior and about the unpleasantness of those
outcomes (Cunningham, 1967; Taylor, 1974; Murray, 1991; Dowling and Staelin, 1994).
Perceived risk has to do with what one acquires, but also with how and where one acquires it
(Hisrich et al., 1972). Consumers perceive risk in store purchases, thus it is expected that they
perceive higher risk in remote purchases. Additionally, in services, the uncertainty of the
outcomes and, consequently, the perceived risk is higher than in a goods context (Mitchell,
1994). As a result, delivery channels have their own specific risks and the risk perception of a
new channel influences the choice for transacting via that channel (Bhatnagar et al., 2000).
Recent research on perceived risk focusing on Internet shopping suggests that the reluctance
that many consumers have to shop online is due to the higher perceived risks (Forsythe and
Shi, 2003).
H6: A consumer’s risk perception of a delivery channel will influence the likelihood
of that consumer using more frequently the delivery channel.
Perceived service quality
Service quality is considered to be a cognitive evaluative element that influences the usage
decision for both interpersonal and technology-based encounters (Gronroos, 1988; Berry and
Parasuraman, 1991). In this research, the scale used to measure service quality derives from
represents the five dimensions of SERVQUAL (Parasuraman et al., 1988), adapted to the
banking context with a focus on technology-based service deliveries. The dimensions of
service quality modeled are the ones considered in Parasuraman, Zeithaml, and Berry’s
research (1988), that is, reliability, responsiveness, assurance, empathy and tangibles. These
dimensions, although conceived for interpersonal encounters, can, with context adaptations,
be used to describe the quality of technology-based (remote) encounters.
H7: A consumer’s perception of service quality will influence the likelihood of that
consumer using more frequently the delivery channels of the firm.
Perceived communication efforts
Marketing communications is a crucial aspect of a company’s overall marketing strategy, and
particularly of service firms where the product is intangible. Effective communication is
essential to form strong customer brands, highlighting the importance of this element in the
company’s strategy. It concerns aspects that illustrate service quality, in terms of being close
to customers and providing them with up-to-date and valuable information, but constituting a
different dimension than that of overall service quality. Smith (1989), analyzing the
relationships between banks and their small business clients, found that one major element of
what was considered to be poor service was insufficient information. The importance of this
variable as a separate construct was highlighted in the interviews conducted with bank
customers.
H8: A consumer’s perception of communication efforts of the firm will influence the
likelihood of that consumer using more frequently a delivery channel of the firm.
This set of hypotheses will be analyzed on a channel basis, that is, by delivery channel.
Usage of the Delivery Channel
Consumer behavior is considered in terms of usage frequency: how frequently the user
accesses his/her bank accounts and contacts the bank through a specific delivery channel.
This usage definition conceptualizes the likelihood of using a particular delivery channel.
This dimension of usage has been used in the literature (Gatignon and Robertson, 1985;
Zaichkowsky, 1985; Ram and Jung, 1991) in studies of usage and adoption of innovations/
RESEARCH DESIGN AND DATA COLLECTION
The data collection process began with a series of in-depth exploratory interviews conducted
with bank managers and bank customers, followed by a survey in which a questionnaire was
distributed to a stratified random sample of bank customers. A total of seventeen in-depth
interviews took place, nine interviews with bank managers and eight interviews with bank
customers. These in-depth interviews allowed an initial grasp of the important issues for both
sides in the provision of a satisfying banking service, provided clarification of the research
problem and assisted the formulation of a questionnaire for the quantitative research stage.
The sample comprised four strata including users of the main bank delivery channels:
the Internet-based delivery channel, the telephone-based access to the bank, the debit-card
access (through the ATM network) and a stratum of users of the branch network of the bank.
The strata construction followed the definition of a user of a delivery channel as a client who
had used that particular delivery channel in two specified months of that year (namely,
January and February, considered to be typical months for the banking business).
One major bank1 agreed to collaborate in the research by distributing the
questionnaire to its customers. In order to have the strata as mutually exclusive groups of
users, it was decided to have a ‘pyramidal definition’ of the strata. Following the bank rules
on access to the delivery channels, the strata were successively extracted from the global
customer base: the first stratum to be identified was users of the Internet-based access,
followed by users of the telephone-based channel, debit card users and branch users. This
sequential process avoided duplication of customers among strata. The branch users received
a shorter questionnaire, as questions about the technology-based channels did not make sense
for these customers.
The questionnaire was mailed to 6,000 customers of each stratum, leading to a total of
24,000 questionnaires sent to users of the various delivery channels. Although the response
rate differed among the strata, the overall response rate was 20.2%. A total of 4,852
questionnaires were received, of which 3,250 were considered usable (1,467 from the on-line
channel users, 682 from the telephone-based access users, 731 debit card users and 370
branch users). The difference between the response rates was considered to result from
differences in education and in understanding the benefits of the bank’s effort: the
questionnaire was presented as coming from the bank with the intent of increasing customer
satisfaction. The survey responses were not re-weighted to correct for differences in the
1
response rates, as the purpose was not to analyze the aggregate results, but rather to study the
data on a stratum basis (Groves et al., 1992).
The data from the questionnaire were first factor analyzed in order to produce the
variables that were subsequently related with usage behavior through ordered logistic
regressions. Factor analysis was used to reduce the items of the questionnaire to a smaller set
representing the cognitive and affective variables. Ordered logistic regression was considered
to be the appropriate instrument to analyze the influence of affective and cognitive
determinants of usage, due to the ordered and discrete nature of the outcome variable. The
objective was to have the most parsimonious model that best describes the data (Hosmer and
Lemeshow, 1989). When the model contained the variables that were significant in the
correct functional form, the model’s goodness-of-fit was assessed with measures such as the
likelihood ratio test, the Wald test, the deviance, the Akaike Information Criterion, and the
Bayesian Information Criterion.
Usage frequency was operationalized as customers’ frequency of use (ranging from
“Never”, “Less than once a month”, “One/two times a month”, “One/two times a week” and
“Most days”) of the different delivery channels (branch network, debit card network,
telephone-based and Internet-based access). The definition of this dimension of usage follows
Ram and Jung (1991) and Zaichkowsky (1985) who defined usage frequency as how often
the product was used or the different applications for which the product was used.
DATA ANALYSIS
Factor Analysis
A factor analysis with orthogonal rotation was performed, as the objective in this exploratory
research was to produce uncorrelated constructs. This is considered adequate when the
objective is to reduce the number of original variables to a smaller set of uncorrelated
variables for subsequent use in prediction techniques, which was the case. Among the
orthogonal rotation methods, Varimax was used. The factor analysis conducted with the four
Table 1: Comparison of the factor analysis between the four channel strata
Notes:
a
A = Affective factor C = Cognitive factor b
Perceived service quality five dimensions are the dimensions included in SERVPERF scale (Cronin and Taylor, 1992). Perceived service quality four dimensions are all of these dimensions, with the exception of the tangibles dimension.
- Single-item factors for which calculation of Cronbach’s alpha is not possible.
Some differences emerged from the factor analysis compared to the variables that
were defined in the model:
• For the debit card and the branch channels, ‘perceived service quality’ comprised
items related to the five dimensions of SERVQUAL. For the telephone-based and the
Internet-based channels, it comprised items of four dimensions, excluding items related to Factor title Debit-card
channel Telephone-based channel Internet-based channel Branch channel Factor belonging to group a
Perceived Service Quality (5 dimens.)b
X
(α=0.926) (α=0.939) X C
Perceived Service Quality (4 dimens.)
X (α=0.907)
X
(α=0.899) C
Enjoyment with Technology X
(α=0.741)
X (α=0.749)
X (α=0.739)
X
(α=0.784) A
Preference for Technological
Interfaces X
(α=0.618)
X -
X (α=0.623)
X
(α=0.757) A
Desire for Control X
(α=0.504)
X (α=0.6)
X (α=0.454)
X
- A
Perceived Communication
Efforts X
(α=0.666)
X (α=0.752)
X (α=0.629)
X
- C
Tangibles X
-
X (α=0.589)
X (α=0.564)
X
- C
Perceived Risk X
-
X -
X
(α=0.731) C
Perceived Service Quality of
Technology-based Channels X
(α=0.635)
X
(α=0.546) C
Perceived Service Quality of
Human-based Channel X
-
X
(α=0.686) C
Enjoyment with Technology
(playful interaction) X
- A
Enjoyment with Participation X
-
X
the ‘tangibles’ dimension. Every stratum had a factor for the tangibles dimension. This
may reveal that for users of these remote channels, the aspect of equipment/facilities
quality constitutes a separate evaluation from overall service quality. This conclusion is in
line with their remote nature, as the physical aspect of the branch and the equipment used
is a secondary aspect for these channels’ users.
The splitting of the ‘tangibles’ dimension is interesting in light of the results of
Parasuraman, Berry, and Zeithaml (1991) in their assessment of the SERVQUAL scale.
In their re-evaluation of the scale, the tangibles dimension that originally (Parasuraman et
al., 1988) was unidimensional, appeared subdivided into two dimensions, one pertaining
to the physical facilities/equipment, and the other to employees/communication materials.
• Perceived ease of use did not emerge as a distinct factor. Although not expected, it is
in accordance with the in-depth interviews carried out, where this attribute was not
mentioned as relevant for the usage decision of a technology-based delivery channel.
• Unexpected factors, such as ‘Perceived service quality of technology-based /
human-based channels’, suggest that channels have intrinsic aspects of service quality that are not
revealed in a common service quality dimension covering service quality aspects that are
generic to the company whatever the distribution channel considered.
Due to the exploratory nature of the research, to length restrictions of the questionnaire
and to the original nature of some of the constructs of the model, it was decided not to use
scales already defined in the literature, except for the case of the perceived service quality
construct. The measures used were newly developed by the author, based both on existing
measures and on insights brought by the in-depth interviews conducted.
Reliability and validity
In empirical research, there is the need to determine the extent to which a particular
measurement represents a certain construct. Latent variables are not observed, and so the
validity and reliability of their measurement have to be established. The measures (i.e., the
constructs) used were assessed in terms of reliability and validity. Almost all variables
satisfied the recommended reliability values for exploratory research. Some of the variables
with lower reliability values were retained due to their theoretical interest (Nunnally, 1967;
concluded that all variables were acceptable for face, content and discriminant validity
criteria.
Ordered Logistic Regressions
Model fitting efforts consisted of multivariate analyses of the data in order to explore and test
the hypotheses. By stratum, correlation and univariate analyses were also performed to best
understand the data, and to suggest a number of candidate variables to enter the multivariate
model.
For the logistic regressions, each variable’s estimated odds ratio, standard error, beta
coefficient, odds ratio confidence interval, and corresponding p-value are described, together
with the measures used to evaluate the model’s fit. In logistic regression, the variables’ beta
coefficients represent the impact of a marginal change of the independent variable over the
logit (i.e. the log odds) of the dependent variable. As sometimes, the effect over the logit is
not very useful or clear, it is preferable to interpret the impact of the independent variables in
terms of the odds. As such, both the odds ratio and the beta coefficient are presented. The
estimated odds ratio is the exponentiated estimated beta coefficient and represents the effect
of a marginal change of the independent variable over the odds of the dependent variable. For
example, an estimated beta coefficient of ‘desire for control’ of .29 or the estimated odds
ratio of 1.33 means that a marginal increase in desire for control will increase the likelihood
of more frequent usage of the channel vs. less frequent usage (or that the odds of a more
frequent usage of the channel are 33% higher for those who feel higher desire for control).
Care was also taken in relation to different types of data (numerical) problems that
interfere with model fitting by biasing the estimates and, consequently, leading to erroneous
conclusions. Namely, issues such as multi-collinearity, outliers and influential observations,
and complete discrimination were evaluated. When such problems were detected, the number
of observations was corrected, as suggested by Hosmer and Lemeshow (1989) and Hair,
Anderson, Tatham, and Black (1998). Additionally, for each model fitting, the ‘Proportional
Odds’ assumption was tested (the chi-square values for this test are presented by channel).
This is a critical assumption of the ordered logit model and states that the beta coefficients do
not vary according to the outcome category being considered (Borooah, 2001). Violation of
this assumption leads not to one model describing the outcome variable, but to k-1 models (k
being the number of categories of the outcome variable), each one representing a contrast
model would have to be estimated as a multinomial logit model, notwithstanding the fact that
the dependent variable is clearly ordinal.
Complete reliance in the conclusions of the Wald test can be risky (Hauck and
Donner, 1977; Jennings, 1986; Menard, 1995). For example, the Wald statistic can produce
erroneous conclusions, such as when very large logit coefficients lead to inflated standard
errors and to small Wald values (i.e., leading to Type II errors in which the effect of the
variable is deemed to be not significant when it is). Therefore, some authors suggest either to
complement the Wald test with the likelihood ratio test or even to use only the latter (Hosmer
and Lemeshow, 1989; Agresti, 1990; Agresti, 1996). This led to that, although some predictor
Wald coefficients were not individually significant, their joint test of significance with other
predictors of the model (either cognitive or affective depending on the individual variable in
question) and the likelihood ratio test were used to decide whether to keep or discard that
individual variable from the model.
According to Hosmer and Lemeshow (1989), “models should not be based entirely on
tests of statistical significance. (…) Successful modeling of a complex data set is part science,
part statistical methods, and part experience and common sense. (…) The objective is to have
the most parsimonious model that best describes the data”. Thus, after fitting the model and
estimating the coefficients, the contribution of each variable for the prediction of the
dependent variable should be assessed. This stage of variable testing was followed and so, the
models presented are the final models for each delivery channel.
Debit card channel
Table 2: Ordinal logistic regression of debit card’s usage
VARIABLES C
^
OR
^
SE(OR)
^
β
^
95% CI (OR) p-value
Desire for control 1.463 .249 .381 (1.048,2.04) .026
Preference for tech.
interfaces 1.258 .121 .23 (1.041,1.52) .017
Perceived service quality .835 .11 -.18 (.646,1.08) .17
Measures of fit
LRT (df) a 14.2 (3) p-value .003 Log-likelihood -745.45
AIC 2.056 AIC*n 1502.902 Number obs. 731
BIC b -3290.048 BIC’ 5.581
a
The likelihood ratio test is performed against the log-likelihood of the intercept-only model. In brackets are degrees of freedom.
b
The BIC criterion is more adequate for comparing models than just per se. The value of the statistic is reported here for information purposes. It was used for comparison between models.
c
The table presents, by column, the estimated odds ratio, its standard error, the estimated beta coefficient, the 95% confidence interval of the estimated odds ratio and the corresponding p-value.
As hypothesized, usage of remote technology-based channels, such as the debit card
channel, is influenced by cognitive and affective factors. The significant affective factors are
preference for technological interfaces and desire for control (supporting H2 and H3). Higher
usage of the debit card channel reflects higher preference for technological interfaces and
higher desire for control: a customer using a remote self-service system is controlling the
events more than when he expects others to perform the service for him. It is reasonable that
those customers with less affection toward technology-based interfaces will prefer to use a
human-based delivery system. The relevant cognitive factor for explaining usage frequency
of the debit card network is perceived service quality (supporting H7). From the initial set of
hypotheses, enjoyment with technology, perceived communication efforts and perceived risk,
although present for this channel, did not emerged as significant constructs for explaining
usage frequency, therefore H1, H6 and H8 were not confirmed.
Telephone-based channel
Table 3: Ordinal logistic regression of the telephone-based channel’s usage
VARIABLES
^
OR
^
SE(OR)
^
β
^
95% CI (OR) p-value
Enjoyment with participation 1.196 .111 .179 (.996,1.44) .055
Perceived service quality 1.098 .156 .094 (.83,1.45) .511
Perceived service quality of
technology-based channels 1.466 .19 .383 (1.14,1.89) .003
Perceived service quality of
Proportional Odds assumption χ2 = 7.95 p-value = .44
Measures of fit
LRT (df) a 26.77 (4) p-value .000
Log-likelihood -789.8
AIC 2.364 AIC*n 1593.6 Number obs. 674
BIC b -2764.73 BIC’ -0.721
a
The likelihood ratio test is performed against the log-likelihood of the intercept-only model. In brackets are degrees of freedom.
b
The BIC criterion is more adequate for comparing models than just per se. The value of the statistic is reported here for information purposes. It was used for comparison between models.
Enjoyment with participation, as a relevant predictor of the telephone-based channel
usage, reflects the pleasure that participating has on a self-service option usage. As a result,
H4 is supported. More specifically, the odds of ‘most days’ vs. less frequent usage are 20%
higher for those who experience a marginal change in their ‘enjoyment with participation’,
that is, for those who prefer to participate and enjoy being involved in the course of action.
Concerning cognitive influences on usage behavior, H7 was supported by the data. As
such, the odds of more frequent usage of this channel increase for a marginal increase of
perceived service quality as a whole, as well as increasing for marginal increases of perceived
service quality of technology-based channels and of the human-based channel. For the
telephone-based channel, perceived service quality of the human-based channel consisted of
items related to employees’ evaluation. This result can be explained when interpreting the
telephone-based channel as also comprising telephone calls requesting the service directly to
the account branch: this fact was acknowledged by comments made by telephone-based
channel users in their questionnaires. Perceived service quality of technology-based channels
also positively influenced the odds of a more frequent usage of the telephone-based channel:
this finding is in line with the fact that this channel may involve both person-to-person
(mediated by a technological device) and person-to-technology contacts. From the initial set
of hypotheses, enjoyment with technology, preference for technological interfaces, desire for
control, perceived communication efforts and perceived risk also emerged as factors although
Internet-based channel
Table 4: Ordinal logistic regression of the Internet-based channel usage
VARIABLES
^
OR
^
SE(OR)
^
β
^
95% CI (OR) p-value
Desire for control .934 .097 -.068 (.76,1.15) .512
Enjoyment with technology 1.779 .233 .576 (1.38, 2.3) .000
Preference for technological
interfaces 1.145 .103 .135 (.96,1.37) .13
Perceived service quality .749 .081 -.289 (.6,.93) .008
Perceived service quality of
technology-based channels 1.136 .099 .128 (.96,1.35) .142
Perceived service quality of
human-based channel 1.282 .074 .248 (1.14,1.44) .000
Perceived risk .945 .087 -.057 (.79,1.13) .541
Proportional Odds assumption
χ2 =
18.14 p-value = .201
Measures of fit
LRT (df) a 49.41 (7) p-value .000
Log-likelihood -1693.1
AIC 2.322 AIC*n 3406.13 Number obs. 1467
BIC b -7236.82 BIC’ 1.626
a
The likelihood ratio test is performed against the log-likelihood of the intercept-only model. In brackets are degrees of freedom.
b
The BIC criterion is more adequate for comparing models than just per se. The value of the statistic is reported here for information purposes. It was used for comparison between models.
Again, channel frequency usage is determined by cognitive and affective reasons. The
affective factors include enjoyment with technology, preference for dealing with
technological interfaces, and desire for control (supporting H1, H2 and H3). Enjoyment with
technology is only relevant for the explanation of the Internet-based channel usage frequency.
This variable represents the pleasure dimension of technology usage, describing the joy and
excitement one feels emotionally when interacting with technology, which is in line with the
The cognitive factors include perceived service quality, perceived service quality of
technology-based interfaces, perceived service quality of human-based interfaces, and
perceived risk (supporting H6 and H7). For this channel ‘perceived communication efforts’
did not emerge as a significant predictor of usage frequency, therefore H8 was not supported.
Branch channel
Table 5: Ordinal logistic regression of the branch channel usage
VARIABLES
^
OR
^
SE(OR)
^
β
^
95% CI
(OR) p-value
Perceived service quality 2.33 .544 .846 (1.47,3.68) .000
Tangibles .68 .103 -.386 (.51,.92) .011
Perceived communication efforts .932 .135 -.07 (.702,1.24) .628
Proportional Odds assumption χ2 = 8.35
p-value =
.214
Measures of fit
LRT (df) a 17.22 (3) p-value .000
Log-likelihood 24.34
AIC 2.178 AIC*n 790.761 Number obs. 363
BIC b -1325.54 BIC’ 0.46
a
The likelihood ratio test is performed against the log-likelihood of the intercept-only model. In brackets are degrees of freedom.
b
The BIC criterion is more adequate for comparing models than just per se. The value of the statistic is reported here for information purposes. It was used for comparison between models.
Implicit to the model presented, is the hypothesis that channel usage is influenced by
two groups of variables: a cognitive group of predictors and an affective group of predictors.
The final model for branch channel usage only included cognitive predictors: perceived
service quality, tangibles, and perceived communication efforts, supporting H7 and H8. No
affective variable was present in the final solution (H1, H2, H3 and H4 were not supported).
tangible element of the offer is more visible and more relevant for the definition of the
service.
DISCUSSION
In this study, the objective was to expand previous research by examining explanatory
processes, by model building, and by testing the role of affective/cognitive constructs in
customers’ behavior, in a context of technology infusion in bank delivery channels. The
results of this effort will be discussed in relation to the channels and the cognitive/affective
set of variables.
Cognitive Determinants
Cognitive determinants were found to be valid predictors of consumer behavior toward
stronger adoption (in terms of usage frequency) of technology-based delivery channels,
confirming general consumer behavior theories and innovation adoption models (Fishbein
and Ajzen, 1975; Ajzen and Fishbein, 1980; Gatignon and Robertson, 1985; Davis et al.,
1989; Ajzen, 1991; Rogers, 1995).
It is concluded that perceived risk makes a significant negative contribution to explain
Internet-based usage of bank services. This would be expected when Internet shopping is
seen as the riskiest delivery channel (Donthu and Garcia, 1999; Tan, 1999; Forsythe and Shi,
2003). One might say that the perception of risk is higher due to the innovative,
non-controlled environment that this channel represents.
The model fitting results show that for all channels, perceived service quality is a
significant predictor of channel usage frequency. In particular, perceived service quality
negatively influences the debit card and the Internet-based channel usage and positively
influences telephone-based and branch usage. The expected result would be for an increase in
the perceptions of service quality leading to an increase in channel usage. This has been
shown by other researchers, investigating the consequences of service quality perceptions
over different types of behavioral intentions (LaBarbera and Mazursky, 1983; Reicheld and
Sasser, 1990; Boulding et al., 1993). However, in the model explaining debit card and
Internet-based channel usage frequency, perceived service quality, although significant, was
negatively related to usage. For the debit card channel, one possible explanation can be found
when looking at the items comprised in this factor: they refer to the employee/customer
interaction. It might be that the more a debit card user perceives quality in this personal
possible explanation for this relationship can be found by looking at the results for the
constructs of perceived service quality of both the technology-based and the human-based
channels. These perceptions, specific to the delivery channels, are stronger predictors of
usage of the bank Internet service, showing that the more relevant perceptions determining
usage are the ones related to the characteristics of the delivery channels and not those related
to global evaluation of the bank as a whole. For the Internet-based channel, it could be that
the more one is known and receives personalized attention in the branch, the more one will
increase usage of an impersonal channel, as corresponding to a desire for anonymity and a
lower need to contact and obtain the service through human tellers. Recall that, for the
respondents with Internet-based access, the variable ‘preference for dealing with
technological interfaces’ was significant and positively related to channel usage.
Perceived service quality of the technology-based channel represents a significant
influence over channel usage for both the telephone-based and the Internet-based channels.
An interesting aspect is that this influence is stronger than the influence of the general
construct of perceived service quality for these channels. This may suggest that bank
managers should favor elements that increase perceptions of service quality specific for these
technology-based channels, such as service consistency across remote channels, clear
instructions on how to use the channels and personalized service.
Perceived communication efforts was found to be a significant contributor to explain
the branch usage frequency. An interesting finding is that this is the channel characterized by
face-to-face interactions, highlighting the potential of this channel for advising on bank usage
and as a communication vehicle about new products/ channels/ procedures.
The branch sample, effectively demonstrated the contrast with technology-based
channels, for which both cognitive and affective variables acted as significant predictors of
channel usage frequency. A possible explanation can be that, for almost all the banks’
business life, branches were the sole delivery channel. So, for users of this channel there
might be no innovation related to the human-interface. This lack of glamour, of novelty, of
surprise in the delivery channel can explain usage decisions being motivated only by
cognitive reasons and not by the affective factors considered in the analysis. Moreover, this
result represents an avenue for improvement in the branch network, especially for the high
value-added banking operations or for cross-selling opportunities.
Affective Determinants
The results show that affective influences were only relevant predictors of usage frequency
for the remote channels. Has the branch lost its ability to provoke emotional reactions from
customers, leaving its thrust to a functional perspective? For remote technology-based
channels, both cognitive and affective influences have a say in the way a channel’ users
decide their degree of usage frequency. Therefore, the results confirm that consumers can
appreciate a delivery interface for the fun, enjoyment and positive feelings that the interaction
evokes, independently of rationalizing the utility they may derive from using such an
interface. This confirms the experiential perspective of consumer behavior (Klinger, 1971;
McGregor, 1974; Olshavsky and Granbois, 1979; Holbrook and Hirschman, 1982; Holbrook
et al., 1984) applied to usage frequency of technology-based delivery channels.
Concerning enjoyment with technology, the variable was only considered relevant to
explain Internet-based channel usage. A possible explanation might be that the debit card and
the telephone-based channels are considered established and not particularly likely to induce
any excitement with their use. These channels have been available to banking customers for
several decades, and their usage might not be offering joy and excitement similar to the usage
of an Internet-based channel, which is more recent for bank customers. As expected,
preference for dealing with technological interfaces is a significant regressor for the debit
card and Internet-based channel usage frequency. It is understandable that bank users with a
higher preference for interacting with technological devices or self-service options, will favor
in their interactions with the bank (increasing their usage frequency) those delivery channels
mediated by technology.
Desire for control emerges as a significant predictor in two channels: in the debit card
channel, the variable represents a positive contribution for the explanation of the channel’s
usage frequency, whereas for the Internet-based channel it represents a negative contribution.
In the debit card channel, the environment can be considered familiar and known to
customers, who would then perceive control over that environment and would wish to control
it. Alternatively, in the Internet-based channel, customers face a novel environment:
customers’ lack of dominance may reduce their desire for controlling the environment. The
results are in accordance with Janis and Mann’s (1977) conclusion that people become
decision averse in risky choices. Internet banking is still unfamiliar for the majority of bank
customers, who would then perceive higher risks in this channel as compared to others.
Therefore, it is possible that, to avoid making bad decisions and facing the consequences,
familiar as the debit card system. The results mirror the conclusions of Langeard, Bateson,
Lovelock, and Eiglier (1981) and Bateson (1985a), and may illustrate that increased desire
for control produces a higher or lower customer motivation to use more frequently a
technology-based delivery option, depending on the degree of familiarity that customers have
with the technology-based options.
Enjoyment with participation contributes positively in explaining telephone-based
channel usage. The level of customer participation, in the presence of alternative delivery
options, derives from the propensity to participate that customers have which, in turn, will
derive from the attractiveness that participating and being involved has to customers
(Langeard et al., 1981; Dabholkar, 1996).
Overall for the technology-based delivery channels, cognitive and affective variables
determined usage. For the branch, usage frequency was only determined by cognitive
influences.
RESEARCH IMPLICATIONS
This research has attempted to clarify how technology infusion in bank delivery channels
affects customers’ perceptions and decisions. It is an exploratory study aimed at revealing the
determinants behind bank channel users’ decisions, namely the usage frequency decision by
delivery channel. The research literature has repeatedly asked for contributions in customer
interaction with technology-based service deliveries (Mick and Fournier, 1998; Steenkamp et
al., 1999; Bitner et al., 2000; Meuter et al., 2000).
The results from this research suggest and confirm that both affective and cognitive
factors determine technology acceptance and usage, contrasting with traditional models that
explain technology acceptance, innovation diffusion and adoption (Gatignon and Robertson,
1985; Davis et al., 1989; Rogers, 1995) only favoring cognitive influences. For the customer,
technology delivery applications can represent positive outcomes, such as convenience, cost,
or time savings. They can also represent disadvantages, such as risk or complexity. All these
factors are cognitively processed by the customer when deciding whether to increase or not
its usage of a bank delivery channel. However, research results illustrate that in all remote
delivery channels (contacts mediated by technology), the frequency of usage was determined
that customer/technology interaction in terms of usage frequency contains both rational and
emotional elements. As such, the result aligns with the conclusions of the Portuguese
neuroscientist Damásio (1995,1999) about the role of emotions and feelings in human
behavior.
Usually, decisions on high involvement situations are theorized to depend on
cognitive factors. In this paper, we consider the usage frequency decision concerning a bank
delivery channel as a high involvement decision, due to the risks and security concerns that
remote channels provoke and the assets involved – monetary funds of the customer. Results
illustrate that this decision also depends on affective reasons, which are usually only
researched for impulse buying or in low involvement buying/choice decisions
The analysis also shows that the specific affective and cognitive determinants of each
delivery channel usage depend on the channel. Concerning financial services, the core service
is basically the same between channels. The differences come from the interface considered
to provide the service. Additionally, the results show that technology-based channels differ
from the branch channel, in terms of cognitive vs. affective usage frequency determinants.
In terms of research limitations, this research is of an exploratory nature and of
limited scope. One of the most common problems lies in the extent to which the empirical
results obtained can be generalized to other samples and contexts. The analysis concentrated
in one firm from one service industry (a bank). One question arises about the generalization
of the conclusions to other banks or other service industries. An interesting avenue for future
research would be to replicate the model with other banks and with other service industries
characterized by multiple delivery channels (technology-based and human-based). This
extension or replication could enlighten the generalization of the findings.
Further, the cognitive and affective variables presented in the model are, by model
design, not influencing each other. It is acknowledged that important interactions between
cognitive and/or affective variables might exist: however, the intent was to explore channel
usage incorporating the variables that represent the most critical influences. These efforts
comprised an initial qualitative stage, with in-depth interviews with both bank managers and
customers, and extensive literature research. The model presented could be explored further,
by integrating other variables as predictors of usage. For example, ‘familiarity with
technology’ or ‘familiarity with the channel’ could be explored as an additional influence on
usage. The model could also be extended to include relationships and interactions between
operation and the channel used to perform it: one way to overcome this weakness could be to
perform the research considering only one banking operation common to all channels.
One major avenue for future research concerns the analysis of channel choice
determinants, considering all the data collected. In this paper, we analyze a subset of the
usage decision (i.e., usage frequency), but it would be very interesting the study of the nature
and composition of the influences for bank delivery channel’s choice. Another aspect that
could be researched in future work would be to use the same regression model (with the same
predictors) between channels and analyze potential differences.
Another interesting opportunity for further research would be to study usage of the
delivery channel considering both the frequency of usage and the number of different
operations carried out within each delivery channel (or the relative proportion, as delivery
channels may differ in the banking operations allowed). This could be done separately, or a
usage index could be created describing the two aspects: usage frequency and breadth of
usage, using Zaichkowsky’s (1985) terms. Zaichkowsky (1985) defined breadth of usage as
the variety of use situations. A measure comprising the two facets of usage could extend the
knowledge of technology impact in usage behavior.
Managerial Implications
The research results have the potential to offer new and important insights concerning
customers’ usage frequency of bank delivery channels. The findings clarify the determinants
of this decision for each delivery channel, offering more and better information for banks, so
to allow them to better characterize their customer base. The enhanced customer profiles will
affect behavioral and evaluation outcomes. Some examples of how the research conclusions
will impact managers’ decisions can be suggested:
Significant affective factors for the debit-card users, such as ‘preference for dealing
with technological interfaces’ and ’desire for control’, illustrate that, for increasing usage,
bank communications for these users should emphasize the fact that usage of this interface
allows independent interaction, in which the user controls the interaction process without
having to deal with a bank contact employee.
Managers of the Internet-based channel have witnessed an increase in Internet usage
across service industries, although with lower growth rates than expected. To enhance these
procedures and reducing the complexity of using the channel through clear instructions and
examples of how to perform banking transactions. Providing a global high quality service
across channels will also impact usage frequency. Perceived risk is an important issue for
Internet shopping, especially in the banking industry with all the current concerns about
phishing, lack of security and confidentiality. Developing strong efforts to assure customers
of the absence of risk in channel usage is a necessary condition for users to increase their
usage of the Internet-based channel. Managers should address these users with specific
communications targeted to allay customers’ fears.
Branch managers will also benefit from knowing what their users react to, in order to
achieve the objective of transferring low value added operations to remote channels. The
positive outcomes (financial and time benefits) of the remote channels must be stressed
together with customer education on how to use the remote channels and assurance that the
bank will cover the risks involved. From the interviews carried out, it was found that too
often the lower prices of banking operations through remote channels or the instructions on
how to use them are not common knowledge among branch users, who consider remote
channels and technological interfaces as a distant reality.
Moreover, the research results show that for firms with a multiple channel strategy,
users of different channels have different attitudinal and perception profiles. Therefore, the
communications strategy has to address these differences, instead of being a single strategy,
designed for all target customers. Users behave and evaluate differently technology-based
and human-based distribution channels. These differences have to be incorporated in
companies’ marketing strategies. Bank strategies can benefit from knowing which variables
affect usage decisions of a specific delivery channel, and in which direction.
In terms of human resource management, one important implication concerns the
training that contact employees need in terms of providing the desired experience to
customers. In the branch and telephone-based channels, contact employees have a major role
in transferring routine transactions to the debit-card and the Internet-based channels.
Consequently, it is essential they know which aspects to stress according to the channel. This
research can provide the answer to optimizing employees’ effort in such a challenge.
Overall, it can be said that the aspects found, by channel, to influence the frequency
with which customers of those channels use them should be emphasized by managers in order
to better achieve their objectives. This way, the research conclusions set a direction for
The study was designed to explore the influence of cognitive and affective-based attitudes on
customers’ usage frequency decisions. To that purpose, and despite its limitations, the
findings of this study provide a platform for future investigation and diagnosis, as well as