Working Paper CEsA CSG 165/2018
PORTUGAL
–
CRISIS AND
RESTRUCTURING
1Maria SOUSA GALITO
Abstract
The presentation proposes an approach to political economy and international relations. It begins by analyzing the main Portuguese macroeconomic indicators in the last years, taking into account internal weaknesses and the degree of external dependence. Afterwards, tries to assess national development on a globalized stage. It lists main current challenges from a geopolitical and geo-economic point of view and how difficult it is to face them. It also tests the hypothesis that Portugal is changing patterns, from crisis and loss of credibility to recovery, and some explanations are given to explain it.
Keywords
Portugal, crisis, dependence, restructuring.Sumário
A apresentação propõe uma abordagem no âmbito da economia política e das relações internacionais. Começa por analisar os principais indicadores macroeconómicos portugueses nos últimos anos, levando em consideração as fragilidades internas e o grau de dependência externa. Depois avalia a evolução nacional num palco globalizado. Listam-se os principais desafios atuais do ponto de vista geopolítico e geoeconómico e as dificuldades em enfrentá-los. Mas também se testa a hipótese de Portugal estar a inverter a tendência de crise e de perda de credibilidade, enquanto segue pelo caminho da reestruturação e apresentam-se algumas explicações para o fenómeno.
Palavras-chave
Portugal, crise, dependência, reestruturação.
WORKING PAPER
CEsA neither confirms nor informs any opinions expressed by the authors in this document.
CEsAis a research Centre that belongs to CSG/Research in Social Sciences and Management that is hosted by the Lisbon School of Economics and Management of the University of Lisbon an institution dedicated to teaching and research founded in 1911. In 2015, CSG was object of the international evaluation process of R&D units carried out by the Portuguese national funding agency for science, research and technology (FCT - Foundation for Science and Technology) having been ranked as “Excellent”.
Founded in 1983, it is a private institution without lucrative purposes, whose research team is composed of ISEG faculty, full time research fellows and faculty from other higher education institutions. It is dedicated to the study of economic, social and cultural development in developing countries in Africa, Asia and Latin America, although it places particular emphasis on the study of African Portuguese-speaking countries, China and Pacific Asia, as well as Brazil and other Mercosur countries. Additionally, CEsA also promotes research on any other theoretical or applied topic in development studies, including globalization and economic integration, in other regions generally or across several regions.
From a methodological point of view, CEsA has always sought to foster a multidisciplinary approach to the phenomenon of development, and a permanent interconnection between the theoretical and applied aspects of research. Besides, the centre pays particular attention to the organization and expansion of research supporting bibliographic resources, the acquisition of databases and publication exchange with other research centres.
AUTHOR
Maria SOUSA GALITO
CONTENTS
INTRODUCTION ... 4
1. MAIN PORTUGUESE MACROECONOMIC INDICATORS ... 5
2. INTERNAL FRAGILITIES ... 10
3. EXTERNAL DEPENDENCY ... 16
4. PORTUGAL – ECONOMIC RECOVERY... 21
4.1. MAIN GEOPOLITICAL AND GEO-ECONOMIC CHALLENGES ... 21
4.2. PEACEFUL COUNTRY ... 23
4.3. TOURISTIC COUNTRY ... 25
5. UNITED STATES OF EUROPE –PORTUGAL’S PROSPECTS ... 27
CONCLUSION ... 29
INTRODUCTION
Portugal is a southwestern country with a strategic triangle including two archipelagos
and a territorial slice of the Iberian Peninsula. It’s a State-member of the European Union
(EU) since 1986. After 2008 faced financial and economic restrain and asked for financial
external help from Troika (IMF, European Commission and European Central Bank)
between 2011/14.
Taking that in mind, the article contextualizes Portugal’s present situation and its
trends for the last ten or less years. The first chapter analysis main macroeconomic indicators
of Portugal, including the GDP, imports and exports specific performance, consumer price
index, net lending/ borrowing by institutional sector, and sovereign ratings from the biggest
international agencies. The second chapter evaluates some of the country’s inner fragilities,
such as lack of industrialization and unbalanced GVA and Employment between major
sectors (agriculture, services and industry), Risk of Poverty, Unemployment Rates and major
demographic trends. The third chapter focus on external dependence; studies indicators in
percentage of the GDP, like the Liquid External Debt, Emigrants’ Remittances, Public
Transferences from and for the EU, but also the Geographical Distribution of Exports and
Imports of Goods by Regions and by countries, and of Foreign Direct Investment (FDI) by
Countries. The fourth chapter examines the overseas AICEP network, the Global Peace
Index, The Travel & Tourism Competitiveness Index and Portuguese indicators like the revenue and number of bed nights by country of origin. A final chapter has a summarized
From the methodological standpoint, the article uses credible sources like AICEP – Global, INE – Statistics of Portugal, Pordata from the Francisco Manuel dos Santos Foundation, the Institute for Economics and Peace, Trading Economics, and The World
Economic Forum.
1.
MAIN PORTUGUESE MACROECONOMIC INDICATORS
Indicators are key statistics to interpret the most important economic and financial
trends of a country. Table 1 show the Portuguese GDP components, and totals, from the
expenditure side in annual volume change rates. The real economic growth rate is more
useful than the nominal GDP growth rate because it takes into account the effect that
inflation has on economic data.
Table 1: Portuguese GDP, market prices, expenditure side (volume change rate; annual)
Year Final consumption expenditure of resident households Final consumption expenditure of general government Final consumption expenditure Gross capital formation Domestic demand Exports of goods (FOB) and services Imports of goods (FOB) and services GDP at market prices
2006 1,5 -0,2 1,1 0,0 0,9 12,3 7,5 1,6
2007 2,4 0,7 2,1 2,6 2,2 7,3 5,4 2,5
2008 1,5 0,4 1,3 0,8 1,2 -0,3 2,4 0,2
2009 -2,3 2,6 -1,1 -12,2 -3,5 -10,2 -9,9 -3,0
2010 2,5 -1,3 1,5 3,4 1,8 9,5 7,8 1,9
2011 -3,7 -3,7 -3,6 -14,0 -5,7 7,0 -5,8 -1,8
2012 -5,7 -3,3 -5,0 -18,1 -7,3 3,4 -6,3 -4,0
2013 -1,3 -1,9 -1,4 -5,1 -1,9 6,9 4,7 -1,1
2014 2,4 -0,5 1,7 5,1 2,2 4,3 7,8 0,9
2015Pe 2,6 0,7 2,1 4,7 2,5 6,1 8,2 1,6
2016Pe 2,3 0,5 1,9 -0,6 1,5 4,4 4,5 1,4
The Portuguese GDP had negative volume change rates in 2009, and from 2011 to
2013. In 2014 the economy stabilized. Based on preliminary data, 2015 had a better
performance than 2016. Domestic demand was partially responsible for that, especially
between 2014 and 2015. Exports of goods and services also helped, mostly in 2013 and 2015.
But in the last three years the volume change rate was higher for imports than for exports,
which is not a favorable trend. Final consumption expenditure of general government was
under strict control from 2010 to 2014; had a real growth in 2015 and 2016, yet still under
1% a year. (cf. Table 1)
Table 2: Exports and Imports of Portugal
Imports of goods (FOB) and services Exports of goods (FOB) and services External balance of goods and services Year Total
Imports of goods (FOB)
Imports of
services Total
Exports of goods (FOB)
Exports of services
1=2+3 2 3 4=5+6 5 6 7=4-1
2006 68 750,4 60 460,4 8 289,9 53 652,3 40 199,5 13 452,8 -15 098,1
2007 72 485,4 63 709,3 8 776,1 57 575,9 42 410,8 15 165,1 -14 909,5
2008 74 274,6 64 949,8 9 324,8 57 390,1 41 943,0 15 447,1 -16 884,5
2009 66 909,1 58 125,6 8 783,4 51 532,4 37 156,0 14 376,4 -15 376,6
2010 72 151,5 62 789,8 9 361,7 56 438,9 41 286,3 15 152,7 -15 712,6
2011 67 951,9 58 324,5 9 627,4 60 409,9 44 470,8 15 939,1 -7 542,1
2012 63 654,8 54 615,4 9 039,4 62 467,2 46 052,1 16 415,1 -1 187,7
2013 66 624,2 57 379,6 9 244,6 66 831,0 49 212,2 17 618,8 206,8
2014 71 809,1 61 757,2 10 051,9 69 729,0 51 317,5 18 411,6 -2 080,0
2015Pe 77 705,5 67 007,6 10 698,0 73 993,8 54 698,0 19 295,7 -3 711,8
2016Pe 81 167,5 70 250,0 10 917,5 77 273,3 57 268,8 20 004,5 -3 894,2
Unit: 106€. Pe=preliminary data. Reference year=2011. Source: INE – Statistics Portugal (2017)
Annually there is a significant external unbalance between bought and sold goods
and services. In 2008 was -16.884,5 106€. In 2013 the country reached a positive relation
The trend did not last. The negative results returned in 2015 (-3711,8 106€) and were
a little worst in the following year (-3894,2 106€). Exports are not the issue, they are growing
at a slow but steady rate. Imports are unsustainable for a small economy like Portugal. The
demand for external goods is increasing since 2013 and uncontrollably for the last two years
(higher in 2015 and especially in 2016 than in 2008). The same path is being followed by the
imports of services. (cf. Table 2)
Table 3: Consumer Price Index of Portugal
Period of Reference Total %
Total (except Housing)
%
Dezembro de 2006 3,11 3,10
Dezembro de 2007 2,45 2,43
Dezembro de 2008 2,59 2,56
Dezembro de 2009 -0,83 -0,98
Dezembro de 2010 1,40 1,38
Dezembro de 2011 3,65 3,73
Dezembro de 2012 2,77 2,80
Dezembro de 2013 0,27 0,25
Dezembro de 2014 -0,28 -0,40
Dezembro de 2015 0,49 0,47
Dezembro de 2016 0,61 0,56
Reference year=2012. Source: INE – Statistics Portugal (2017)
The Consumer Price Index (CPI) measures the change in the price of goods and
services from the perspective of the consumer. It is a key way to measure changes in
purchasing trends and inflation. A rise in CPI led to a deepened recession. In the last two
years, the Portuguese CPI is under control after a period of deflation. Housing prices are
Table 4: Portuguese net lending /net borrowing by institutional sector (% of GDP; annual)
Year Total
economy
Non-financial corporations
Financial corporations
General
government Households
2006 -9,5 -7,2 0,4 -4,3 1,9
2007 -8,9 -8,6 2,0 -3,0 1,0
2008 -11,4 -10,5 1,2 -3,8 2,0
2009 -9,0 -5,2 1,7 -9,8 4,8
2010 -9,0 -4,1 2,9 -11,2 3,8
2011 -4,0 -3,5 4,3 -7,4 3,0
2012 0,0 -0,3 3,1 -5,7 3,4
2013 2,3 1,4 2,1 -4,8 4,1
2014 1,0 1,2 4,8 -7,2 2,5
2015Pe 0,3 -0,2 3,8 -4,4 x
2016Pe 1,4 0,4 2,2 -2,0 x
Pe=preliminary data. Reference year=2011. Source: INE – Statistics Portugal (2017)
Net borrowing originates a negative balance also called deficit and occurs when
transactions in financial assets are lower than transactions in liabilities. Net lending can be a
surplus and corresponds to a positive value of the balance of the sector.
Table 4 show financial accounts, to determine if there were savings in diverse sectors
of the economy, as well as in the overall. The total economy did not have a stable
performance between 2006/2016, but seems to have a more or less positive trend since 2013.
Non-financial corporations had a bad 2015, but the years of 2013, 2014 and 2016 were better
that the period of 2006/12. 2013 had an increase of currency and deposits, due to the
investment of saving certificates and Treasury certificated by households; 2014 recorded a
small reduction in the sector. Based on preliminary data, there was a negative financial saving
of the general government of 4.4 per cent of GDP in 2015 and of 2% in 2016 (which
compares with 11,2% in 2010, 7,4% in 2011 and 7,2% in 2014). The reduction in general
government’s net borrowing resulted from the capitalization of the NOVO BANCO (New
The country’s banking system remained problematic until it was concentrated mostly
on foreign hands, which means that now is more stable, but more manipulated from abroad,
and therefore dependent of international interests that may not coincide with ours.
Portugal also took measures to follow the new EU’s bail-in rules that prevent
government aid for banks before investors take a hit.
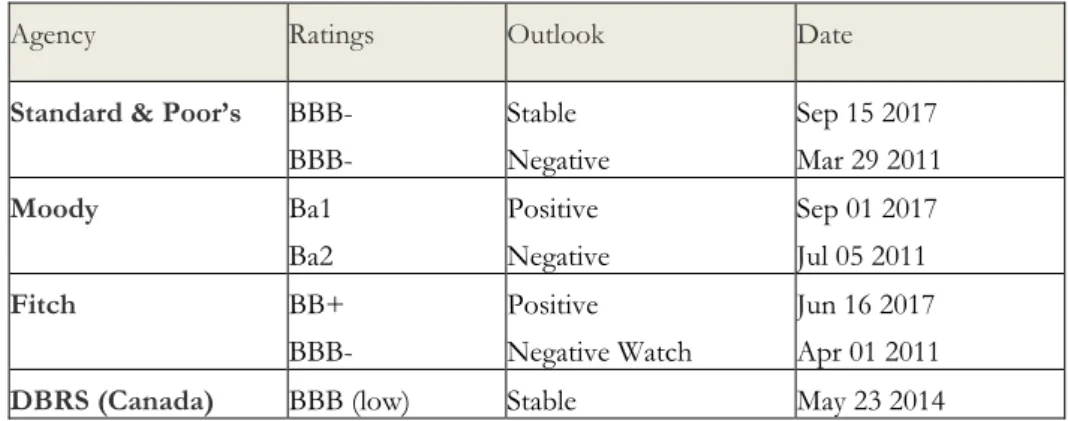
Table 5: Portugal’s Ratings
Agency Ratings Outlook Date
Standard & Poor’s BBB-
BBB-
Stable Negative
Sep 15 2017 Mar 29 2011
Moody Ba1 Ba2
Positive Negative
Sep 01 2017 Jul 05 2011
Fitch BB+ BBB-
Positive Negative Watch
Jun 16 2017 Apr 01 2011
DBRS (Canada) BBB (low) Stable May 23 2014 Source: Trading Economics (2017)
The three biggest credit-rating agencies are Standard & Poor’s, Moody’s and Fitch
with headquarters in New York, USA. DBRS (Dominion Bond Rating Service) is from
Canada and is considered the world's fourth-largest.
Canadian DBRS maintained Portugal above the investment grade level in the last
years. But the other three agencies left Portugal with a junk investment grade from 2011 to
2017, which means the cost of borrowing was considered higher on sovereign and corporate
issuers, based on public debt deterioration and weakening of political commitment to
sustainable economic policies.
Taking in consideration the country’s recent economic progress, Standard & Poor’s
but “stable” means the agency may not downgrade the forecast in the medium term. Also
helped the fact that the World Economic Outlook for 2017 of the International Monetary Fund
very recently raised growth projections for Portugal. The country still needs to maintain the
good work, before is considered sustainable, but it’s better that going downhill.
2.
INTERNAL FRAGILITIES
Portugal was shaken by an external shock in 2008. But the country had internal
problems that made it vulnerable and stuck in a vicious circle of time-wasting and
money-consuming economic reforms with feeble results, high sovereign debt, low productivity and
disappointing economic growth that cannot pay its highly sophisticated social model of
pensions, unemployment benefits and subsidies, grants and subventions of diverse types and
applications.
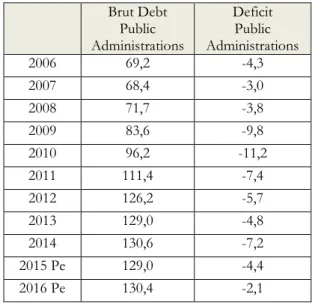
The country spends way more than produces. In spite of all the external supervision
and the implementation of austerity programs, the country never truly decreased the public
administration’s brut debt in percentage of the GDP (only a small inch in 2015). In 2006, the
indicator was 69,2%. In 2016, according to preliminary data, stretches until 130,4%. (cf. Table
Table 6: Debt and Deficit (% of GDP)
Brut Debt Public Administrations
Deficit Public Administrations
2006 69,2 -4,3
2007 68,4 -3,0
2008 71,7 -3,8
2009 83,6 -9,8
2010 96,2 -11,2
2011 111,4 -7,4
2012 126,2 -5,7
2013 129,0 -4,8
2014 130,6 -7,2
2015 Pe 129,0 -4,4
2016 Pe 130,4 -2,1
Pe: Preliminary Data Source: Pordata (2017)
In terms of deficit of the public administration in percentage of the GDP, the worst
case scenario was reached in 2010, before the bail-out, with 11,2%. In 2016, the situation was
better around 2,1%, which is lower that the target defined by the EU (3% of the GDP).
In 2017 things are no longer as bad as they were in 2011/14. But the situation could
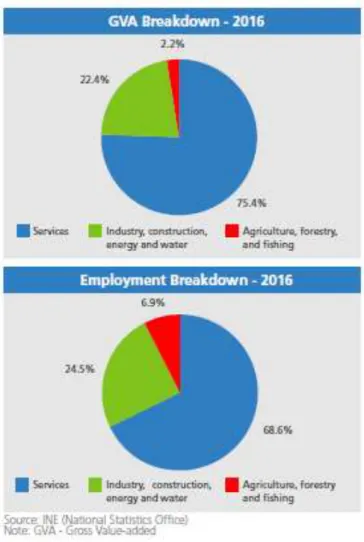
be more stable and sustainable if the country was more industrialized. (cf. Graphic 1).
Industry, construction, energy and water represented only 22,4% of the Portuguese
gross value added (GVA) and 24,5% of the employment in 2016. That’s low. Unless the
country wants to continue only specialized in services (75,4% of GVA and 68,6% of
employment) which perpetuates its vulnerability in other sectors, governmental policies must
address the situation immediately.
Portugal needs more industries with large scale production of goods that may create
new job opportunities, that prevent unemployment and poverty like other sectors can’t
guarantee, in all regions, including the interior of the continent and islands. Industrialization
should respect natural resources, and not produce much pollution of land, air and water,
since the country is planning its future, not just fixing its present.
Graphic 1: GVA and Employment Breakdown – 2016
Source: AICEP (2017a)
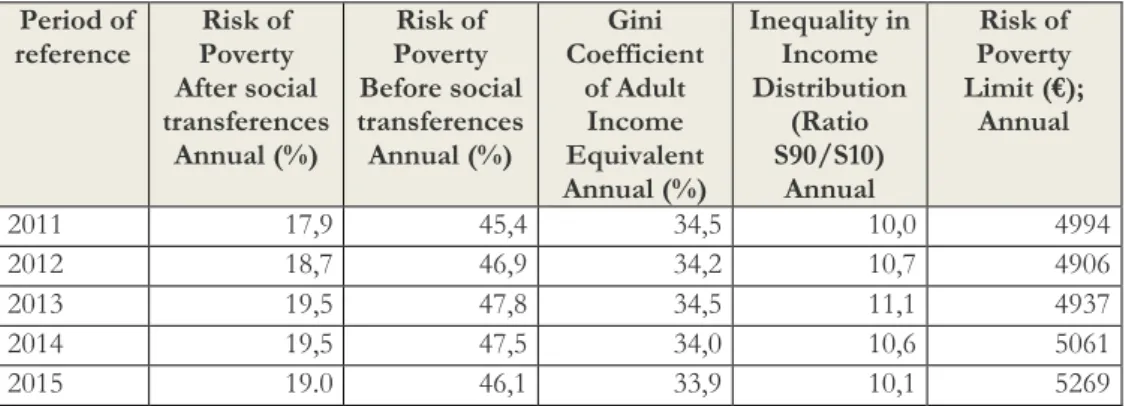
Between 2011/15 the risk of poverty in Portugal was under 20% after social
transferences. But was almost 50% before governmental assistance. That is seriously negative
in a state-member of the EU that supposedly belongs to the wealthiest group of countries in
the world. It also has high inequality income distribution, which affects social cohesion and
Table 7: Risk of Poverty of Portugal Period of reference Risk of Poverty After social transferences Annual (%) Risk of Poverty Before social transferences Annual (%) Gini Coefficient of Adult Income Equivalent Annual (%) Inequality in Income Distribution (Ratio S90/S10) Annual Risk of Poverty Limit (€); Annual
2011 17,9 45,4 34,5 10,0 4994
2012 18,7 46,9 34,2 10,7 4906
2013 19,5 47,8 34,5 11,1 4937
2014 19,5 47,5 34,0 10,6 5061
2015 19.0 46,1 33,9 10,1 5269
Source: INE – Statistics Portugal (2017)
S90/S10 is the ratio of the 10% of people with highest income (upper bound value
of the ninth decile) to that of the first decile. The indicator was 10,7 in 2012. In 2015 was a
bit lower, around 10,1.
The Gini coefficient compares cumulative proportions of the population with
cumulative proportions of income they receive. It ranges between 0% (perfect equality) and
100% (perfect inequality). In Portugal was 34,5% in 2011 and 2013, and 33,9% in 2015.
In 2015, the risk of poverty limit was annually 5269 euros and monthly 439 euros.
Back in 2012 was 4906 annually and around 409 euros monthly. The overall situation is
getting better even though may be considered low in the EU. (cf. Table 7)
Table 8: Unemployment Rates (%) of Portugal
2016 2015 2014 2013 2012 2011
Man and Woman
11,1 12,4 13,9 16,2 15,5 12,7
Man 11, 0 12,2 13,5 16, 0 15,6 12,3
Woman 11,2 12,7 14,3 16,4 15,5 13, 0
Unemployment rates have been improving (11,1% in 2016). In the case of woman
are still higher than man’s (except in 2012). (cf. Table 8) But the country recovered from a
very difficult stand point (16,2% in 2013)
When the labor market was under stress and could not offer as many opportunities
as its active population needed, the country suffered the strongest emigration trend since the
1960´s. And it was one of the countries with highest emigration in proportion of its
population of the EU. In total, lost up to 20% of its active population to migration.
Table 9: Resident Populations in Portugal – By Region
Portugal North Center Lisbon Alentejo Algarve Azores Madeira
Total Population (Nº)
2010 10 572 721 3 693 585 2 331 642 2 822 761 758 707 451 304 246 757 267 965 2011 10 542 398 3 687 224 2 316 169 2 827 050 754 385 446 140 247 194 264 236 2012 10 487 289 3 666 234 2 298 938 2 818 388 748 699 444 390 247 549 263 091 2013 10 427 301 3 644 195 2 281 164 2 807 525 743 306 442 358 247 440 261 313 2014 10 374 822 3 621 785 2 263 992 2 809 168 733 370 441 468 246 353 258 686 2015 10 341 330 3 603 778 2 256 364 2 812 678 724 391 441 929 245 766 256 424
Men (Nº)
2010 5 053 543 1 768 846 1 113 554 1 335 590 367 484 220 145 121 518 126 406 2011 5 030 437 1 763 848 1 103 433 1 336 350 365 209 216 150 121 693 123 754 2012 4 995 697 1 750 568 1 093 565 1 329 450 362 261 214 946 121 768 123 139 2013 4 958 020 1 736 838 1 083 228 1 321 167 359 439 213 656 121 646 122 046 2014 4 923 666 1 720 635 1 073 816 1 321 402 353 231 212 756 120 758 121 068 2015 4 901 509 1 709 888 1 069 996 1 320 895 348 859 211 884 120 352 119 635
Women (Nº)
2010 5 519 178 1 924 739 1 218 088 1 487 171 391 223 231 159 125 239 141 559 2011 5 511 961 1 923 376 1 212 736 1 490 700 389 176 229 990 125 501 140 482 2012 5 491 592 1 915 666 1 205 373 1 488 938 386 438 229 444 125 781 139 952 2013 5 469 281 1 907 357 1 197 936 1 486 358 383 867 228 702 125 794 139 267 2014 5 451 156 1 901 150 1 190 176 1 487 766 380 139 228 712 125 595 137 618 2015 5 439 821 1 893 890 1 186 368 1 491 783 375 532 230 045 125 414 136 789
Table 9 is all about resident populations in Portugal, for the entire country as well as
by region. The general outlook is negative, because numbers decreased significantly between
2010 and 2015. The emigration trends seem to be changing in the two most developed
regions, Lisbon and Algarve, especially because of woman, who are increasing in these areas.
Table 10: Resident Populations in Portugal – By Region
Portugal North Center Lisbon Alentejo Algarve Azores Madeira
Effective Growth Rate (%)
2010 -0,01 -0,34 -0,26 0,52 -0,44 1,22 -0,06 0,47
2011 -0,29 -0,17 -0,67 0,15 -0,57 -1,15 0,18 -1,40
2012 -0,52 -0,57 -0,75 -0,31 -0,76 -0,39 0,14 -0,43
2013 -0,57 -0,60 -0,78 -0,39 -0,72 -0,46 -0,04 -0,68
2014 -0,50 -0,62 -0,76 0,06 -1,35 -0,20 -0,44 -1,01
2015 -0,32 -0,50 -0,34 0,12 -1,23 0,10 -0,24 -0,88
Natural Growth Rate (%)
2010 -0,04 0,02 -0,34 0,22 -0,54 0,08 0,10 -0,04
2011 -0,06 Ә -0,34 0,21 -0,52 -0,01 0,15 -0,03
2012 -0,17 -0,12 -0,47 0,11 -0,60 -0,15 0,11 -0,20
2013 -0,23 -0,17 -0,51 0,03 -0,65 -0,24 -0,04 -0,23
2014 -0,22 -0,17 -0,49 0,06 -0,65 -0,21 Ә -0,38
2015 -0,22 -0,17 -0,50 0,04 -0,68 -0,17 -0,02 -0,26
Migration Growth Rate (%)
2010 0,04 -0,35 0,08 0,29 0,10 1,14 -0,16 0,51
2011 -0,23 -0,17 -0,32 -0,05 -0,05 -1,14 0,03 -1,37
2012 -0,36 -0,45 -0,27 -0,41 -0,16 -0,24 0,03 -0,23
2013 -0,35 -0,43 -0,27 -0,42 -0,07 -0,22 Ә -0,45
2014 -0,29 -0,44 -0,27 Ә -0,70 0,01 -0,44 -0,63
2015 -0,10 -0,32 0,17 0,09 -0,55 0,27 -0,22 -0,62
Source: INE – Statistics of Portugal (2016)
Population is defined as the number of people that live in Portugal. Growth rates are
the annual changes in population resulting from births, deaths and net migration during the
The effective growth rate was negative in the period 2010/2015, except in Lisbon
(0,52% in 2010 and 0,12% in 2015) and Algarve (1,22% in Algarve and 0,1% in 2015). The
patterns translate perfectly the impact of the international crisis in the country.
Natural growth represents the births and deaths in a country's population and does
not take into account migration. It’s the difference between natality rate and mortality rate.
They were only moderately positive in the Lisbon area.
The migration growth rate for 2015 corroborate the indicators analyzed before. Many
Portuguese citizens rather emigrate than try to establish themselves in the country that has
invested in their formal education for decades. This pattern could be explained with lack of
employment or working conditions, but there is also lack of patriotism, of private
entrepreneurship and unwillingness to perform certain activities in Portugal that sometimes
are done abroad. It must be a cultural thing.
3. EXTERNAL DEPENDENCY
Portugal had some economic recovery, especially in the last two years. It is still
unsustainable, because of its domestic vulnerabilities, but also its external dependency. Table
11 has information about the country’s liquid external debt, the emigrants’ remittances and
Table 11: Data (% of GDP)
Liquid External
Debt
Emigrants’ Remittances
Public Transferences
from the European Union
Public Transferences
for the European Union
2006 56,6 1.5 2,3 1,1
2007 64,7 1,5 2,2 0,9
2008 74,6 1,4 2 0,9
2009 82,9 1,3 2,3 1,1
2010 81,2 1,3 2,6 1,1
2011 84,5 1,4 2,8 1,1
2012 101,8 1,6 3,4 1,1
2013 99,8 1,8 3 1,1
2014 104,8 1,8 2,6 1
2015 Pe 101,5 1,8 2,3 1
2016 Pe 94,4 1.8 2,1 1
Pe: Preliminary Data Source: Pordata (2017)
Back to 2006, the liquid external debt was more or less controlled, around 56,6% of
the GDP. It is frightening how escalated up to 101,8% of GDP in six years, which is almost
the double. An international crisis was partially responsible for this disaster and the financial
assistance may also have contributed for it but, in the overall, it’s clear that the country was
badly managed in this period. The situation simply shouldn’t had reached the 104,8% of the
GDP in 2014. Indicators have decreased since then, which is good. But unless they return to
the preexistent situation, around 50% of the GDP, the situation is not sustainable, will
Graphics 2/3: Geographical Distribution of Exports and Imports of Goods – by Regions
Source: AICEP (2017a)
Another indicator of dependency is the fact that Portugal is not diversifying markets
or opportunities to grow faster without being subjected to chocks as much as before. It’s
increasingly trading inside the EU when the regional block cannot give, for the time being,
new big chances to Portuguese exporting companies.
The Eurozone had some gradual improvement in the last two years, but its markets
are over booked and the eastern countries are in direct competition with Portugal’s economy.
Exports for the EU represented 72,8% in 2015, but were higher in 2016 (75,2%). Portuguese
imports from the EU were 76,5% in 2015 and 77,7% in 2016. (cf. Graphics 2 and 3)
Spain, France and Germany are three privileged countries for Portugal, from a client
negative impact in a country that is already counting possible losses because of Brexit. (cf.
Graphics 4 and 5)
The UK bought 7% of the Portuguese goods in 2016 (6,7% in 2015) and sold 3,1%
of merchandises to Portugal in the last two years. Thus Brexit can be an issue for Portugal.
UK is a traditional client and supplier for many years, since the time of EFTA, and even
before.Negotiations are still in the beginning, so things still depend of the final agreement.
Some sort of compromise must be found for settling a treaty out the new relationship, to be
ratified and implemented which is all time-consuming.
Graphics 4/5: Geographical Distribution of Exports and Imports of Goods – by Countries
Source: AICEP (2017a)
The Graphics 6 and 7 display information about FDI inflows and outflows. But
interpreting data requires some precaution, since several Portuguese companies moved to
being penalized by the government or by the markets. Apparently this country had less
restrictive laws and a more effective justice system. Therefore, large financial flows from
Portugal to the Netherlands and back again are not real investments but rather round-trip
investments. Dutch letterbox companies are used to avoid paying taxes in Portugal. There is
no double taxation.
Graphics 6/7: Geographical Distribution of FDI – by Countries
Source: AICEP (2017a)
Portugal is also heavily dependent of its neighboring country. Not only because Spain
is the largest client and supplier of goods, but also for being the second biggest country of
origin and destination of FDI. This cannot continue for much longer. It’s totally
4.
PORTUGAL
–
ECONOMIC RECOVERY
4.1. MAIN GEOPOLITICAL AND GEO-ECONOMIC CHALLENGES
Portugal is reversing the trend of crisis or loss of credibility, following a gradual, slow but hopefully steady path of restructuring. Besides Brexit, the country will be dealing with challenges that other state-members of the EU will also face.
Geopolitical instability around the world creates problems, since markets need stability to trade, for transferences and plans of FDI. Economy of war (like selling and buying weapons) involves millions of euros but its risks for society do not compensate them at all.
Terrorist attacks do destabilize the system, especially people’s rational decisions to go or not
go somewhere and why, and therefore revenues in the sector of tourism.
Digital and data flows are also being discussed in the EU. This is a tricky subject that governments are trying to address as possible, for it affects cybercommerce (e-commerce), security on the internet and jobs. It will open a door to a paradigm shift, given its social impact. The question is not how technology will change in the future, but how people will cope with it.
The level of confidence in the EU’s institutions is also shifting and turning. During the
acute phase of the Euro crisis, confidence declined considerably. Things are a little better now,
but there is general disinterest and distance from people and the communitarian establishment.
Brussels’ bureaucracy seems to be pushing for an agenda that is not scrutinized in elections or
referendums with fear that citizens may not want it. That’s not democratic and may lead to
4.2. PEACEFUL COUNTRY
Portugal was considered the fifth most peaceful country of the world in 2016. This is good for domestic reasons, for the overall well-being of its citizens. It is also import for international trade, FDI and tourism. (cf. Table 12)
The relevance of this indicator can be checked in the Map 1. It gives a big picture about peace and security prospects globally. In fact, Portugal is well positioned nowadays as a sanctuary or refuge economy, and an alternative to other concurrent markets like Spain, France, Italy, Greece, the UK, eastern European countries or even from north of Africa.
Things may change if a bloody terrorist attack occurs in Portugal. Which doesn’t mean the
country doesn’t have problems about security with economic negative impact, concerning locals as well as foreigners, since there are large scale fires every summer. A major issue that must be resolved quickly.
Table 12: Global Peace Index – 2016
Rank Country Index State of the Peace
1 Iceland 1,192 Very High
2 Denmark 1,246 Very High
3 Austria 1,278 Very High
4 New Zealand 1,287 Very High
5 Portugal 1,356 Very High
6 Czech Republic 1,360 Very High
7 Switzerland 1,370 Very High
8 Canada 1,388 Very High
9 Japan 1,395 Very High
10 Slovenia 1,408 Very High
25 Spain 1,604 High
39 Italy 1,774 High
46 France 1,829 High
47 UK 1,830 High
82 Greece 2,044 Medium
Map 1: Global Peace Index – 2016
Source: Institute for Economics & Peace (2016)
Map 2 can be compared with Map 1. Shows where the Portuguese government is encouraging companies to trade and invest. The Aicep Portugal Global – Trade & Investment is a one-stop-shop partner with an extensive foreign network working with the Ministry of Foreign Affairs to help in the process of internationalization, as well as export and investment prospects and activities.
Source: AICEP (2017b)
Portugal doesn’t target only very peaceful markets. It follows the money, the
resources, but also tries to maintain cultural ties of decades, if not centuries, kept from the
days when Portugal was a global empire. The AICEP network, takes this legacy into account and it spreads in countries where the EU may not have specific interests.
4.3. TOURISTIC COUNTRY
Prospects are increasingly good in the sector of services. According to the travel and
tourism competitiveness index of 2017, Portugal was the 14th country in a high paced ranking,
which corresponds to a better position than in 2015. It helps the fact that it is a peaceful
country.
Table 13: The Travel & Tourism Competitiveness Index – 2017
Country/Economy Ranking Score Change since
2015
Spain 1 5.43 0
France 2 5.32 0
Germany 3 5.28 0
Japan 4 5.26 5
United Kingdom 5 5.20 0
United States 6 5.12 –2
Australia 7 5.10 0
Italy 8 4.99 0
Canada 9 4.97 1
Switzerland 10 4.94 –4
Hong Kong SAR 11 4.86 2
Austria 12 4.86 0
Singapore 13 4.85 –2
Portugal 14 4.74 1
China 15 4.72 2
Spain continues to lead the index in 2017, as previously in 2015. Since it is a
neighboring country, Portugal may benefit from that. There are six European countries in
the top 10 and eight in the top 15, which means that the continent is still preferred as
destination by tourists worldwide.
Graphics 8/9: Indicators of Tourism in Portugal
Source: AICEP (2017a)
Portuguese indicators of Tourism like revenue and bed nights according to the country of origin are shown in the Graphics 8 and 9. In the overall French, British, Spanish and Germans were our main costumers in 2016.
The UK corresponded to 17,9% of the revenue and 23,9% of the bed nights. British tend to buy less expensive vacations in Portugal and go mostly to Lisbon and Algarve.
In 2016, Spain related to 12,9% of the revenue and 10,3% of the bed nights. Many Spanish tourists come comfortably by car and easily visit the continental part of Portugal,
for they don’t live very far from our borders. Since plane tickets so not very expensive, this market can expand to the entire country in the following years.
Germany booked 13,7% of bed nights and represented 11,7% of the revenue left in Portugal in 2016. These tourists usually like the peaceful and sunny characteristics of our country.
5.
UNITED
STATES
OF
EUROPE
–
PORTUGAL’S
PROSPECTS
Portugal is a state-member of the EU. The regional block doesn’t have to become a
federation. If it does, in the nearby future, that means Portugal will become a state of the
United States of Europe.
As peripheral, with only ten million people and limited territory, already has
difficulties defending itself in a proportional system that favors countries that are bigger in
number and extension of land. Without the UK (strong financial market but geographically
as western as Portugal) in the equation, the center of operations will inevitably move east,
probably lead by France (the armed force) and Germany (the economic power) of the EU.
With no external policy of its own, Portugal will be discouraged to have privileged
the Portuguese language nations). It will import rival tensions from Spain (in the north of
Africa and in Latin America), Germany (with Russia and ex-soviet republics) and France in
different parts of the world and Portugal doesn’t. At the very best, Portugal may negotiate
good financial agreements capable of buying a peacefully full integration.
But Portugal is an Atlantic country and a State-Nation (one State, one Nation) that
claims to have the oldest and most stable frontiers of the European continent (from the XIIth
century onwards). It was the first global empire of the world and the only European empire,
after the romans that lasted over five centuries (1415/1999). This means that it’s an historical
country that should be able to govern itself without constant and overwhelming
supranational supervision.
This is not the first time that Portugal surrenders towards external pressure. Between
1580/1640 Portugal accepted the domination of the House of Habsburg of Filipe II,
inherited from the Holy Roman Emperor Charles V. Today Germany rules the EU and
Portuguese banks are under Spanish influence. It’s not the same thing but, in the overall, is
not that much different.
Portugal is negotiating the extension of its continental platform. Thus one of the
possibilities is becoming a country for phishing, specialized in the ocean and the exploration
of its resources (something like Alaska in the USA).
Another hypothesis is Portugal becoming specialized in services, in tourism (probably
a Florida in the USA) or entertainment and the arts.
In a Federation, the UE will represent our country in almost everything outside the
regional block. Portugal will never become a relevant power in international relations again
again, a restrictive path that can still be reverted with a different and more self-governing
national paradigm.
CONCLUSION
Portugal is a state-member of the EU that was negatively impacted by the financial
international crisis of 2008. The country received external assistance and supervision from
Troika (International Monetary Fund, European Central Bank and European Commission)
between 2011 and 2014.
Since then financial indicators were corrected, at least temporarily and economic
indicators are being slowly addressed. Short-term reforms were implemented. But many
structural unbalances coexist with higher expectations that may not be fulfilled, unless the
country’s budget pays for them, which is not currently healthy, with low economic growth,
for it would mean more deficit and debt from public administrations. The situation is not
stable yet. Thus problems may rise again, sooner or later.
Portugal is an open economy that should benefit from it, rather than be penalized by
the fact that its imports are constantly higher and growing faster than exports. As a small
market with limited material resources, should at least have strong human capital, capable of
overcoming vulnerabilities and transforming them into opportunities, since the biggest
advantages of a country can also be its biggest advantages. Unfortunately strong emigration
allowing the country to recover as fast as it could. The good thing is that Portuguese
emigrants are sending higher remittances to its country of origin. These financial
transferences contribute positively to the GDP.
As one of the most peaceful countries in the world nowadays, Portugal is benefiting
from the fact; especially in terms of tourism and overall services. Since the country is
becoming more and more specialized in those sectors, the GDP is growing with the help of
exports and also a bit pushed by internal demand. Bu the lack of industrialization doesn’t
make this pattern sustainable in the long run, also because imports of manufacturing goods
are increasing in a startling way.
As an Atlantic country, Portugal is a door to a big ocean and nurtures big
expectations, as a mediator in multilateral negotiations or as a partner in multilevel
agreements, some of them not yet fully accomplished. The situation may even be more
complicated, from the political and economic standpoint, if the UE becomes a federation of
BIBLIOGRAPHY
AICEP (2017a). “Portugal –Basic Data”. AICEP – Portugal Global, March. Pp. 1-10.
AICEP (2017b). “Overseas Network – ENG”. AICEP in the World, Mapa Rede Externa, Multimedia. (Accessed September 14th 2017) URL:
http://www.portugalglobal.pt/PT/sobre-nos/multimedia/mapa-rede-externa/Documents/MAPA-REDE-EXTERNA-AICEP-2016-ENG.pdf
INE – STATISTICS OF PORTUGAL (2016). “Publication – Tables” In Demographic Statistics – 2015”. Digital Library. (Accessed September, 14th 2017). URL:
https://www.ine.pt/xportal/xmain?xpid=INE&xpgid=ine_publicacoes&PUBLICACOES pub_boui=275533085&PUBLICACOESmodo=2&xlang=en
INE –STATISTICS OF PORTUGAL (2017). “Portuguese National Accounts – ESA2010,
base 2011”. Digital Library. (Accessed September, 14th 2017) URL:
https://www.ine.pt/xportal/xmain?xpgid=ine_main&xpid=INE
INSTITUTE FOR ECONOMICS & PEACE (2016). “Global Peace Index 2016 – Ten
Years of Measuring Peace”. IEP, June, pp. 1-116.
PORDATA (2017). "Payments Balance". Pordata – Francisco Manuel dos Santos Foundation, Macroeconomy, Portugal. (Accessed September, 14th 2017) URL: https://www.pordata.pt/
TRADING ECONOMICS (2017). “Portugal –Credit Ratings”. (Accessed September, 16th
2017) URL: https://tradingeconomics.com/portugal/rating
WORLD ECONOMIC FORUM (2017). “The Travel & Tourism Competitiveness Report 2017”, WEF in the framework of Economic Growth and Social Inclusion System Initiative